- Analytics
- News and Tools
- Quotes
- Chart and quotes for XAGUSD
Quotes and rates for precious metals Silver vs US Dollar (XAGUSD)
| Date | Rate | Change |
|---|
Related news
-
01.02.2024 19:43Silver Price Analysis: XAG/USD remains bearish despite reclaiming $23.00
- Silver surges over 1% to $23.17, lifted by central bank decisions and declining global bond yields.
- Testing resistance at 100-DMA, with next targets at 200-DMA and 50-DMA for further gains.
- Potential downward shifts could push silver towards support at $22.50, $22.00, and January's low.
Silver price rises late in the North American session as traders digest the latest central bank’s decisions across both sides of the Atlantic. The Federal Reserve and the Bank of England held rates unchanged, and both signaled that the likelihood of cutting interest rates increases as the disinflation process evolves. That tumbled global bond yields and boosted precious metals. The XAG/USD exchanges hands at $23.17, up more than 1%.
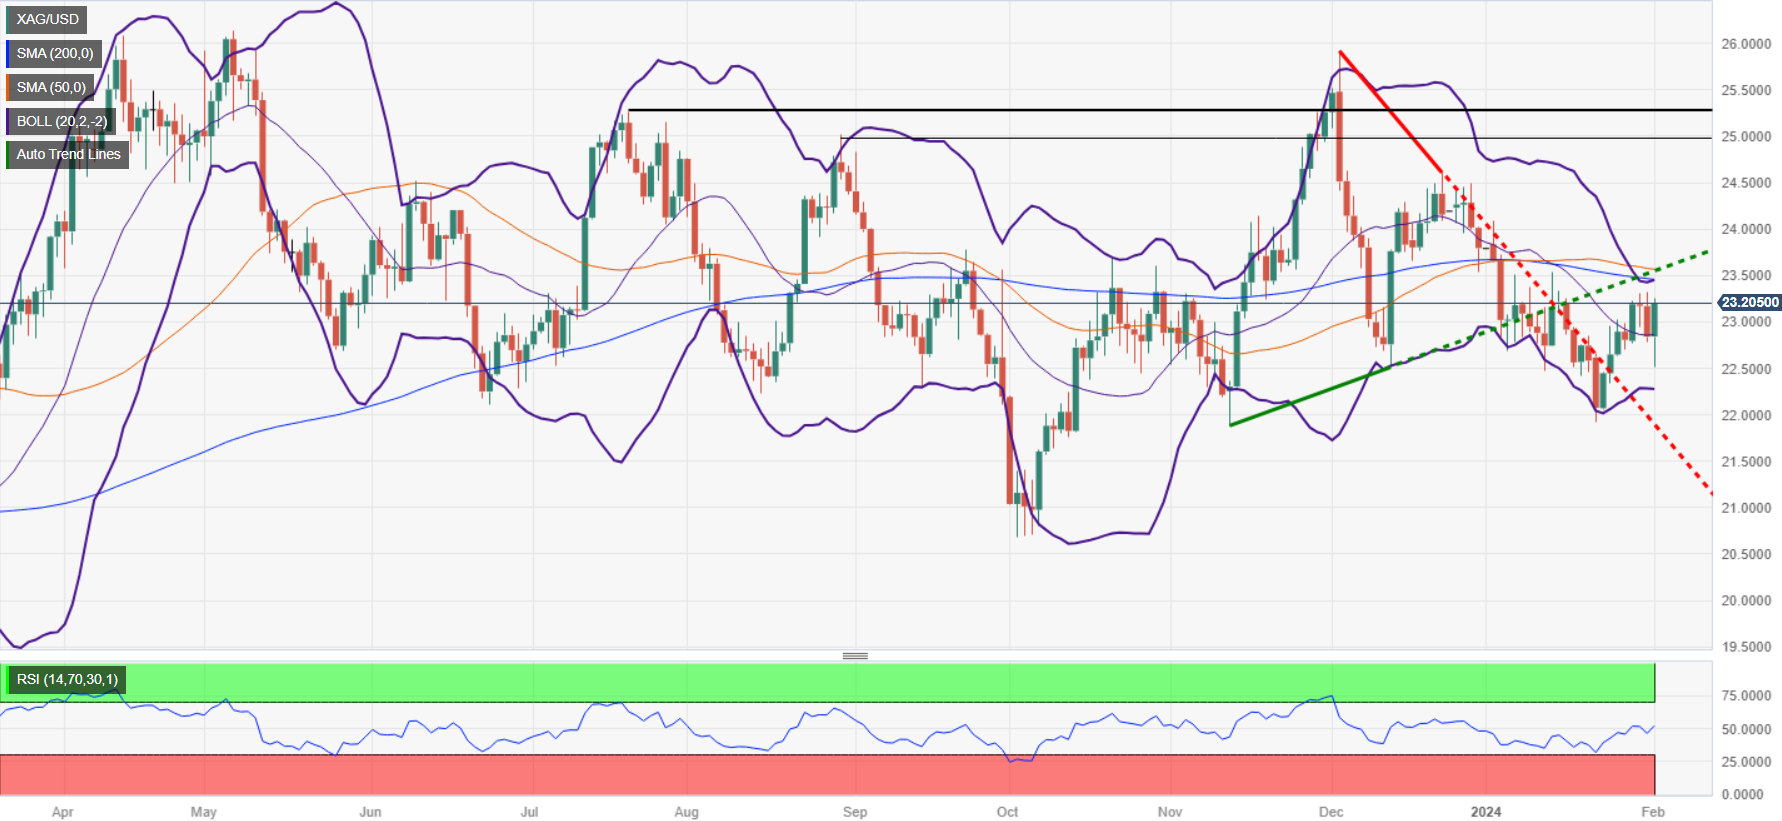
The XAG/USD is neutrally biased, but as of writing, it is challenging resistance at the 100-day moving average (DMA) at $23.14. A decisive break could open the door to test the 200-DMA at $23.44, followed by the 50-DMA at $23.55. Further upside is seen once that resistance area is cleared at the psychological $24.00 figure.
However. If Silver slumps below $23.00, that could exacerbate a drop toward $22.50, December 13 low, followed by the $22.00 figure. The next buying zone lies at a January 22 low of $21.93.
XAG/USD Price Action – Daily Chart
XAG/USD Technical Levels
-
01.02.2024 08:50Silver Price Forecast: XAG/USD declines toward $22.70 as Fed is in no rush for rate cuts
- Silver price faces a sell-off as the Fed pushes back rate-cut expectations for March.
- The Fed avoids rate-cut speculation until it gets confident that inflation will return to 2%.
- Investors await the ISM Manufacturing PMI and the NFP data for further guidance.
Silver price (XAG/USD) declines toward a weekly low near $22.70 as the Federal Reserve (Fed) has delivered a neutral interest rate guidance for the March monetary policy meeting. The Fed kept interest rates unchanged in the range of 5.25-5.50% as expected but pushed back expectations of rate cuts in March.
Equities and risk-perceived currencies have parted ways as S&P500 futures are positive, while the latter has been hit hard amid the absence of timing for rate cuts in the monetary policy statement by Fed Chair Jerome Powell. The US Dollar Index (DXY) extends its rally to near 103.80 as the Fed is not interested in speculating on rate cuts until they get greater confidence that inflation will sustainably return to the 2% target.
Meanwhile, investors await the Institute of Supply Management (ISM) Manufacturing PMI for December, which will be published at 15:00 GMT. According to the consensus, the Manufacturing PMI dropped to 47.0 vs. the prior reading of 47.4.
Going forward, market participants will focus on the Nonfarm Payrolls (NFP) data for January, which will be announced on Friday. The ADP Employment Change data, released on Wednesday, has set a weak ground for the official labor market data. Investors see that US employers hired 180K job-seekers, which are significantly lower than former payroll additions of 216K. The Unemployment Rate is seen rising to 3.8% against a 3.7% reading in December.
Silver technical analysis
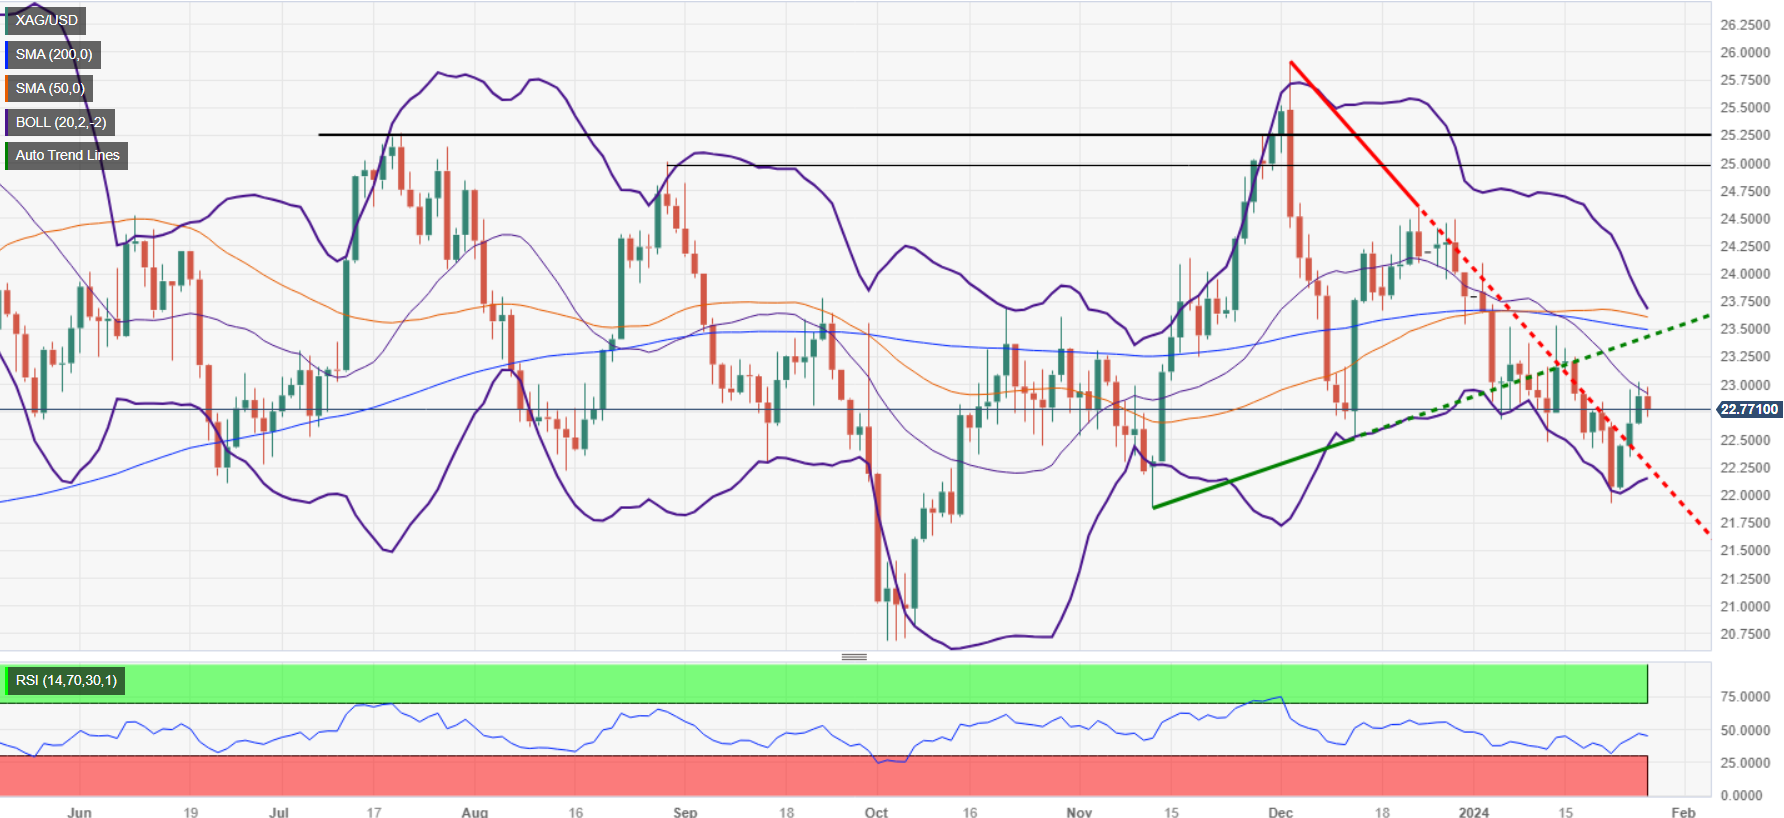
Silver price has formed an Evening Star candlestick pattern on a daily timeframe, which indicates a bearish reversal. The asset has failed to sustain above the 20-day Exponential Moving Average (EMA), around $23.00. The 14-period Relative Strength Index (RSI) oscillates in the 40.00-60.00, which indicates a sideways trend.
Silver daily chart
-638423741405446338.png)
-
31.01.2024 14:30Silver Price Forecast: XAG/USD consolidates slightly above $23 ahead of Fed policy
- Silver price fails to get a directional steer despite downbeat US private Employment data.
- The USD index witnesses a sell-off as expectations for rate-cut in March by the Fed have slightly improved.
- Focus remains on the Fed’s monetary policy.
Silver price (XAG/USD) trades sideways slightly above the $23.00 resistance in early New York session on Wednesday. The white metal fails to get a directional steer even though the United States Automatic Data Processing (ADP) has reported weaker-than-projected Employment data for January.
The US ADP has reported that 107K workers were hired by private employers against expectations of 145K and the prior reading of 158K. As per the CME Fedwatch tool, expectations for rate-cut in March have increased slightly above 50% after the release of the downbeat US Employment data.
The US Dollar Index (DXY) has witnessed an intense sell-off, dropped to near 103.20. 10-year US Treasury yields have dropped to near 4.02%.
Going forward, investors await the monetary policy decision by the Federal Reserve (Fed). The Fed is widely anticipated to keep interest rates unchanged in the range of 5.25-5.50% for the fourth straight time. Investors would focus on whether slowing demand for labor would impact the outlook on interest rates by Fed policymakers. Dovish signals for March monetary policy meeting would strengthen the appeal for the Silver price bulls.
Silver technical analysis
Silver price has strengthened after delivering a decisive break above the downward-sloping trendline plotted from December 3 high at $25.92. The white metal is expected to find immediate resistance near $23.53. The near-term appeal for the Silver price has turned bullish as it is sustaining above the 50-period Exponential Moving Average (EMA), which trades around $22.90.
The 14-period Relative Strength Index (RSI) has shifted into the bullish range of 60.00-80.00, which indicates that momentum has leaned towards bulls’ side.
Silver four-hour chart
-638423081689604375.png)
-
30.01.2024 08:18Silver Price Forecast: XAG/USD extends upside above $23.20 ahead of Fed policy
- Silver price jumps to near $23.20 as geopolitical tensions deepen.
- Forward action in the FX domain will be guided by the Fed’s monetary policy.
- Investors will focus on the US JOLTS Job Openings data in today’s session.
Silver price (XAG/USD) climbs above $23.20 in the early European session. The white metal has capitalized on mounting Middle East tensions, which have improved appeal for safe-haven assets. However, forward action will be guided by the interest rate decision from the Federal Reserve (Fed), which will be announced on Wednesday.
S&P500 futures have posted some losses in the Asian session, portraying a decline in the risk-appetite of the market participants. The US Dollar Index (DXY) has rebounded above 103.50 amid uncertainty ahead of the Fed’s policy. 10-year US Treasury yields have dropped to near 4.05%.
Considering poll from the CME Fedwatch tool, traders are confident that interest rates will remain unchanged in the range of 5.25-5.50%. Investors’ expectations for the first rate-cut decision by the Fed have shifted for May against earlier expectations of March. The US economy is performing well on the grounds of labor market and consumer spending, which could keep price pressures unabated.
Before Fed’s policy, investors will focus on the US JOLTS Job Openings data for December, which will be published at 15:00 GMT. According to the estimates, US employers advertised fresh requirement of 8.75M jobs, slightly lower from 8.79M in November.
Silver technical analysis
Silver price advances towards the resistance zone placed in a narrow range around $23.50 on a two-hour scale. The 50-period Exponential Moving Average (EMA) at $22.90 continues to provide support to the Silver price bulls.
The Relative Strength Index (RSI) (14) has shifted into the bullish range of 60.00-80.00, which indicates that momentum has leaned towards the upside.
Silver two-hour chart
-638421994842167174.png)
-
29.01.2024 08:26Silver Price Analysis: XAG/USD soars to near $23 as Middle East tensions mount
- Silver price rises to near $23 as geopolitical tensions improve safe-haven bets.
- The Fed is expected to maintain the status-quo for the fourth time in a row.
- Silver price eyes a decisive break above $23.
Silver price (XAG/USD) jumps to near $23 as deepening geopolitical tensions improve appeal for bullions. The white metal witnesses significant buying interest as volatility expands due to deepening Middle East crises.
Geopolitical tensions heightened after three US service members were killed, stationed in northeastern Jordan by an aerial drone attack. Meanwhile, continuous attacks on commercial shipments through Red Sea have kept broader markets on their toes.
However, White House National Economic Council director Lael Brainard said last week that Iran-backed Houthi’s attacks on ships in the Red Sea appear to have less impact on their supply chain against other economies.
This week, market participants will focus on the first interest rate decision of 2024 by the Federal Reserve (Fed), which will be announced on Wednesday. The Fed is expected to keep interest rates unchanged in the range of 5.25-5.50% for the fourth straight time.
Investors would keenly focus on whether Fed policymakers would soften their tone for the “restrictive interest rates” narrative amid moderate increase in core Personal Consumption Expenditure (PCE) price index data for December, released last week.
Silver technical analysis
Silver price aims to deliver a breakout of the consolidation formed in a range of $22.60-23.00 on a two-hour timeframe. The white metal may extend its upside journey towards the horizontal resistance placed from January 5 high around $23.52. The 50-period Exponential Moving Average (EMA) near $22.75 continues to provide support to the Silver price bulls.
The 14-period Relative Strength Index (RSI) attempts to climb above 60.0. If the RSI (14) manages to sustain above the same, a bullish momentum would get triggered.
Silver two-hour chart
-638421135340347548.png)
-
26.01.2024 20:05Silver Price Analysis: XAG/USD slips below $23.00
- Silver prices dip, unable to hold above key $23.00 level, indicating a possible ongoing downtrend.
- Break below major supports like 200, 50, and 100-day DMAs strengthens bearish outlook for silver.
- Buyer resistance seen at $23.00 and 100-DMA ($23.15); fall below $22.51 may lead to $22.00, $21.93 supports.
Silver price retreated late in the North American session after hitting a daily high of $22.97, though buyers' failure to reclaim the $23.00 exacerbated the grey metal’s fall to current spot prices. Therefore, the XAG/USD exchanges hands at $22.73, down 0.59%.
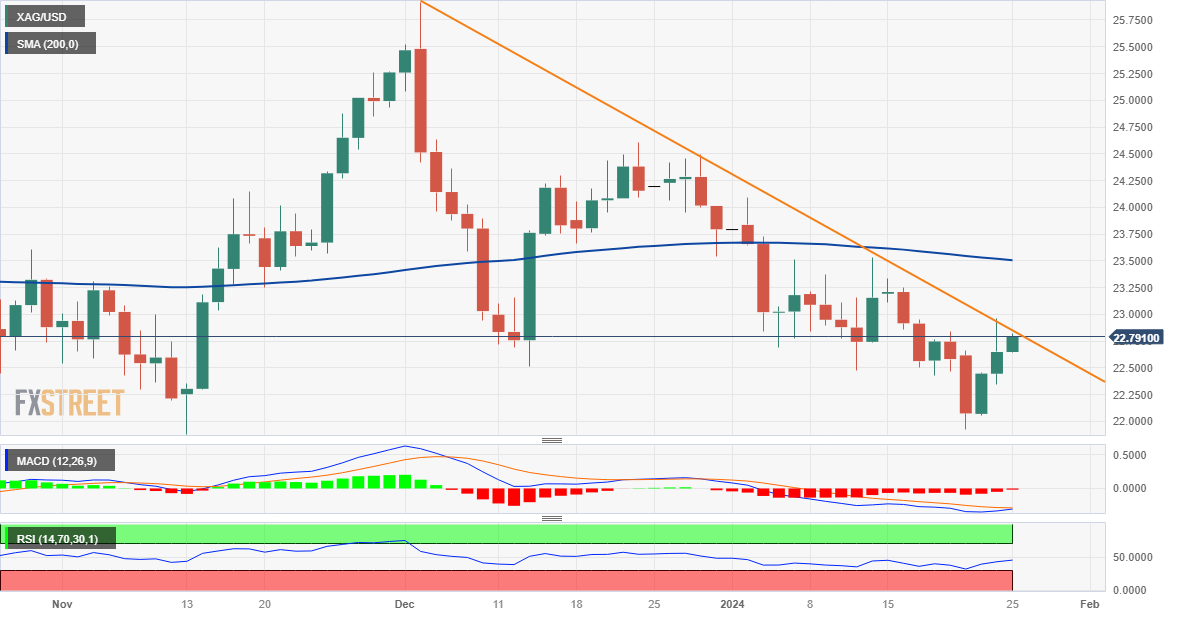
After printing three straight positive days, Silver retraced below $23.00, resuming its ongoing downtrend and forming a ‘bearish after sellers dragged prices below key support levels, like the 200, 50, and 100-day moving averages (DMAs). Even though XAG/USD is edging low, as a ‘bearish harami’ chart pattern emerges, it still needs to surpass (again) December’s 13 swing low of $22.51 to challenge the $22.00 figure. The next demand area below that level would be January’s 55 low at $21.93.
On the flip side, buyers are eyeing the $23.00 handle and the 100-DMA at $23.15 as immediate resistance levels in the near term. Once those levels are cleared, the next resistance emerges at the 200-DMA at $23.48.
XAG/USD Price Action – Daily Chart
XAG/USD Technical Levels
-
26.01.2024 08:23Silver Price Analysis: XAG/USD rally stalls near $23 as focus shifts to US core PCE data
- Silver price faces some pressure while attempting to extend rally above $23.
- The market mood is downbeat as investors await the core PCE price index data for December.
- Strong GDP numbers and stubborn inflation data could allow Fed to maintain a hawkish interest rate stance.
Silver price (XAG/USD) struggles to extend upside above the crucial resistance of $23.00. The white metal turns sideways as investors shift focus towards the United States core Personal Consumption Expenditure (PCE) price index data for December, which will be published at 13:30 GMT.
S&P500 futures have posted significant losses in the European session, portraying a sharp decline in the risk-appetite of the market participants. The US Dollar Index (DXY) aims to recapture almost six-week high of 103.82 as safe-haven demand improves.
The US Q4 Gross Domestic Product (GDP) data, released on Thursday, indicated the economy grew at a robust pace of 3.3%. This has escalated upside risks to price pressures.
Meanwhile, investors await the US core PCE price index data. Investors have anticipated that the annual underlying inflation grew at a slower pace of 3.0% against reading of 3.2% in November. Monthly core PCE data is anticipated to rise by 0.2% after increasing by 0.1%.
A combination of stubborn inflation data and upbeat economic prospects would allow Federal Reserve (Fed) policymakers to stick to their hawkish interest rate stance atleast for the first-half of 2024.
Silver technical analysis
Silver price attempts to deliver a breakout of the Descending Triangle chart pattern formed on a four-hour scale. The downward-sloping trendline of the aforementioned chart pattern is plotted from 3 December 2023 high at $25.92 while the horizontal support is placed from 13 November 2023 low at $21.88. The asset has stabilized above the 20-period Exponential Moving Average (EMA), which trades around $22.73.
The 14-period Relative Strength Index (RSI) aims to stabilize into the 60.00-80.00 range. A bullish momentum would appear if the RSI (14) manages to do so.
Silver four-hour chart
-638418541555630771.png)
-
25.01.2024 11:12Silver Price Analysis: XAG/USD advances to near $23 on China’s dovish stance, US Q4 GDP eyed
- Silver price jumps to near $23, supported by PBoC’s dovish stance.
- The US economy is expected to grew by 2% in the third quarter of 2023.
- Silver price looks set to deliver a breakout of the Inverted H&S pattern.
Silver price climbs to near $23 after the People’s Bank of China (PBoC) announced a liquidity booster to uplift the economy that is struggling to recover post-pandemic. The PBoC is set to infuse liquidity of $140 billions into the banking system to support vulnerable economic growth.
S&P500 futures have generated some gains in the European session, portraying a risk-on mood. 10-year US Treasury yields have dropped to near 4.16%. The US Dollar Index (DXY) falls slightly to near 103.20 as investors shift focus towards the United States Q3 Gross Domestic Product (GDP) data, which will be published at 13:30 GMT.
As per the preliminary consensus, the US economy grew at a slower pace of 2.0% after expanding 4.9% in the third quarter of 2023. A slower growth rate would undermine the argument supporting a restrictive interest rate policy atleast until second quarter ends.
The hopes for an interest rate-cut by the Federal Reserve (Fed) has already eased significantly as the US economy is resilient on the grounds of labor market and consumer spending. • As per the CME Fedwatch tool, chances in favour of an interest rate cut by 25 basis-points (bps) have dropped to 42.4%.
Silver technical analysis
Silver price aims to deliver a breakout of the Inverted Head and Shoulder chart pattern, formed on a two-hour scale. The neckline of the aforementioned chart pattern is plotted from January 17 high at $22.88. The 50-period Exponential Moving Average (EMA) around $22.60 continues to provide support to the Silver price bulls.
The 14-period Relative Strength Index (RSI) has shifted into the bullish range of 60.00-80.00, which indicates that an upside momentum has been triggered.
Silver two-hour chart
-638417779076732334.png)
-
25.01.2024 08:38Silver Price Analysis: XAG/USD bulls flirt with descending trend-line resistance
Silver trades with a positive bias for the third successive day on Thursday.
The technical setup warrants caution before positioning for further gains.
A convincing breakout through $23.00 is needed for bulls to seize control.Silver (XAG/USD) attracts some buyers for the third successive day on Thursday and sticks to its modest intraday gains, near the $22.70-$22.75 region through the first half of the European session. The white metal, however, remains below the weekly top, around the $23.00 round figure touched the previous day.
The aforementioned handle represents a downward-sloping trend-line resistance extending from the December swing high and should act as a key pivotal point. A sustained strength beyond might trigger a short-covering rally and lift the XAG/USD to the $23.25-$23.30 intermediate resistance en route to the very important 200-day Simple Moving Average (SMA), currently around mid-$23.00s.
Some follow-through buying will suggest that the XAG/USD has bottomed out in the near term and pave the way for a move towards reclaiming the $24.00 round figure. The momentum could extend further towards the next relevant resistance near the $24.40-$24.50 area. That said, oscillators on the daily chart are yet to confirm a bullish bias and warrant some caution before positioning for further gains.
On the flip side, the $22.60-$22.55 zone now seems to protect the immediate downside, below which the XAG/USD could slide back to retesting over a two-month low, around the $21.95-$21.90 region touched on Monday. A convincing break below the latter will be seen as a fresh trigger for bearish traders and expose the $21.40-$21.35 support. The subsequent fall could drag the metal to the $21.00 round figure en route to the October monthly swing low, around the $20.70-$20.65 region.
Silver daily chart
Technical levels to watch
-
24.01.2024 08:37Silver Price Analysis: XAG/USD moves back above mid-$22.00s, flirts with weekly top
- Silver attracts some buyers for the second straight day and climbs back closer to the weekly top.
- The technical setup warrants caution before positioning for any meaningful appreciating move.
- A descending trend-line hurdle extending from the December swing high might cap further gains.
Silver (XAG/USD) gains positive traction for the second straight day on Wednesday and recovers further from its lowest level since November 13, around the $21.95-$21.90 area touched earlier this week. The white metal builds on the intraday move-up through the first half of the European session and climbs to the top end of its weekly range, around the $22.60-$22.65 region in the last hour.
From a technical perspective, any subsequent strength beyond the $22.75 zone is more likely to confront stiff resistance near the $23.00 round-figure mark. The said handle now coincides with a downward sloping trend-line extending from the December swing high, which if cleared decisively might trigger a short-covering rally. The XAG/USD might then accelerate the momentum beyond an intermediate hurdle near the $23.25-$23.30 area and aim to retest the very important 200-day Simple Moving Average (SMA), currently around mid-$23.00s.
The latter should act as a key pivotal point and a sustained strength beyond will suggest that the XAG/USD has formed a near-term bottom and pave the way for a further near-term appreciating move. The white metal could then reclaim the $24.00 mark and extend the positive move further towards the next relevant hurdle near the $24.40-$24.50 region. That said, negative oscillators on the daily chart warrant some caution for aggressive bulls.
On the flip side, the daily swing low, around the $22.35 zone, now seems to protect the immediate downside ahead of over a two-month low, around the $21.95-$21.90 region touched on Monday. Some follow-through selling will be seen as a fresh trigger for bearish traders and drag the XAG/USD to the $21.40-$21.35 support. The downward trajectory could extend further towards the $21.00 round figure en route to the October monthly swing low, around the $20.70-$20.65 region.
Silver daily chart
Technical levels to watch
-
23.01.2024 08:43Silver Price Analysis: XAG/USD moves away from over two-month low, not out of the woods yet
- Silver stages a goodish recovery from over a two-month low touched on Monday.
- The setup favours bears and supports prospects for the emergence of fresh selling.
- A sustained strength beyond the $23.00 mark is needed to negate the negative bias.
Silver (XAG/USD) attracts some buyers on Tuesday and for now, seems to have snapped a two-day losing streak to sub-$22.00 levels, or its lowest level since November 13 touched the previous day. The white metal sticks to its intraday gains through the first half of the European session and currently trades around the $22.30-$22.35 region, up over 1% for the day.
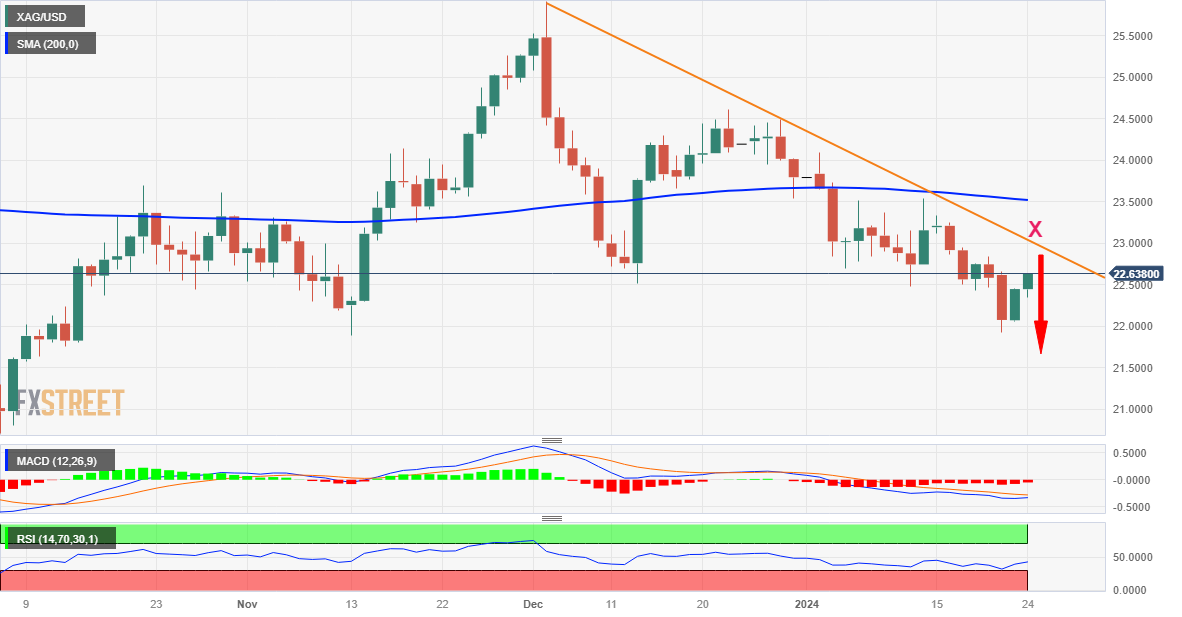
From a technical perspective, the recent repeated failures near the 200-day Simple Moving Average (SMA) resistance, which coincided with a downward sloping trend-line extending from the December swing high, favours bearish traders. Moreover, oscillators on the daily chart are holding deep in the negative territory and are still far from being in the oversold zone. This, in turn, suggests that the path of least resistance for the XAG/USD is to the downside.
Hence, any subsequent move up might still be seen as a selling opportunity and runs the risk of fizzling out rather quickly near the $22.70-$22.75 region. This is followed by the $23.00 round-figure mark, which should now act as a pivotal point. A sustained strength beyond the latter might trigger a short-covering rally and lift the XAG/USD beyond the $23.20-$23.25 intermediate hurdle, towards retesting the 200-day SMA barrier, currently pegged near mid-$23.00s.
Some follow-through buying will suggest that the white metal has formed a near-term bottom and shift the bias in favour of bullish traders. The subsequent move up might then allow the XAG/USD to reclaim the $24.00 round figure and climb further towards the next relevant resistance around the $24.40-$24.50 region.
On the flip side, bearish traders need to wait for acceptance below the $22.00 mark. The XAG/USD might then turn vulnerable to test the $21.40-$21.35 intermediate support before eventually dropping to the $21.00 round figure. The downward trajectory could extend further towards challenging the October monthly swing low, around the $20.70-$20.65 region.
Silver daily chart
Technical levels to watch
-
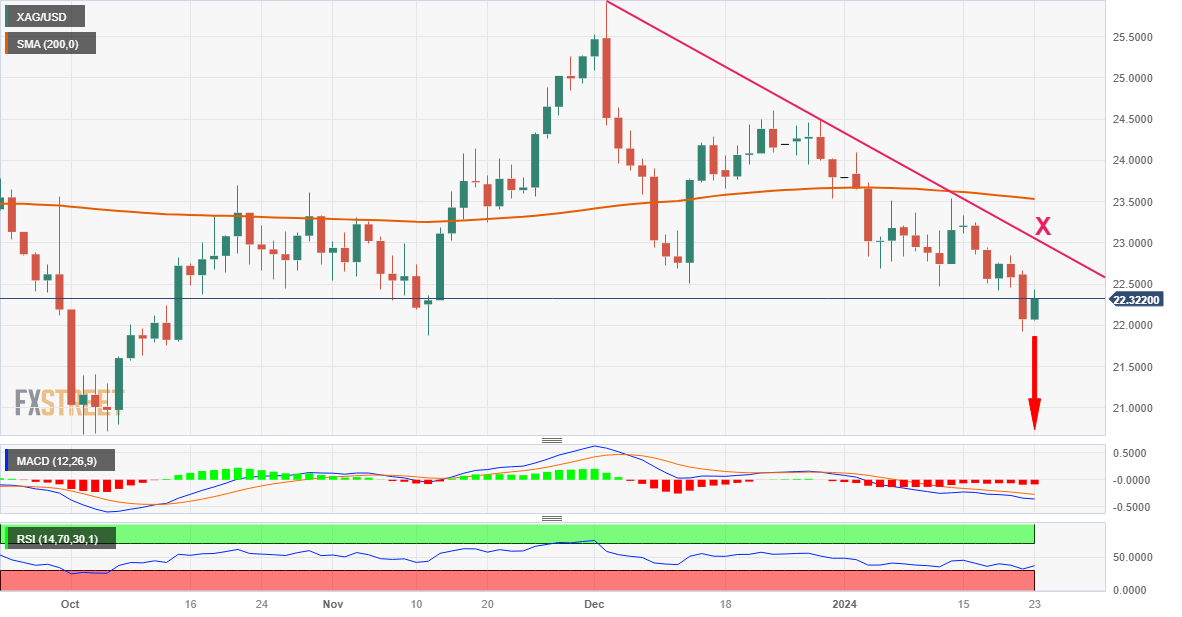
22.01.2024 19:03XAG/USD Price Analysis: Bears advance as markets adjusts dovish bets on the Fed
- The XAG/USD declined to its lowest level since mid-November near $22.20.
- Markets are repricing their bets on the Fed, and the odds of cuts in March decline.
- Despite recovery signals from four-hour chart indicators, the prevailing bearish trend keeps the bulls at bay with the pair positioned under key SMAs.
In Monday's session, the XAG/USD pair is trading at $22.14, showcasing 2% decline, following to multi-month lows. The daily chart paints a largely bearish picture, with selling pressure beginning to assert dominance. The 4-hour technical outlook indicates a recovery from oversold conditions, offering a glimmer of respite in an otherwise downwardly skewed market.
In the meantime, markets are making some adjustments in easing expectations and now, the swaps market is pricing in 125 bp of easing over the course of 2024 vs. nearly 175 bp seen earlier this month while the odds of a cut in March dropped below 50%. However, this seems highly unlikely considering the strength of the US economy. Important upcoming events include key central bank meetings this week and an official Q4 GDP data to be reported on Thursday alongside, Personal Consumption Expenditures (PCE), the Fed’s preferred gauge of inflation, from the last month of 2023. The outcome of this data may shape the expectations from the markets and set the precious metal’s pace for the next sessions.
XAG/USD levels to watch
Analyzing daily chart movements, the technical situation reveals dominance of selling momentum. The Relative Strength Index (RSI) is descending and in a downtrend, signaling an intensification of bearish momentum. Consistent with this, the Moving Average Convergence Divergence (MACD) red bars are on the rise, which also suggests strengthening of bearish momentum. In addition, the pair is trading beneath their 20, 100, and 200-day Simple Moving Averages (SMAs), which confirms that the bears are in control on a broader spectrum, further reinforcing the notion of enhanced bearish momentum.
Moving to the shorter time frame, the four-hour chart suggest thatindicators are correcting oversold conditions, showing some respite for the buyers. Yet, the bearish momentum is too dominant to dismiss. The Relative Strength Index (RSI) continues to descend in the negative territory, lending weight to the bearish bias. In conjection, the Moving Average Convergence Divergence (MACD) reflects rising red bars, yet again indicating increased seller influence.
XAG/USD daily chart
-
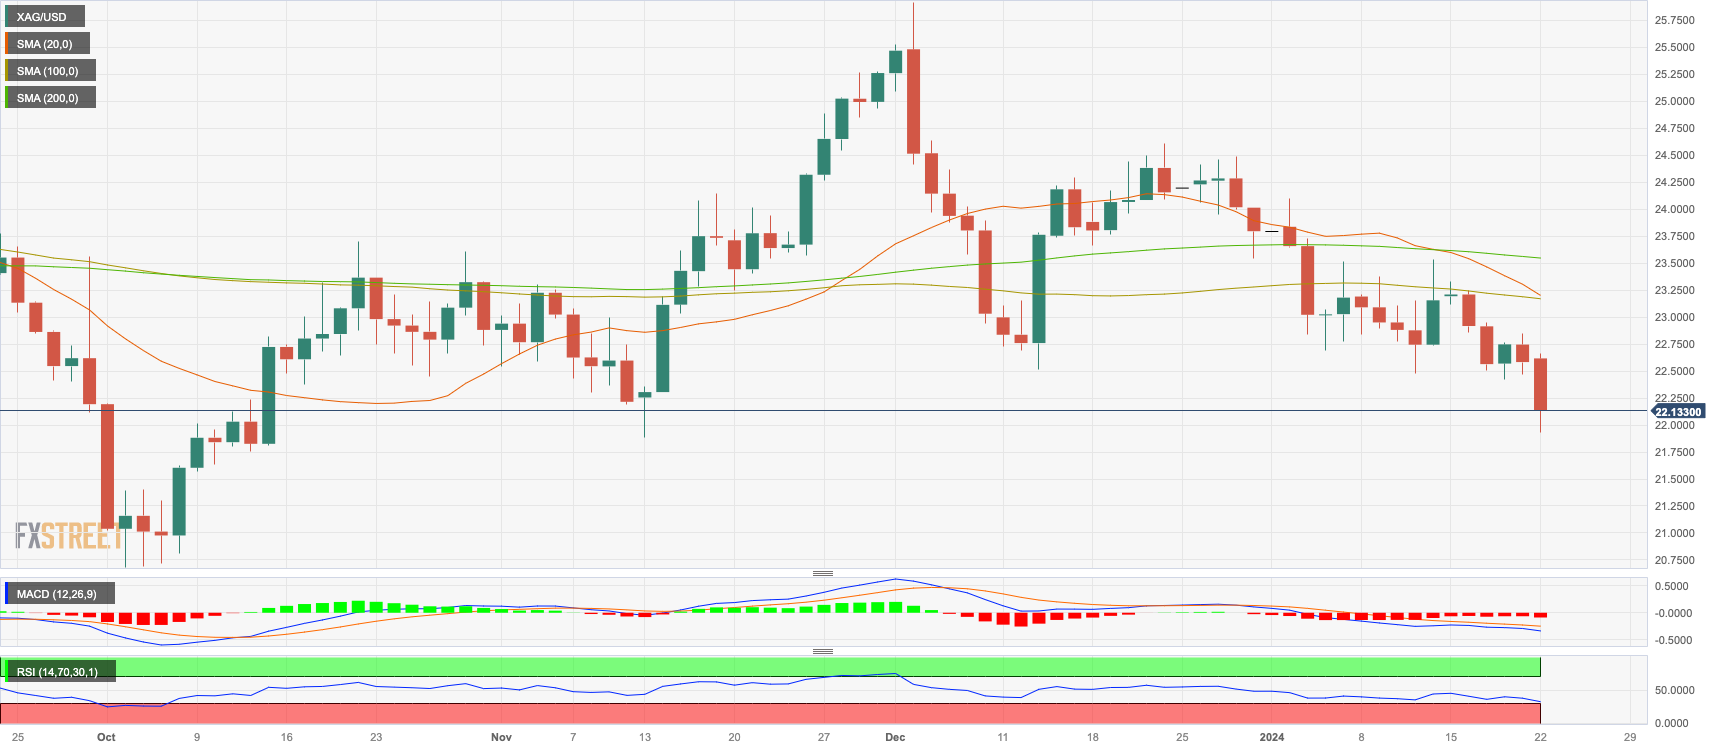
22.01.2024 14:29Silver Price Forecast: XAG/USD plunges to near $22 as Fed rate-cut optimism fades
- Silver price plummets to near $22 as the Fed is expected to reduce interest rates from May.
- The USD Index struggles for a firm-footing despite easing Fed rate-cut bets.
- Silver price declines further towards $21.88.
Silver price (XAG/USD) nosedived to near $22.00 on Monday, more than 2.5% down from its previous close. The white metal is heavily dumped by the market participants as trades dialled back expectations of early rate cuts by the Federal Reserve (Fed).
The S&P500 is expected to open on a positive note, considering positive cues from the overnight futures. The US Dollar Index (DXY) is also facing pressure despite investors have postponed their expectations of rate cut from Fed to May. 10-year US Treasury yields have dropped further to near 4.09%.
The CME Fedwatch tool indicates that investors are now anticipating an interest rate cut in May as price pressures are still stubborn due to robust households’ spending and upbeat labor market conditions.
This week, market participants will focus on the United States Q4 Gross Domestic Product (GDP) data, which will be published on Thursday. An upbeat GDP data would underscore the ‘higher interest rates’ narrative. Fed policymakers have been considering early rate cuts as premature that could dampen all efforts yet don to tame price pressures.
Silver technical analysis
Silver price witnesses an intense sell-off after delivering a breakdown of the horizontal support plotted from December 13 low at $22.51. The asset is expected to find an interim support near November 13 low at $21.88. The 50-period Exponential Moving Average (EMA) near $22.80 continues to act as a barricade for the Silver price bulls.
The 14-period Relative Strength Index (RSI) has shifted into the bearish range of 20.00-40.00, which indicates that a downside momentum has been triggered.
Silver four-hour chart
-638415305122759123.png)


© 2000-2024. All rights reserved.
This site is managed by Teletrade D.J. LLC 2351 LLC 2022 (Euro House, Richmond Hill Road, Kingstown, VC0100, St. Vincent and the Grenadines).
The information on this website is for informational purposes only and does not constitute any investment advice.
The company does not serve or provide services to customers who are residents of the US, Canada, Iran, The Democratic People's Republic of Korea, Yemen and FATF blacklisted countries.
Making transactions on financial markets with marginal financial instruments opens up wide possibilities and allows investors who are willing to take risks to earn high profits, carrying a potentially high risk of losses at the same time. Therefore you should responsibly approach the issue of choosing the appropriate investment strategy, taking the available resources into account, before starting trading.
Use of the information: full or partial use of materials from this website must always be referenced to TeleTrade as the source of information. Use of the materials on the Internet must be accompanied by a hyperlink to teletrade.org. Automatic import of materials and information from this website is prohibited.
Please contact our PR department if you have any questions or need assistance at pr@teletrade.global.
transfers