- Analytics
- News and Tools
- Quotes
- Chart and quotes for USDCAD
CFD Trading Rate US Dollar vs Canadian Dollar (USDCAD)
| Date | Rate | Change |
|---|
Related news
-
12.04.2024 10:45USD/CAD approaches 1.3750 as Fed to delay rate cuts
- USD/CAD jumps to 1.3735 as the Canadian Dollar weakens on dismal market sentiment.
- Investors turn risk-averse as trades priced out Fed rate cut hopes for June.
- BoC Macklen sees expectations for the Fed pivoting to rate cuts in June as reasonable.
The USD/CAD pair is advancing towards 1.3750 in Friday’s London session. The Loonie asset extends its winning spell for the third trading session as investors see the Federal Reserve (Fed) pivoting to rate cuts by the third quarter of this year.
Speculation about the Fed delivering rate cuts has waned as consumer price inflation in the United States turned sticky in March. Also, the core Producer Price Index (PPI) data, which shows an increase or decrease in the prices of goods and services, excluding food and energy prices, by owners at factory gates, remains hotter than expected. The annual core PPI grew by 2.4% from estimates of 2.3% and the prior reading of 2.0%.
For now, investors anticipate that the Fed could begin reducing interest rates after the September meeting. Also, investors expect that there will be two rate cuts instead of three, as projected by Fed policymakers in the latest dot plot.
Faded expectations for the Fed lowering interest rates from the June meeting have dented appeal for risk-sensitive assets. S&P 500 futures have posted some losses in the European session. The US Dollar Index (DXY) extends its upside to 105.85. The scenario of the Fed keeping interest rates higher for a longer period bodes well for the US Dollar.
On the Loonie front, the Canadian dollar has weakened due to firm market expectations that the Bank of Canada (BoC) will start lowering borrowing rates in June. After maintaining the status quo on Wednesday, BoC Governor Tiff Macklem said a rate cut in June is possible.
Going forward, expectations of more upside in global oil prices due to escalating geopolitical tensions could support the Canadian Dollar. Fears of Iran’s confrontation with Israel heightened after air strikes on the Iranian embassy in Damascus by the Israeli forces. Also, Israel is preparing to invade Rafae where displaced Palestinians have sheltered.
It is worth noting that Canada is the leading oil exporter to the United States, and higher oil prices support the Canadian Dollar.
-
12.04.2024 02:42USD/CAD consolidates in a range below 1.3700 mark, bullish potential seems intact
- USD/CAD lacks firm intraday direction and consolidates below the YTD top set on Thursday.
- An uptick in Oil prices underpins the Loonie and caps the upside amid subdued USD demand.
- Reduced Fed rate cut bets favors USD bulls and support prospects for further near-term gains.
The USD/CAD pair oscillates in a narrow trading band during the Asian session on Friday and for now, seems to have stalled the previous day's late pullback from its highest level since November 22. Spot prices currently trade just below the 1.3700 mark, nearly unchanged for the day, though this week's breakout through the 1.3600-1.3610 supply zone favors bulls and supports prospects for a further near-term appreciating move.
Crude Oil prices edge higher amid heightened tensions in the Middle East on the back of a possible Iranian retaliation over a suspected Israeli strike on its embassy in Syria. This, in turn, is seen underpinning the commodity-linked Loonie, which, along with subdued US Dollar (USD) price action, acts as a headwind for the USD/CAD pair. That said, jitters about growing non-OPEC output, led by the US, might cap gains for the black liquid. Apart from this, expectations that the Federal Reserve (Fed) may delay cutting interest rates favor the USD bulls and should limit the downside for the currency pair.
The hotter-than-expected US consumer inflation figures released on Wednesday forced investors to push back their expectations about the timing of the first interest rate cut by the Fed to September from June. Investors also pared their bets for the number of rate cuts of 25 basis points (bps) this year to fewer than two, or roughly 42 bps, from about three or four a few weeks ago. This remains supportive of elevated US Treasury bond yields and assists the USD to stand tall near its highest level since November touched on Thursday, validating the near-term positive outlook for the USD/CAD pair.
Even from a technical perspective, the post-US CPI strength above the 1.3600-1.3610 barrier and the subsequent move up suggests that the path of least resistance for spot prices is to the upside. Market participants now look to the release of the Preliminary Michigan Consumer Sentiment Index, due later during the North American session. Apart from this, speeches by FOMC members will drive the USD demand. This, along with Oil price dynamics, should produce short-term trading opportunities around the USD/CAD pair, which seems poised to register gains for the second straight week.
-
11.04.2024 04:11USD/CAD consolidates its gains above 1.3650, focus on US PPI data
- USD/CAD hovers around 1.3650 in Thursday’s Asian session.
- The BoC held rates at 5% for the sixth consecutive meeting on Wednesday.
- US inflation in March was hotter than expected, and the Fed might delay rate cuts this year.
The USD/CAD pair consolidates its gains above 1.3650 during the Asian trading hours on Thursday. The uptick of the pair is backed by US inflation that came in stronger than expected in March, which boosted the Greenback to a yearly high of 105.30. Investors will take more cues from the US Producer Price Index (PPI), due later on Thursday. The headline and Core PPI figures are estimated to show an increase of 2.2% YoY and 2.3% YoY, respectively.
On Thursday, the Bank of Canada (BoC) held its key interest rate at 5% for the sixth consecutive time since July at its April meeting. The BoC governor Tiff Macklem said during the press conference following the announcement that the recent progress in inflation is encouraging, but he needs to see more evidence to make sure that inflation is sustained before moving on rate cuts. Macklem further stated that an interest rate cut in June is possible.
On the other hand, high inflation in the US grew stronger than expected in March, convincing the Federal Reserve (Fed) to keep its benchmark rates higher for longer. The Labor Department’s Bureau of Labor Statistics reported on Wednesday that the US Consumer Price Index (CPI) gained 0.4% MoM in March, while the yearly CPI figure showed an increase of 3.5% YoY. Furthermore, the Core CPI, excluding volatile food and energy components, rose 0.4% MoM while climbing 3.8% from a year ago.
Following the CPI data, the markets’ chance of a June rate cut dropped to 21%, down from 53% on Tuesday, according to the CME FedWatch tool. The US inflation report in March indicated that the path of easing inflation remains extremely bumpy, and any loosening of monetary policy is likely to be delayed. This, in turn, propels the US Dollar Index (DXY) to yearly highs and provides some support to the USD/CAD pair. -
10.04.2024 15:03USD/CAD pulls back after April Bank of Canada policy decision
- USD/CAD pulls back after the BoC strikes a dovish tone in its policy statement.
- BoC sees signs of inflation easing accompanied by higher growth.
- USD/CAD continues broadly rising within a strict ascending channel.
USD/CAD has pulled back about two tenths of a percentage point on Wednesday, following the Bank of Canada’s (BoC) decision to leave its key overnight interest rate unchanged at 5.0%, in line with analysts’ expectations.
The pair is trading in the 1.3660s at the time of writing, maintaining its overall bullish tone after the US Dollar rallied following the release of hotter-than-expected US Consumer Price Index data for March.
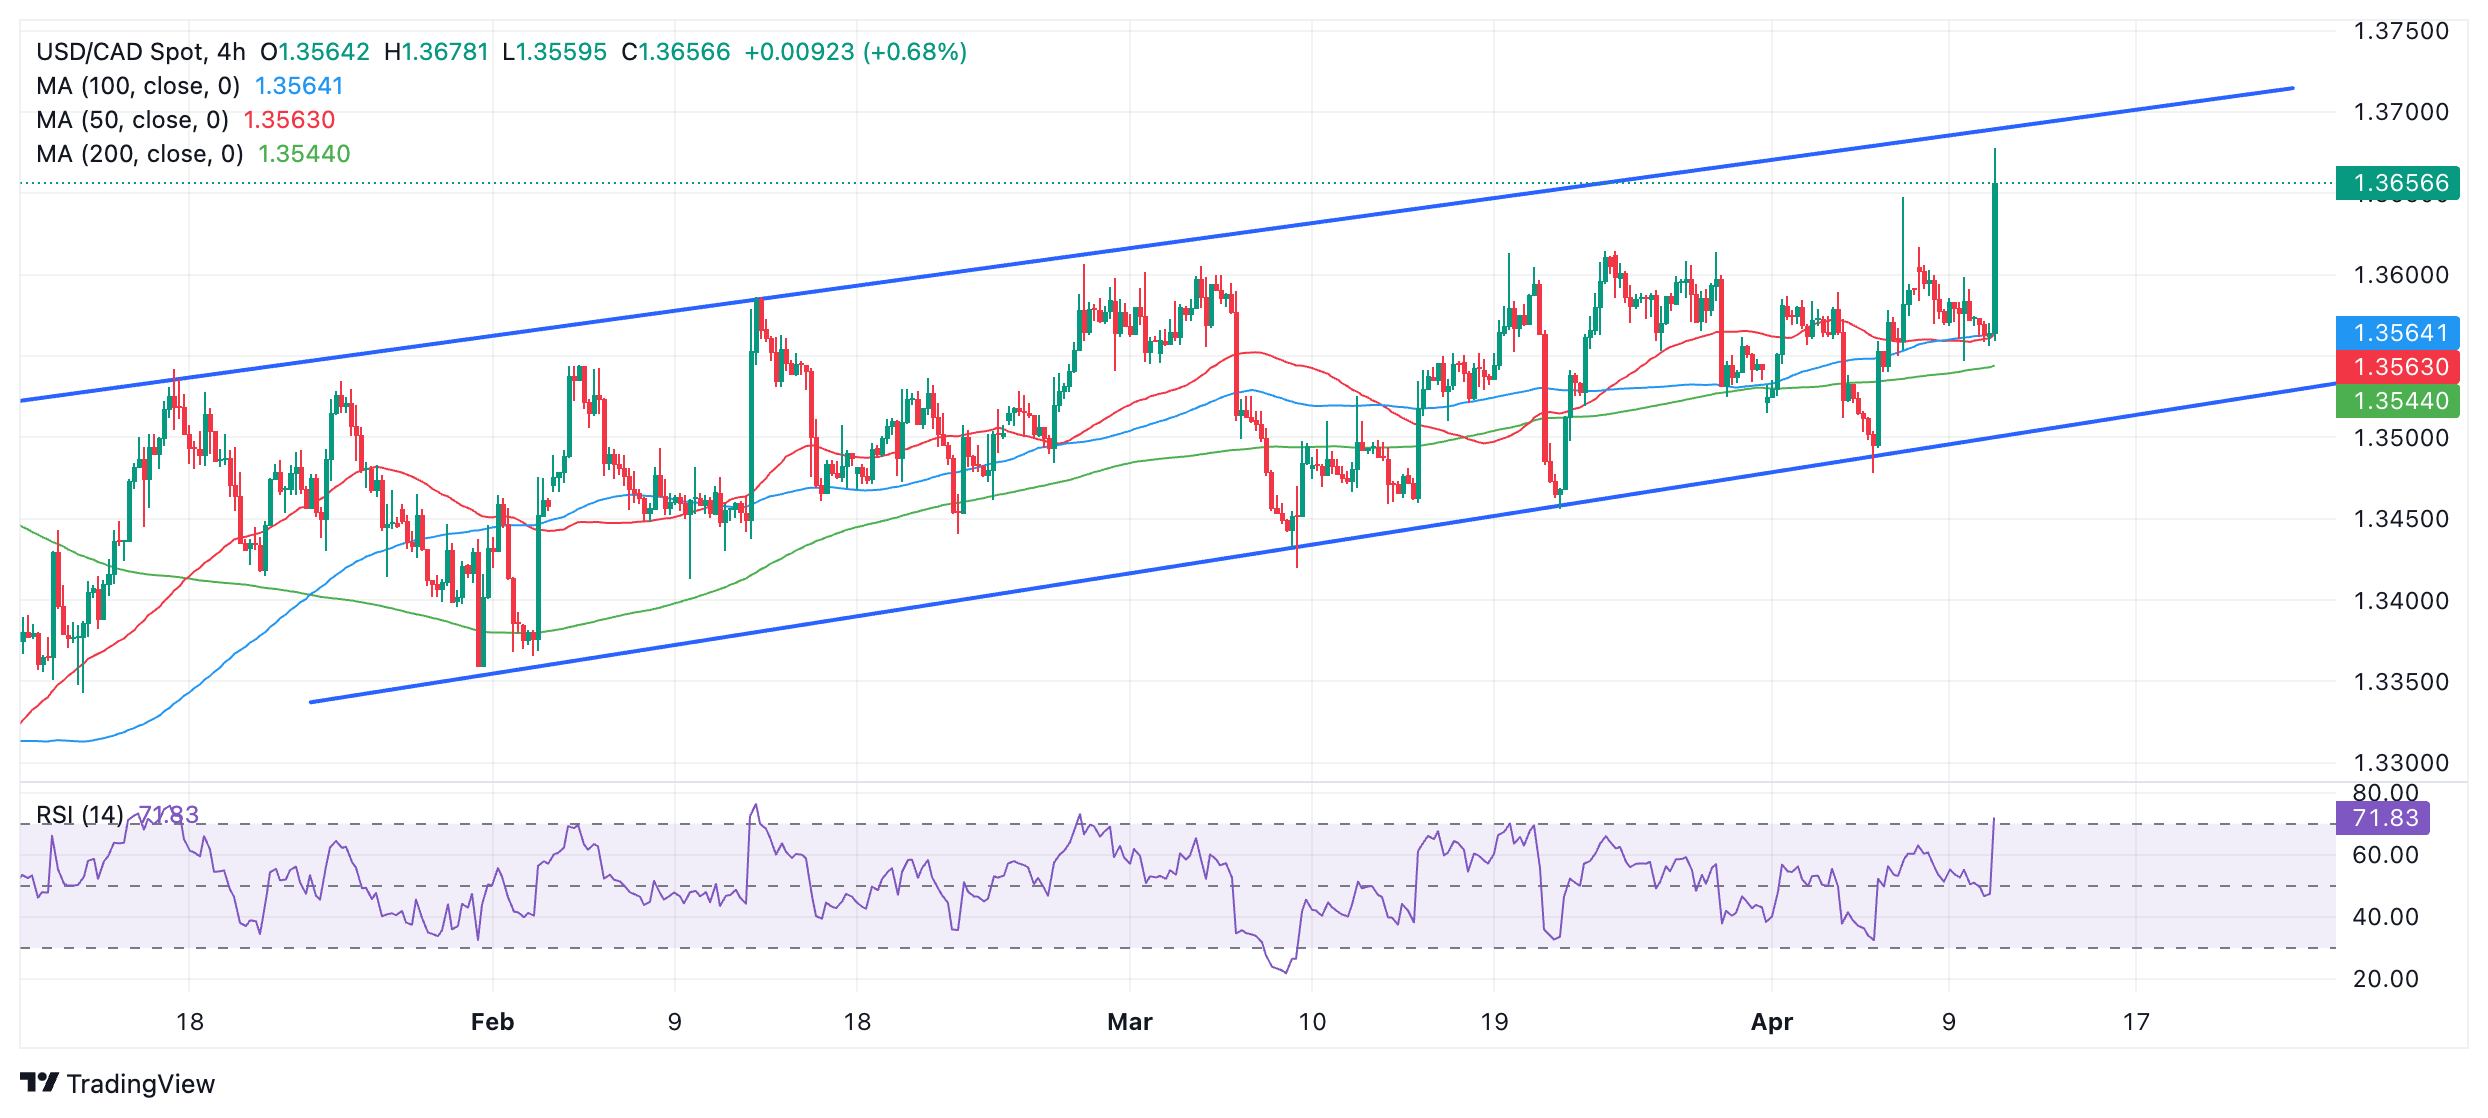
USD/CAD is in a rising channel which is forecast to continue evolving higher in the absence of evidence to the contrary.
USD/CAD 4-hour Chart
Policy Announcement
In the accompanying statement to its meeting, the BoC said that it would continue with quantitative tightening and had noticed signs of inflation easing.
“Governing Council decided to hold the policy rate at 5% and to continue to normalize the Bank’s balance sheet. While inflation is still too high and risks remain, CPI and core inflation have eased further in recent months.
Although core inflation has eased, the BoC said “shelter price inflation is still very elevated, driven by growth in rent and mortgage interest costs.”
According to the statement, the BoC expects inflation to fall to its (2.0%) target in 2025.
“..3-month annualized rates are suggesting downward momentum. The Bank expects CPI inflation to be close to 3% during the first half of this year, to move below 2½% in the second half, and reach the 2% inflation target in 2025,” said the BoC.
The Bank added that “The Council will be looking for evidence that this downward momentum is sustained.”
In particular it would be paying close attention to, “the evolution of core inflation.. the balance between demand and supply in the economy, inflation expectations, wage growth, and corporate pricing behavior,” the statement added.
Higher growth from population increase
The BoC expects higher growth in Canada compared to its January forecasts.
“Overall, the Bank forecasts GDP growth of 1.5% in 2024, 2.2% in 2025, and 1.9% in 2026,” it said in its statement.In the accompanying Policy Report, the BoC stated it had revised up its forecasts for growth and revised down its forecasts for inflation in Canada (as well as the US and the world).
“The outlook for growth in Canada has been revised up, and inflationary pressures have been easing somewhat faster than anticipated in the January Report,” said the BoC in its Monthly Report.
The BoC forecasts real GDP to grow by 2.1% year-over-year in 2024 compared to a prior forecast of 1.6%. It expected much higher growth of 1.0% YoY in Q1 of 2024 compared to 0.2% in the January report.
It forecasts CPI inflation at 2.2% YoY in 2024 compared to the 2.4% forecast in its January report. It still sees inflation at 2.1% in 2025.The BoC said the higher growth was as a result of increased population growth due to immigration.
“Growth in consumption spending is stronger over the near term largely because of higher population growth,” said the report.
In addition, export growth had been boosted by “higher foreign demand” and “new fiscal measures announced in provincial budgets.”
The BoC said it had revised down CPI inflation forecasts by 0.2% in 2024 but left it roughly unchanged in 2025.
Inflation in goods excluding food, communications and energy had all been lower than expected.
-
10.04.2024 05:33USD/CAD clings to mild losses below 1.3570, awaits BoC’s decision, US CPI
- USD/CAD remains silent amid market caution ahead of BoC’s policy decision.
- BoC is expected to maintain its current policy rate at 5.0% on Wednesday.
- The decline in US Treasury yields contributes to undermining the US Dollar.
USD/CAD seems to remain tepid amid firmer US Dollar (USD) and Crude oil prices. The pair inches lower to near 1.3570 during the Asian session on Wednesday. The US Dollar (USD) holds ground despite lower US Treasury yields.
Traders eagerly await the release of the Bank of Canada’s (BoC) interest rate decision, with expectations of remaining unchanged at 5.0%. Additionally, US Consumer Price Index (CPI) data and the FOMC Minutes are scheduled to be released later in the North American session.
Crude oil prices encountered hurdles that potentially weighed on the Canadian Dollar (CAD). The impasse in Gaza ceasefire negotiations revived concerns about the security of supplies from the Middle East, counteracting a larger-than-anticipated increase in US Crude inventories. West Texas Intermediate (WTI) oil price hovers around $84.70 per barrel, by the press time.
The US Dollar (USD) encounters challenges amid lower US Treasury yields. At the time of writing, the US Dollar Index (DXY) consolidates around 104.10, with 2-year and 10-year yields on US Treasury bonds at 4.73% and 4.35%, respectively.
Federal Reserve (Fed) Bank of Minneapolis President Neel Kashkari reiterated the central bank's commitment to combatting inflation. Kashkari stressed the importance of bringing the current inflation rate, hovering around 3%, back down to the target level of 2%.
Investors adopt a cautious stance, expecting potential policy shifts influenced by incoming data. Strong labor market figures from last week could lead to a more hawkish stance from the Federal Reserve if inflation exceeds expectations.
-
09.04.2024 08:39USD/CAD Price Analysis: Likely come out of contraction after US Inflation data, BoC policy decision
- USD/CAD consolidates below 1.3600 as the focus shifts to US Inflation and BoC monetary policy.
- The US inflation data could be made or a break for market expectations of Fed rate cuts in June.
- The BoC is expected to keep interest rates steady at 5%.
The USD/CAD pair struggles for a direction as investors await the United States Consumer Price Index (CPI) data for March, which will be published on Wednesday. The Loonie asset trades sideways below the round-level resistance of 1.3600 in Tuesday’s European session. The US inflation data for March is expected to provide some cues about when the Federal Reserve (Fed) could start reducing interest rates.
US annual headline inflation is forecasted to have increased to 3.4% from 3.2% in February. In the same period, the core inflation that excludes volatile food and energy prices is estimated to have dropped slightly to 3.7% from 3.8%.
Soft inflation figures could prompt speculation that the Fed will reduce borrowing costs after the June meeting, while hot figures might shift rate cut expectations to the second half of this year.
Meanwhile, the Canadian Dollar will dance to the tunes of the Bank of Canada’s (BoC) interest rate decision, to be announced on Wednesday. The BoC is expected to keep interest rates unchanged at 5%. Therefore, investors will focus on the outlook of borrowing rates. The BoC could deliver a dovish guidance as Canada’s labor market is facing stiff consequences of higher interest rates. Also, BoC’s preferred inflation measure, core CPI, came down to 2.1% in February.
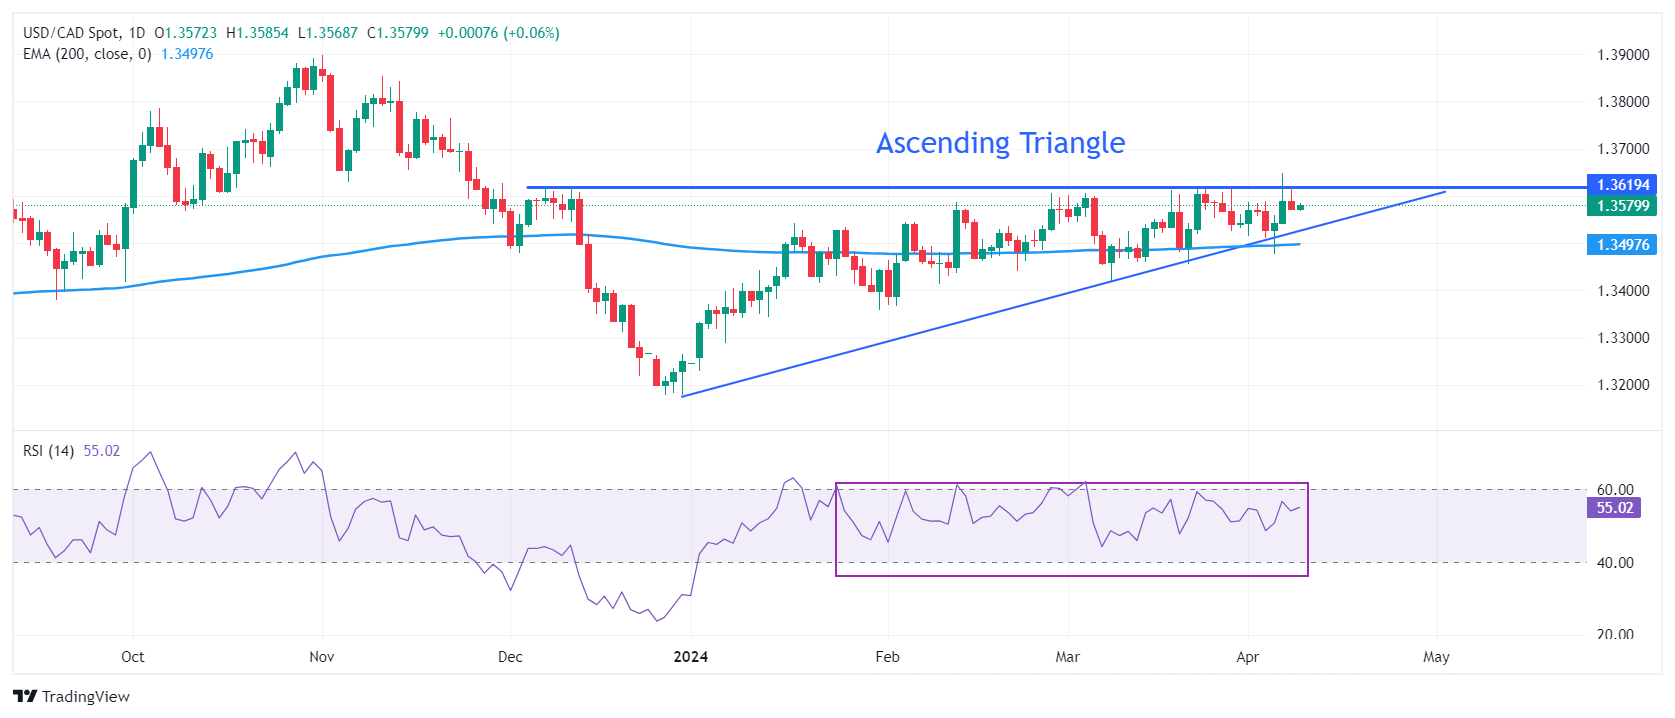
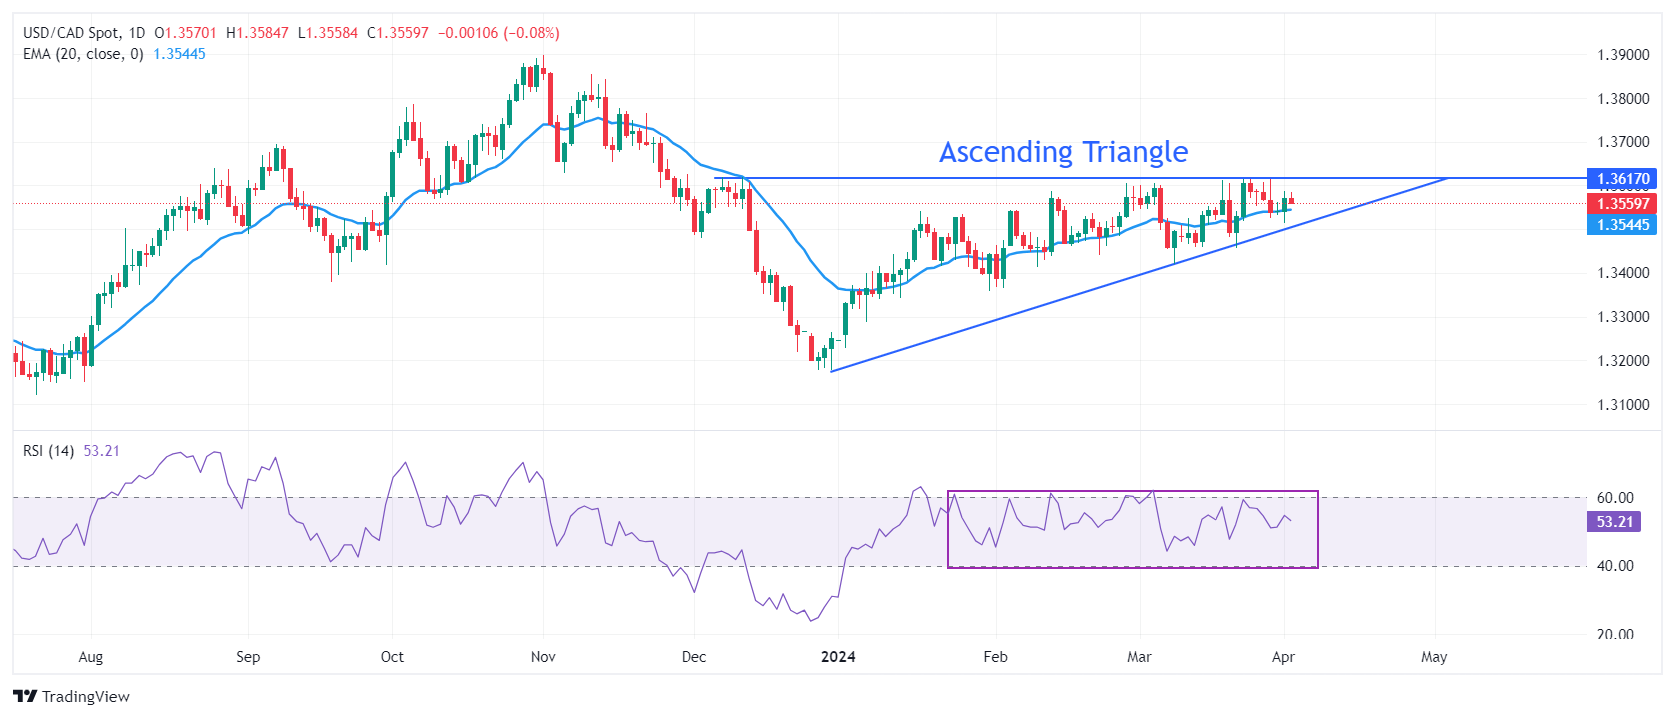
USD/CAD is slightly down from the horizontal resistance of the Ascending triangle formation on a daily timeframe, plotted from December 7 high at 1.3620. The upward-sloping border of the aforementioned pattern is placed from December 27 low at 1.3177. The chart pattern exhibits a sharp volatility contraction and a breakout can happen in any direction.
The 200-day Exponential Moving Average (EMA) near 1.3500 remains a crucial support for the US Dollar bulls.
Meanwhile, the 14-period Relative Strength Index (RSI) oscillates inside the 40.00-60.00 range, indicating indecisiveness among market participants.
The Loonie asset would observe a fresh upside if it breaks above April 5 high at 1.3648. This will drive the asset to the round-level resistance of 1.3700, followed by November 22 high at 1.3765.
On the flip side, a downside move below February 22 low at 1.3441 would expose the asset to February 9 low at 1.3413. A breakdown below the latter would extend downside towards January 15 low at 1.3382.
USD/CAD daily chart
-
09.04.2024 03:58USD/CAD remains below 1.3600 as Middle East tensions continue to underpin Oil prices
- USD/CAD regains some positive traction amid the emergence of some USD dip-buying.
- Reduced Fed rate cut bets push the US bond yields higher and revive the USD demand.
- Geopolitical risks lend support to Oil prices, underpinning the Loonie and capping gains.
The USD/CAD pair attracts some dip-buying during the Asian session on Tuesday and reverses a part of the previous day's losses. Spot prices, for now, seem to have stalled the recent pullback from the vicinity of mid-1.3600s or the YTD high touched last week, though remain below the 1.3600 round figure, warranting caution for bullish traders.
As investors look past the disappointing Canadian employment details released last Friday, the overnight goodish intraday rise in Crude Oil prices is seen underpinning the commodity-linked Loonie and acting as a headwind for the USD/CAD pair. The optimism over a possible ceasefire between Israel and Hamas faded rather quickly as talks remained deadlocked. Adding to this, Iran has threatened military action against Israel over an alleged strike on its embassy in Syria. This raises the risk of supply disruptions from the Middle East and lifts the black liquid closer to a five-month top set last Friday.
The downside for the USD/CAD pair, however, seems cushioned in the wake of the emergence of some buying around the US Dollar (USD), bolstered by elevated US Treasury bond yields. The upbeat monthly US jobs data (NFP) released on Friday, along with the recent hawkish remarks by several Federal Reserve (Fed) officials, suggest that the US central bank may delay cutting interest rates. This, in turn, pushes the yield on the benchmark 10-year US government bond to its highest level since late November, which helps revive the USD demand and might continue to act as a tailwind for the currency pair.
The aforementioned mixed fundamental backdrop, along with the recent repeated failures to find acceptance above the 1.3600 mark, makes it prudent to wait for strong follow-through buying before positioning for any further gains for the USD/CAD pair. Traders might also prefer to move to the sidelines and wait for more cues about the Fed's rate-cut path to determine the next leg of a directional move. Hence, the focus will remain glued to the release of the US consumer inflation figures for March and the FOMC meeting minutes on Wednesday, which will play a key role in influencing the USD price dynamics.
-
08.04.2024 11:12USD/CAD Price Analysis: Retreats to 1.3600 as US Dollar stays on sidelines ahead of US Inflation
- USD/CAD faces pressure above 1.3600 as US Dollar fails to capitalize on strong US NFP.
- Traders have shifted expectations for Fed reducing rates in the second half of this year.
- Weak Canadian Employment boosts early BoC interest rate cuts.
The USD/CAD pair falls back to the round-level support of 1.3600 in Monday’s European session. The Loonie asset drops as the US Dollar fails to catch bid despite traders pare expectations for the Federal Reserve (Fed) to begin reducing interest rates from the June meeting.
Investors do not see the Fed reducing interest rates in June as strong United States labor market conditions have strengthened the inflation outlook. Strong demand for workers is generally offset by hiring them with higher wages, which propels consumer spending. Eventually, higher consumer spending leads to an increase in the consumer price inflation.
Going forward, investors will focus on the Consumer Price Index (CPI) data for March, which will be published on Wednesday. The annual core CPI that strips off volatile food and oil prices is forecasted to have grown at a slightly slower pace of 3.7% from 3.8% in February.
Meanwhile, expectations for early rate cuts by the Bank of Canada (BoC) have deepened due to Canada’ weak labor market data. On Friday, the Statistics Canada showed that labor market witnessed drawdown by 2.2K, while investors forecasted fresh recruitment of 25K jobs. The Unemployment Rate rose strongly to 6.1% from expectations of 5.9% and the prior reading of 5.8%. However, annual Average Hourly Earnings grew at a higher pace of 5.0% from 4.9% in February.
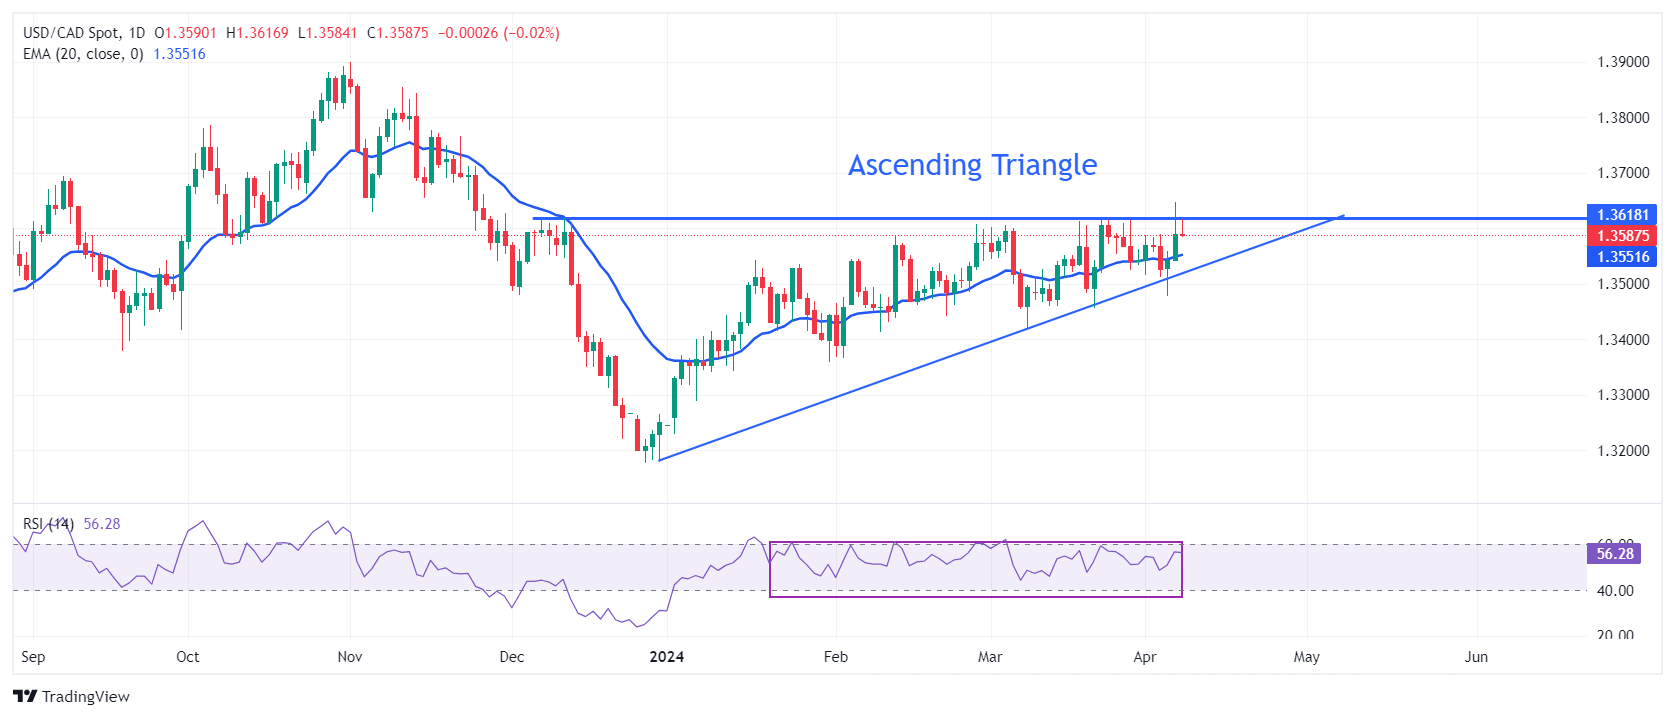
USD/CAD trades close to the horizontal resistance of the Ascending triangle formation on a daily timeframe, plotted from December 7 high at 1.3620. The upward-sloping border of the aforementioned pattern is placed from December 27 low at 1.3177. The chart pattern exhibits a sharp volatility contraction and a breakout can happen in any direction.
The asset remains above the 20-day Exponential Moving Average (EMA) near 1.3520, suggesting that the near-term appeal is bullish.
However, the 14-period Relative Strength Index (RSI) oscillates inside the 40.00-60.00 range, indicating indecisiveness among market participants.
The Loonie asset would observe a fresh upside if it breaks above April 5 high at 1.3648. This will drive the asset to the round-level resistance of 1.3700, followed by November 22 high at 1.3765.
On the flip side, a downside move below February 22 low at 1.3441 would expose the asset to February 9 low at 1.3413. A breakdown below the latter would extend downside towards January 15 low at 1.3382.
USD/CAD daily chart
-
08.04.2024 05:22USD/CAD remains biased higher around 1.3600 after paring gains
- USD/CAD trims intraday gains on risk-on sentiment on Monday.
- The decline in the Crude oil prices undermines the Canadian Dollar.
- The US Dollar strengthened as the likelihood of a Fed rate cut in June diminished.
USD/CAD extends its winning streak, trading higher around 1.3600 for the third consecutive session during the Asian hours on Monday. The US Dollar (USD) strengthens, supported by higher US Treasury yields, thereby exerting upward support to the USD/CAD pair.
Additionally, the decline in Crude oil prices contributes pressure to undermining the Canadian Dollar (CAD), given Canada is one of the largest Crude oil exporters to the United States (US). West Texas Intermediate (WTI) oil price extends losses to near $85.10 per barrel, by the press time.
This comes as Israel withdraws additional troops from Southern Gaza, likely in response to increasing international pressure. Moreover, peace talks between Israel and Hamas have resumed in Egypt, reducing tensions that previously fueled the recent surge in oil prices.
The Canadian Dollar encountered difficulties following the release of weaker domestic employment data on Friday. Investors are now anticipating the Bank of Canada’s (BoC) interest rate decision scheduled for Wednesday, with expectations of remaining unchanged at 5.0%.
The US Dollar Index (DXY) trades higher around 104.30, at the time of writing, propelled by a surprising beat from the Nonfarm Payrolls (NFP) report. The strong labor market performance in March, surpassing expectations, has bolstered the bullish sentiment for the US Dollar.
US Nonfarm Payrolls (NFP) reported a significant increase of 303,000 jobs in March, surpassing expectations of 200,000. However, the previous growth of 275,000 was revised downward to 270,000. According to the CME FedWatch Tool, the probability of a rate cut has decreased to 46.1%. Traders are awaiting the release of US Consumer Price Index data for March scheduled on Wednesday.
-
05.04.2024 14:17USD/CAD refreshes four-month high near 1.3640 on solid US NFP, weak Canadian Employment
- USD/CAD rallies on strong US NFP, weak Canadian labor market data.
- The speculation for Fed to begin rate cuts could be shifted to the second half of this year.
- Canadian labors were fired over March. The jobless rate rose to 6.1%.
The USD/CAD pair prints a fresh four-month high at 1.3640 in Friday’s early American session. The Loonie asset rallies as the United States Bureau of Labor Statistics (BLS) has reported upbeat Nonfarm Payrolls and the Statistics Canada has showed poor Employment data for March.
The US NFP reported that the labor market witnessed 303K fresh payrolls, significantly better than expectations of 200K and the prior reading of 270K. The Unemployment Rate falls to 3.8% from the consensus and the prior reading of 3.9%. Strong labor demand has dented market expectations for the Federal Reserve (Fed) to begin reducing interest rates, which is currently expected from the June meeting.
Robust labor demand is generally followed by strong wage growth as employers are forced to offer higher pay due to shortage of workers. Higher wage growth boosts consumer spending, which keeps inflation stubbornly higher.
On Thursday, Minneapolis Fed Bank President Neel Kashkari said rate cuts won’t be required this year if inflation remains stall. Neel Kashkari forecasted two rate cuts by 2024 in the latest Fed’s dot plot.
Upbeat labor demand has boosted the US Dollar’s appeal. The US Dollar Index (DXY), which tracks the US Dollar’s value against six major currencies, extends its upside to 104.65.
Meanwhile, the Canadian Dollar weakens as workers were laid-off over month. Canada’s labor market witnessed drawdown of 2.2K workers, which investors forecasted fresh recruitment of 25K jobs. The Unemployment Rate rose strongly to 6.1% from expectations of 5.9% and the prior reading of 5.8%. However, annual Average Hourly Earnings grew at a higher pace of 5.0% from 4.9% in February.
Weak labor demand will boost expectations for the Bank of Canada (BoC) pivoting to rate cuts sooner.
-
05.04.2024 08:18USD/CAD Price Analysis: Advances to near 1.3560 followed by weekly high
- USD/CAD may find an immediate resistance area around the weekly high of 1.3588 and psychological level of 1.3600.
- A break above March’s high of 1.3614 could lead the pair to meet the major barrier of 1.3650.
- The immediate support appears at 1.3550, followed by the 50-day EMA at 1.3522.
USD/CAD extends its gains for the second consecutive session, trading higher around 1.3560 during the European session on Friday. The immediate barrier appears at a weekly high of 1.3588, followed by the psychological resistance at 1.3600 level.
A breakthrough above the psychological mark could prompt the USD/CAD pair to test March’s high of 1.3614 to approach the major barrier at the 1.3650 level.
The 14-day Relative Strength Index (RSI) is positioned above 50, suggesting bullish momentum. However, the Moving Average Convergence Divergence (MACD) suggests a tepid momentum.
The MACD line is above the centerline, indicating bullish momentum, but there is divergence below the signal line. Traders may await confirmation from the MACD, a lagging indicator, to determine the direction of the trend.
On the downside, the USD/CAD pair could find immediate support at 1.3550, followed by the 50-day Exponential Moving Average (EMA) at 1.3522 and the 23.6% Fibonacci retracement level of 1.3511.
A break below the latter could exert downward pressure on the USD/CAD pair to surpass the psychological level of 1.3500 to retest the weekly low at 1.3477 level.
USD/CAD: Daily Chart
-
05.04.2024 05:37USD/CAD gains traction above 1.3560, focus on US and Canadian labour market data
- USD/CAD trades in positive territory for the second consecutive day around 1.3565 in Friday’s early European session.
- Fed’s Barkin noted disinflation is likely to continue, but the pace of that remains unclear.
- Canada’s trade surplus widened to $1.39 billion in February from $0.61 billion in January, better than estimated.
The USD/CAD pair gains traction near 1.3565 during the early European session on Friday. The rebound of the pair is bolstered by renewed US Dollar (USD) demand as the rising geopolitical tensions in the Middle East boost safe-haven flows.
On Thursday, the Federal Reserve (Fed) Bank of Richmond President Thomas Barkin said disinflation is likely to continue, but the speed of that remains unclear. Barkin added that maintaining rates 'somewhat restrictive' will bring inflation back to target. Fed Chair Jerome Powell indicated that FOMC officials see it's appropriate to begin lowering policy rates if the economy develops as expected.
The US labor market data for March will be due on Friday, which is likely to offer fresh insights into the Fed's outlook on interest rates. The highly-anticipated Nonfarm Payrolls (NFP) is estimated to show that the US economy added 200,000 jobs in March from a 275,000 increase in February. The Unemployment Rate is projected to remain steady at 3.9% in the same period. In the event that the US NFP data shows a strong-than-expected outcome, this could dampen June Fed rate cut expectations, providing some support to the Greenback and acting as a tailwind for the USD/CAD pair.
On the Loonie front, Canada’s trade surplus increased to $1.39 billion in February from $0.61 billion in January, beating the estimation. This, in turn, lifts the Canadian Dollar (CAD). Additionally, the rise in oil prices due to the escalating tensions in the Middle East provides some support for the commodity-linked Loonie and might cap the upside of the USD/CAD pair. Market players will take more cues from the Canadian labour market data later in the day. -
04.04.2024 00:55USD/CAD remains under selling pressure below 1.3530 amid weaker US Dollar, higher oil prices
- USD/CAD drifts lower to 1.3520 on the softer US Dollar on Thursday.
- The US March ISM Services PMI came in weaker than expected, easing to 51.4 from 52.6 in February.
- Higher crude oil prices amid the fear of oil supply disruptions lift the commodity-linked Loonie.
The USD/CAD pair trades on a softer note near 1.3520 on Thursday during the early Asian trading hours. The rise of crude oil prices to their highest levels since October boost the commodity-linked Loonie. Additionally, the weaker-than-expected US ISM Services PMI data for March weighs on the Greenback and drags the USD/CAD pair lower.
The Institute for Supply Management (ISM) showed on Wednesday that the US Services Purchasing Managers Index (PMI) for March dropped to 51.4 from 52.6 in February. This figure came in worse than the market expectation of 52.7. The US Dollar (USD) attracts some sellers following the downbeat figure. Meanwhile, Automatic Data Processing (ADP) reported that private sector employment in the US rose by 184,000 in March from the 155,000 increase (revised from 140,000) in February, above the market consensus of 148,000.
Federal Reserve (Fed) Governor Adriana Kugler said on Wednesday that she believes inflation will slow gradually this year and pave the way for the Fed to cut interest rates. Furthermore, Fed Chair Jerome Powell reiterated that the policy rate is likely at its peak in the current cycle. Powell further stated that the FOMC policymakers see it as appropriate to begin cutting the policy rate, If the economy evolves as the Fed expects. These dovish comments exert further selling pressure on the USD and create a headwind for the USD/CAD pair.
On the Loonie front, the geopolitical tensions in the Middle East raise the fear of oil supply disruptions and boost the Canadian Dollar (CAD). It’s worth noting that crude oil is one of the top five commodities exported from Canada and higher oil prices can positively affect Canada's economic performance and strengthen the CAD,
Looking ahead, market players will keep an eye on the US February Goods Trade Balance and weekly Initial Jobless Claims. Also, the Fed’s Barkin, Goolsbee, Kashkari, and Mester are set to speak on Thursday.
-
03.04.2024 13:53USD/CAD Price Analysis: Channeling higher
- USD/CAD is steadily channeling higher on US Dollar strength.
- Underneath price lie the three most important Moving Averages providing a safety net.
- Price is marginally biased to continue rising within the bullish channel.
USD/CAD is broadly channeling higher on the daily chart as the US Dollar (USD) steadily appreciates against the Canadian Dollar (CAD).
The range stretches from around the 1.3600s to the 1.3400s at the moment, although it is incrementally slanting higher.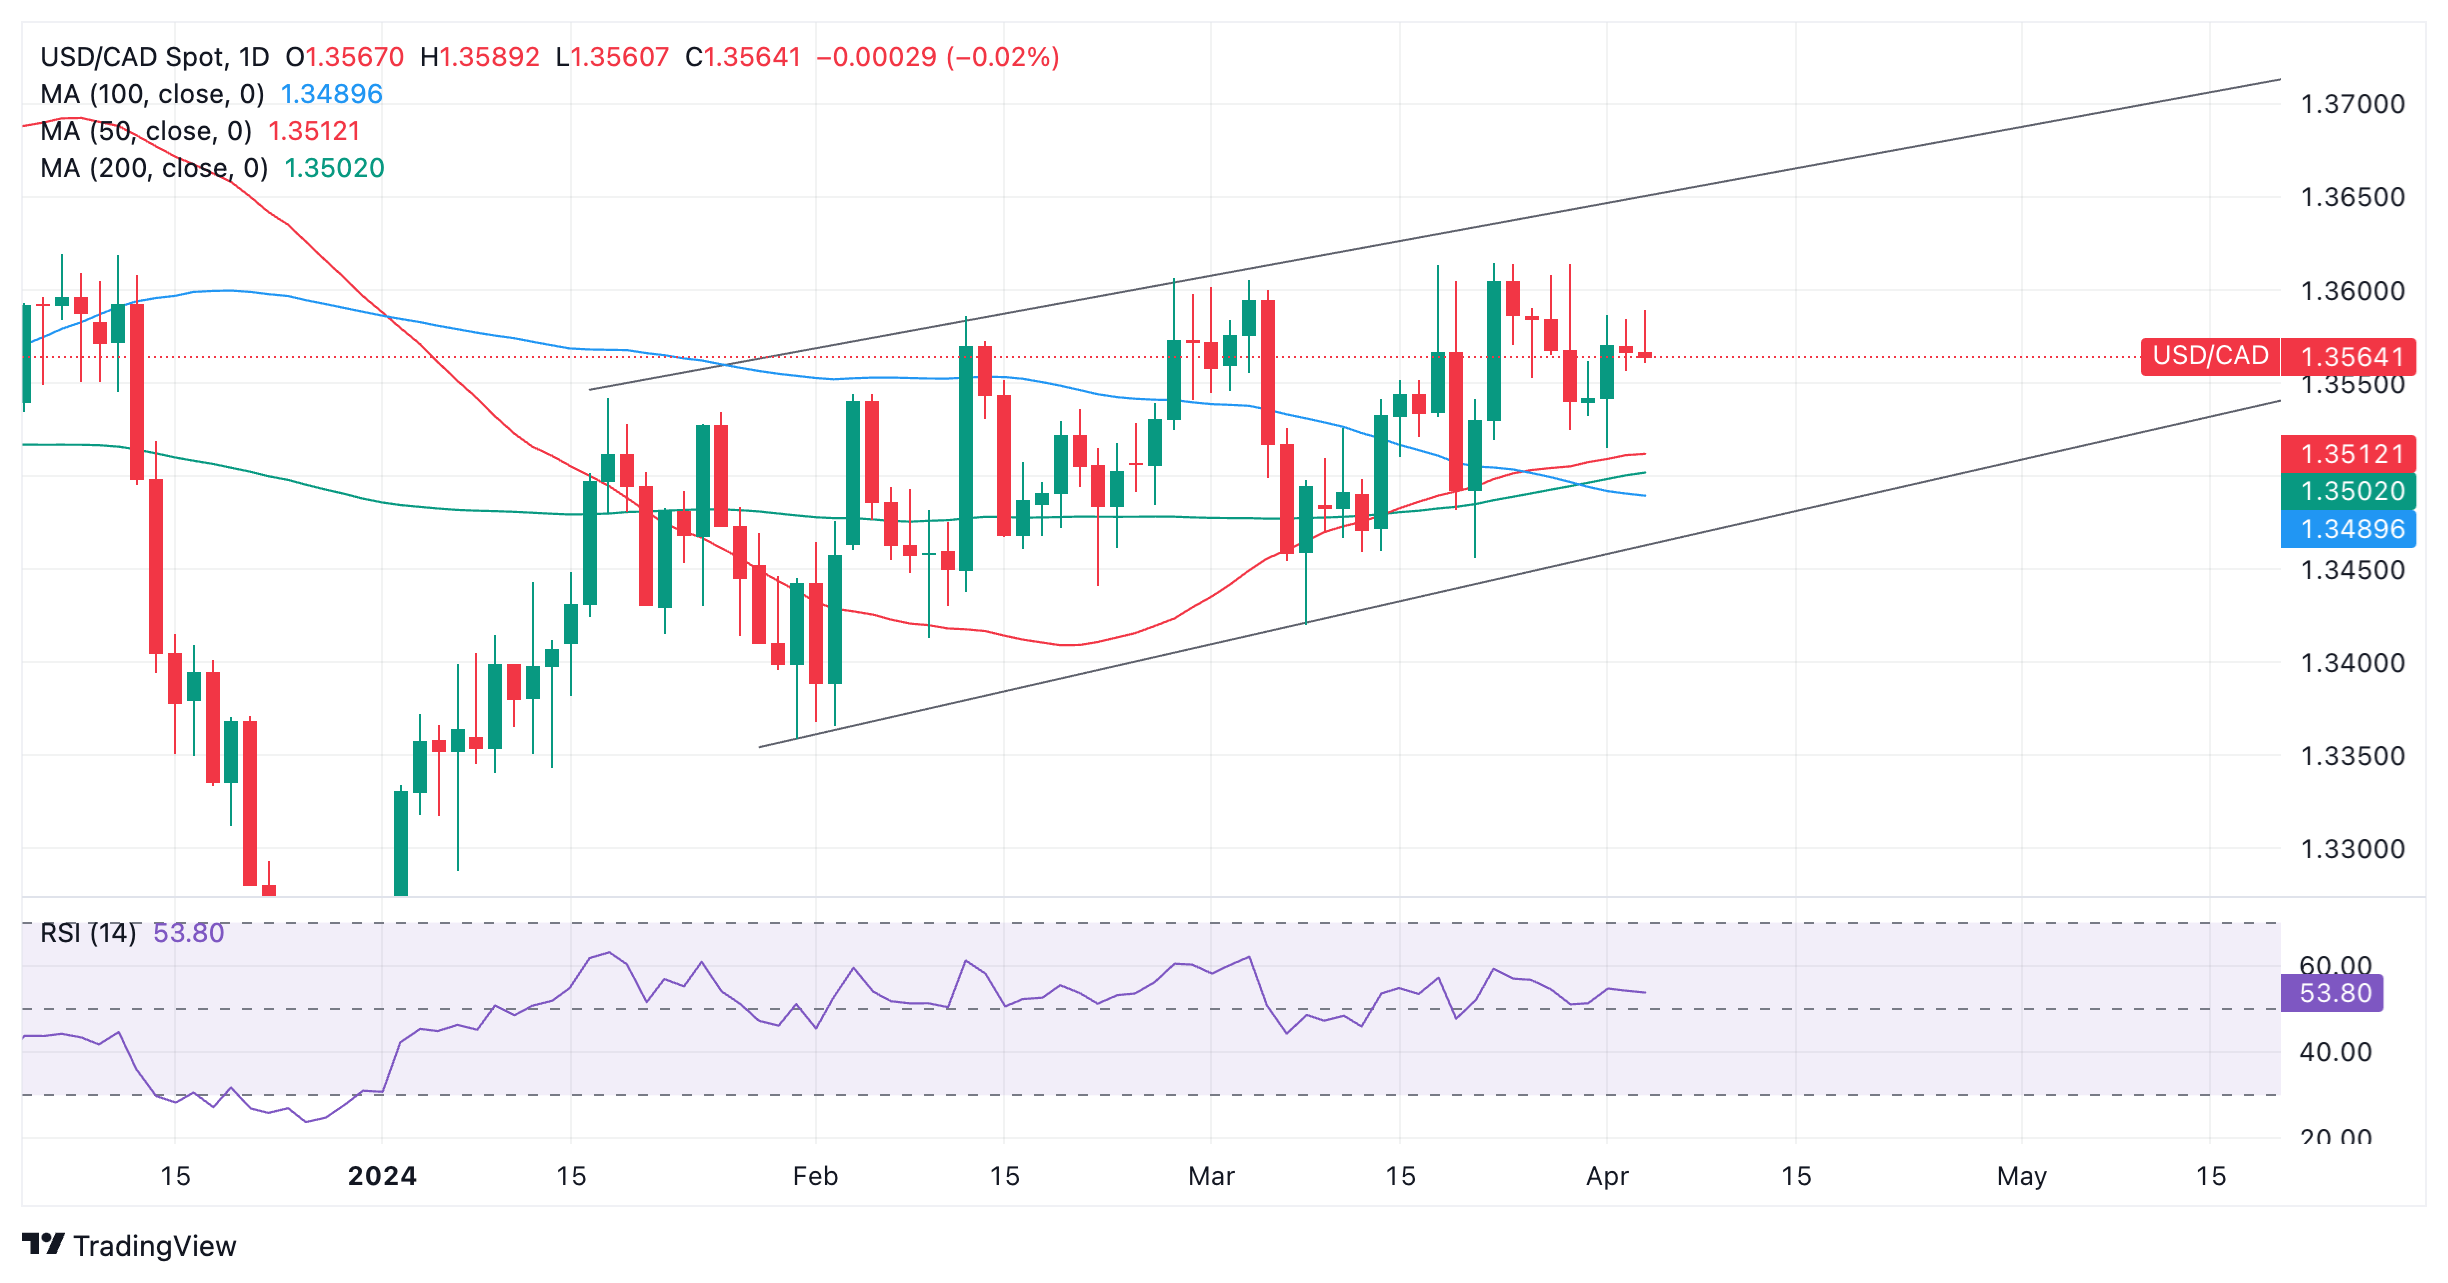
US Dollar versus Canadian Dollar: Daily chart
USD/CAD is currently trading plum in the middle of the channel as it seesaws between tepid gains and losses.
Given the bullish slant to the channel there is a slight but not significant bias for more upside and the pair could rise to the top of the channel at roughly 1.3675.
Clustering just beneath price action around the 1.3500 level are the three most important Moving Averages – the 50, 100 and 200-day (Simple Moving Averages). These are key because they are not only followed by private investors but also institutional players.
Additionally, on the chart of USD/CAD it is notable how price action has respected the support cushion provided by these SMAs on several occasions during the formation of the channel.A move down from the current level in the mid 1.3500s will find support at the first SMA, the 50-day, at 1.3512, and probably bounce. Even if it penetrates below it is likely to find support from the 200-day SMA at 1.3502.
If it gets through all three SMAs the bottom of the channel comes in with further support at roughly 1.3470.
-
03.04.2024 03:53USD/CAD hovers around 1.3560 with a negative bias amid higher Crude prices
- USD/CAD could lose ground on stronger Crude prices on Wednesday.
- WTI price gains support due to concerns over a shortage of supply.
- US Dollar faces challenges after Fed officials made dovish comments.
USD/CAD seems to move in the negative direction for the second consecutive session, edging lower to near 1.3560 during the Asian session on Wednesday. The strength of the Crude oil prices contributes support for the Canadian Dollar (CAD), consequently, undermining the USD/CAD pair.
Western Texas Intermediate (WTI) oil price hovers around $84.80, near Wednesday's highest since October 2023. The increase in WTI price is supported by the weakening US Dollar and concerns over supply due to geopolitical uncertainties.
Moreover, the weaker US Dollar Index (DXY) applies downward pressure on the USD/CAD pair. DXY faces challenges after Federal Reserve (Fed) officials made dovish comments. Cleveland Fed President Loretta Mester expressed expectations of rate cuts later this year, while San Francisco Fed President Mary Daly deemed three rate cuts in 2024 "reasonable," pending further convincing evidence.
On Tuesday, US February JOLTS Job Openings rose to 8.756 million from the previous figure of 8.748 million, surpassing market expectations. Additionally, Factory Orders increased by 1.4% month-on-month in February from a 3.8% decline in the prior reading.
Market participants are anticipated to closely monitor Canadian Import and Export data on Thursday, along with labor data scheduled for release on Friday. In the United States (US), attention will be on the ADP Employment Change and ISM Services PMI data on Wednesday. Additionally, Federal Reserve Chairman Jerome Powell is set to deliver a speech on the US economic outlook at the Stanford Business, Government, and Society Forum in Stanford.
-
02.04.2024 08:38USD/CAD Price Analysis: Consolidates around 1.3580 ahead of US job data
- USD/CAD trades lacklustre around 1.3580 as the focus shifts to US JOLTS Job Openings data.
- Traders pare Fed rate cut bets for June on strong US Manufacturing PMI.
- USD/CAD is on the verge of breaking out of the ascending triangle pattern.
The USD/CAD pair trades sideways around 1.3580 in Tuesday’s European session. The Loonie asset struggles to extend recovery above 1.3580 as investors look for fresh United States labor data to get cues about when the Federal Reserve (Fed) will start reducing interest rates.
This week, investors will focus on the US Nonfarm Payrolls (NFP) report for March, which will be published on Friday. In today’s session, investors will focus on the JOLTS Job Openings for February. US employers are anticipated to have posted fresh 8.74 million job openings, lower than 8.863 million in January.
Meanwhile, the market sentiment is risk-off as strong United States Manufacturing PMI for March forced traders to unwind their bets for the Fed to begin the rate-cut cycle from June. The US Institute of Supply Management (ISM) reported the Manufacturing PMI above the 50.0 threshold at 50.3 after shrinking for 16 months in a row.
S&P 500 futures have posted some losses in the European session. The US Dollar Index (DXY) trades close to four-month high slightly above 105.00.
The next move in the Canadian Dollar will be guided by the labor market data for March, which will be published on Friday. Canadian employers are expected to have recruited 25K job seekers.
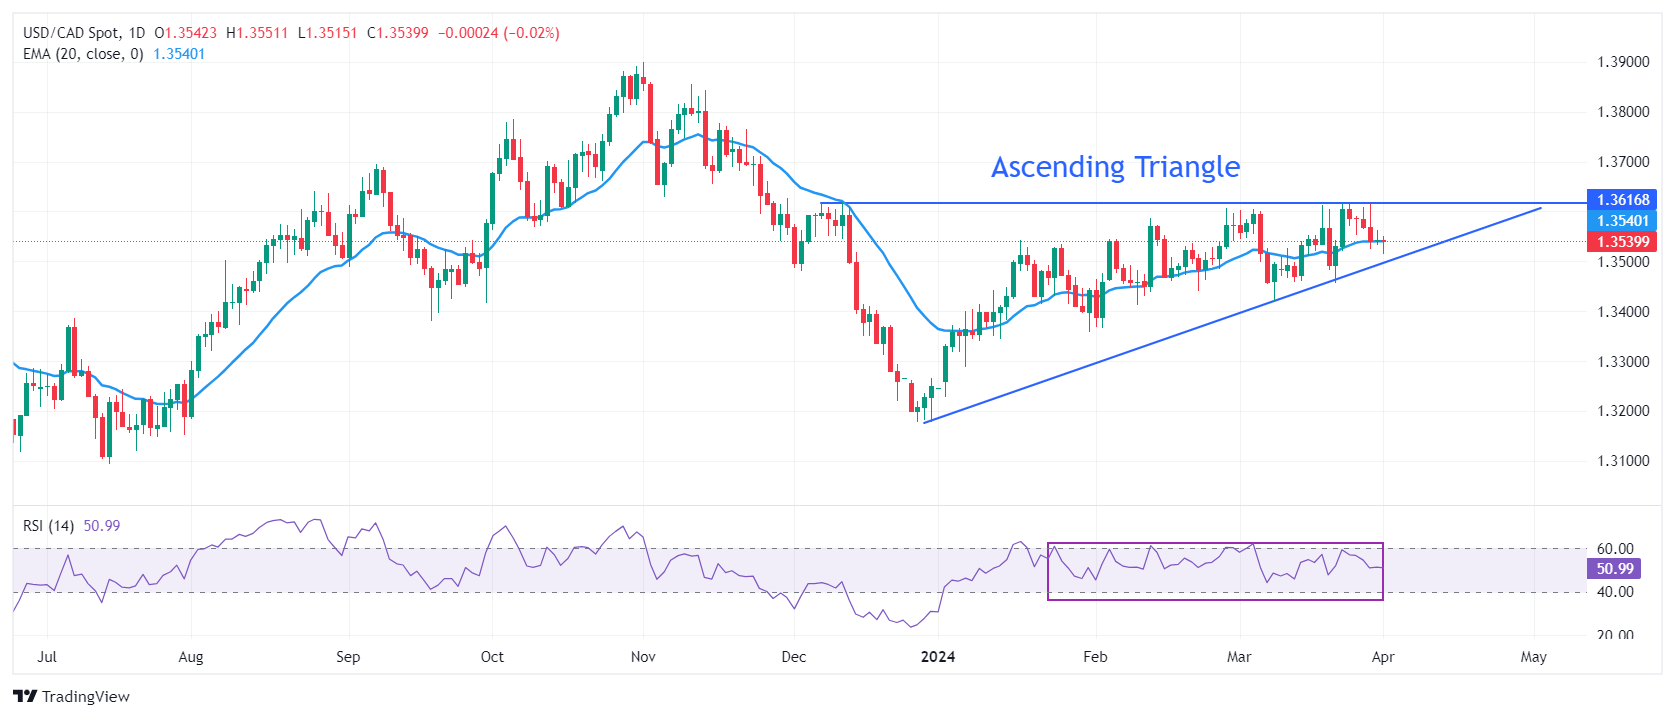
USD/CAD is inch from breaking out of the Ascending Triangle pattern formed on a daily time. A breakout of a Triangle pattern could happen in either direction. The chart pattern exhibits a sharp volatility contraction. The upward-sloping border of the aforementioned pattern is placed from December 27 low at 1.3177 while horizontal resistance is plotted from December 7 high at 1.3620
The 20-day Exponential Moving Average (EMA) near 1.3520 remains sticky to spot prices, indicating a sideways trend.
The 14-period Relative Strength Index (RSI) oscillates inside the 40.00-60.00 range, indicating indecisiveness among market participants.
The Loonie asset would observe a fresh upside if it breaks above December 7 high at 1.3620. This will drive the asset towards May 26 high at 1.3655, followed by the round-level resistance of 1.3700.
On the flip side, a downside move below February 22 low at 1.3441 would expose the asset to February 9 low at 1.3413. A breakdown below the latter would extend downside towards January 15 low at 1.3382.
USD/CAD daily chart
-
02.04.2024 04:29USD/CAD trades with positive bias amid stronger USD, bullish Oil prices to cap gains
- USD/CAD gains positive traction for the second straight day, albeit lacks follow-through.
- Reduced bets for a June Fed rate cut lift the USD to a multi-week top and lend support.
- Bullish Crude Oil prices seem to underpin the Loonie and act as a headwind for the pair.
The USD/CAD pair attracts some buyers for the second straight day on Tuesday and looks to build on the overnight bounce from the 1.3515 region, or over a one-week low. Spot prices currently trade around the 1.3580 area and remain supported by some follow-through US Dollar (USD) buying, though bullish Crude Oil prices might cap any further gains.
The USD Index (DXY), which tracks the Greenback against a basket of currencies, has advanced to its highest level since February 14 in the wake of doubts over whether the Federal Reserve (Fed) will cut interest rates three times this year. Investors trimmed their bets for a June Fed rate cut following the release of the upbeat US data, which showed that the manufacturing sector registered growth in March for the first time since September 2022. This remains supportive of elevated US Treasury bond yields, which, in turn, act as a tailwind for the buck and the USD/CAD pair.
Apart from this, the risk-off impulse turns out to be another factor benefitting the safe-haven Greenback. Meanwhile, Crude Oil prices stand tall near a five-month high touched on Monday amid signs of improved demand and the risk of a further escalation of tensions in the Middle East. This is seen underpinning the commodity-linked Loonie, which, in turn, might hold back traders from placing fresh bullish bets around the USD/CAD pair. Even from a technical perspective, the recent repeated failures to find acceptance above the 1.3600 mark warrant some caution.
Market participants now look forward to the US economic docket – featuring the release of JOLTS Job Openings and Factory Orders later during the early North American session. This, along with speeches by influential FOMC members, the US bond yields and the broader risk sentiment, should rive the USD demand and provide some impetus to the USD/CAD pair. Traders will further take cues from Oil price dynamics to grab short-term opportunities.
-
01.04.2024 10:57USD/CAD Price Analysis: Finds support near 1.3500 as Oil price edge down
- USD/CAD finds cushion near 1.3500 as Oil prices drop on tighter supply concerns.
- The US Dollar moves higher while risk-sensitive currencies edge down amid uncertainty ahead of US data.
- The Loonie is expected to blow out of the ascending Triangle formation.
The USD/CAD pair discovers a temporary support near the psychological support of 1.3500 in the European session on Monday. The Loonie asset finds cushion as the Oil prices edge down after a three-day rally.
The appeal for the Oil prices remains buoyant on tighter supply concerns. OPEC pledges to extend production cuts by the June end. Also, Ukraine’s drone attacks on some Russian refineries have deepened supply concerns. It is worth noting that Canada is the leading exporter of oil to the United States and higher Oil prices strengthen the Canadian Dollar.
Meanwhile, the US Dollar rises slightly to 104.58 amid caution ahead of the United States Nonfarm Payrolls (NFP) and related labor market data this week. The market is experiencing asset-specific action as risk-perceived currencies are down while US equity futures have posted significant gains.
In today’s session, investors will focus on the United States ISM Manufacturing PMI data for March, which will be published at 14:00 GMT. The factory data is estimated to increase to 48.4 from 47.8 in February.
USD/CAD seems close to exploding the Ascending Triangle pattern formed on a daily time. The chart pattern exhibits a sharp volatility contraction. The upward-sloping border of the aforementioned pattern is placed from December 27 low at 1.3177 while horizontal resistance is plotted from December 7 high at 1.3620
The 20-day Exponential Moving Average (EMA) near 1.3520 remains stick to spot prices, indicating a consolidation ahead.
The 14-period Relative Strength Index (RSI) oscillates inside the 40.00-60.00 range, indicating indecisiveness among investors.
The Loonie asset would observe a fresh upside if it breaks above December 7 high at 1.3620. This will drive the asset towards May 26 high at 1.3655, followed by the round-level resistance of 1.3700.
On the flip side, a downside move below February 22 low at 1.3441 would expose the asset to February 9 low at 1.3413. A breakdown below the latter would extend downside towards January 15 low at 1.3382.
USD/CAD daily chart
-
01.04.2024 02:45USD/CAD remains depressed amid bullish Oil prices, manages to hold above 1.3500 mark
- USD/CAD drops to over a one-week low and is pressured by a combination of factors.
- Bullish Oil prices underpin the Loonie and weigh on the pair amid a softer Greenback.
- The US PCE Price Index keeps the June Fed rate cut on the table and weighs on the buck.
The USD/CAD pair extends its recent pullback from the 1.3610-1.3615 supply zone, or the YTD peak and remains under some selling pressure for the sixth successive day on Monday. The downfall, however, stalls ahead of the 1.3500 psychological mark, allowing spot prices to recover a few pips from over a one-week low touched during the Asian session.
Crude Oil prices advance to a five-month peak in the wake of concerns about tighter global supply – fuelled by OPEC+ cuts, attacks on Russian refineries and upbeat Chinese manufacturing data. This, in turn, underpins the commodity-linked Loonie, which, along with a modest US Dollar (USD) weakness, is seen exerting some downward pressure on the USD/CAD pair. In fact, OPEC+ pledged to extend production cuts to the end of June.
Meanwhile, Russian Deputy Prime Minister Alexander Novak said on Friday that its Oil companies will focus on reducing output rather than exports in the second quarter. Moreover, Ukrainian drone attacks knocked out several Russian refineries, which is expected to reduce Russia's Oil exports. Furthermore, a pickup in China's manufacturing activity for the first time in six months adds to the optimism about a rise in fuel demand.
The US Dollar (USD), on the other hand, struggles to lure buyers amid expectations that the Federal Reserve (Fed) will begin its rate-cutting cycle in June, bolstered by the lack of any big surprises from the US Personal Consumption Expenditures (PCE) Price Index on Friday. This, along with the prevalent risk-on environment, is seen weighing on the safe-haven buck and contributing to the offered tone surrounding the USD/CAD pair.
Market participants now look forward to the release of the US ISM Manufacturing PMI for some impetus ahead of the Bank of Canada (BoC) Business Outlook Survey. This, along with Oil price dynamics, should contribute to producing short-term trading opportunities around the USD/CAD pair. The focus, however, will remain glued to the closely-watched monthly employment figures from the US and Canada, due on Friday.
-
29.03.2024 15:24USD/CAD challenges the 20-day SMA following PCE data from the US
- US February’s PCE figures largely met expectations.
- Next week, the focus will be on Nonfarm payrolls for markets to continue placing their bets on the next Fed decisions.
- Hot data may justify a delay in policy rate cuts beyond June.
The USD/CAD pair is currently trading around the 1.3543 level on Friday, reflecting minor losses after hitting a high of 1.3560 earlier in the session. While investors digest Personal Consumption Expenditures (PCE) figures, the market will turn its attention toward forthcoming employment-related figures that may add further nuance to the Federal Reserve's (Fed) posture on a probable policy rate delay.
The PCE Price Index, preferred by the Federal Reserve for gauging inflation in the US, saw a slight uptick to 2.5% annually in February, up from January's 2.4%, meeting expectations. The monthly increase of 0.3% was slightly below the forecasted 0.4%. Core PCE, which excludes food and energy, also rose by 2.8% annually, aligning with predictions, with a 0.3% monthly increase. The upward revision of January's core PCE figures suggests a continued trend of inflation, potentially prompting the Federal Reserve to maintain higher interest rates.
Future policy decisions will be influenced by incoming data, and the health of the labor market may potentially lead to adjustments in the timing and scale of rate cuts. Strong employment figures could prompt Fed policymakers to delay rate cuts beyond June and possibly reduce the number of cuts projected for 2024 from three to two, potentially bolstering the US Dollar. As for now, the strongest case scenario continues to be three rate cuts in 2024, starting in June.
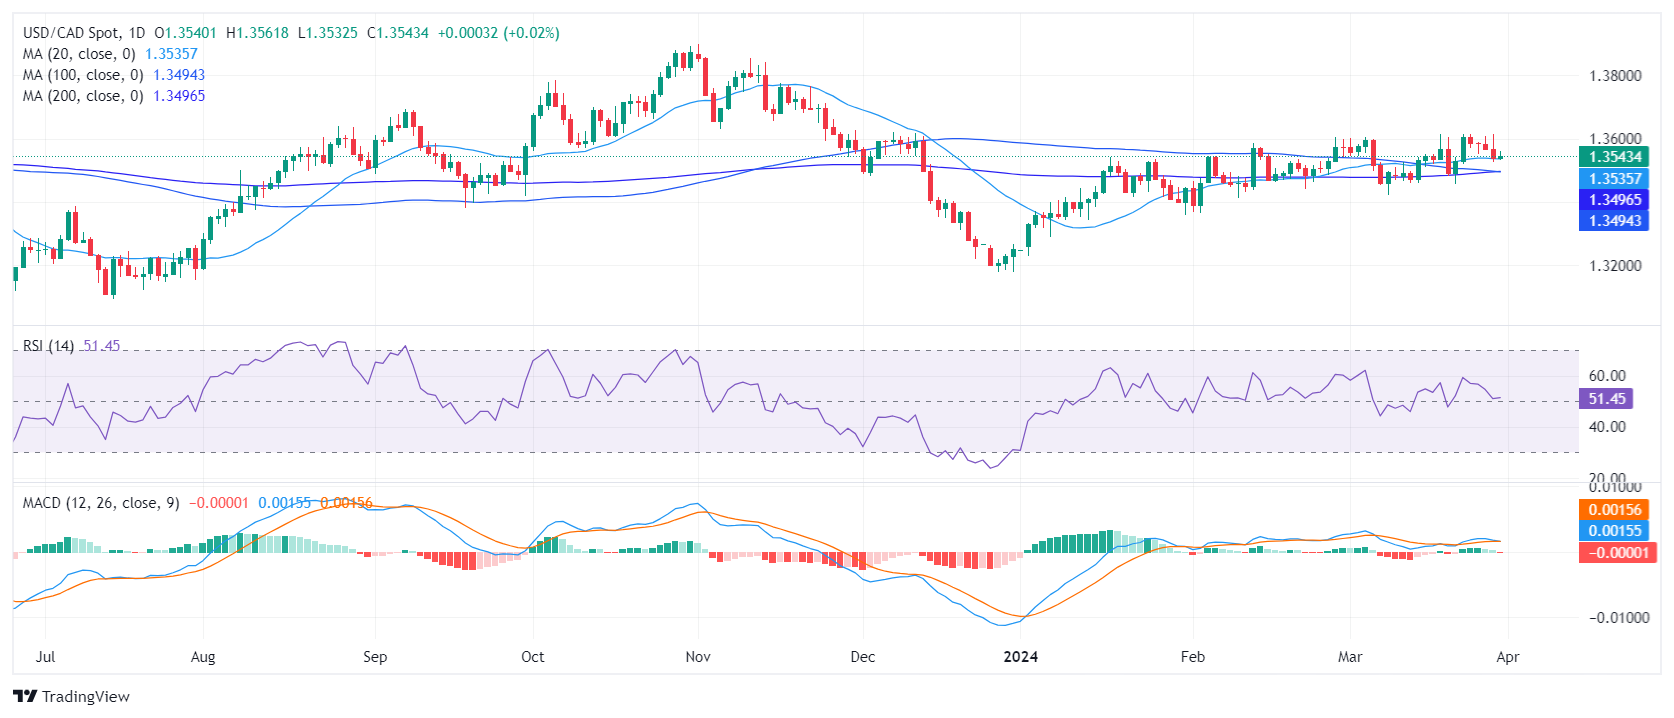
USD/CAD technical analysis
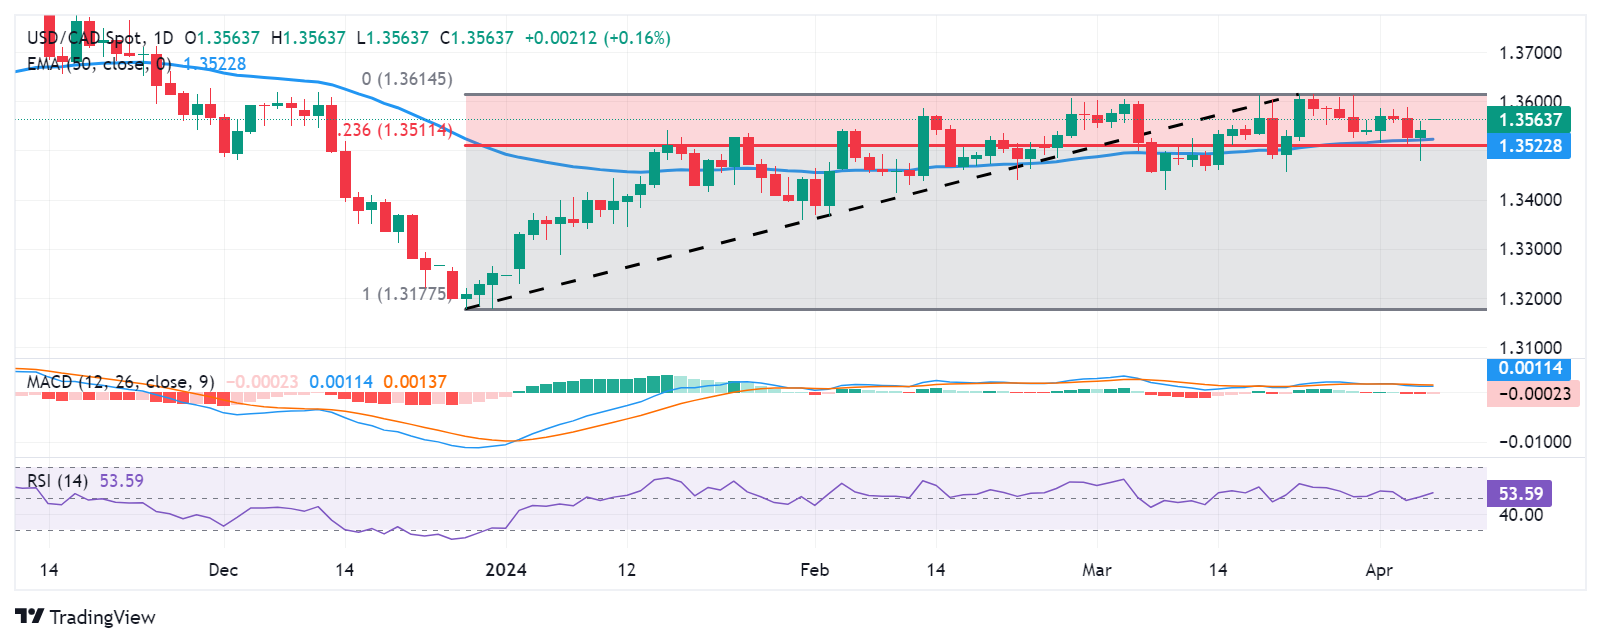
On the daily chart, USD/CAD shows a somewhat stable trend. The Relative Strength Index (RSI) primarily maintains itself in positive territory, indicating that buying pressure slightly dominates the market. However, the Moving Average Convergence Divergence (MACD) histogram printed a new red bar which may imply a weak bullish momentum.
Analyzing the Simple Moving Average (SMA), it is seen that on a broader scale, despite showing a neutral outlook in the short term, the pair is above the 20,100,200-day SMAs. This suggests that the bulls command the overall trend, as long as the bulls defend the challenged 20-day average around the 1.3530 area.
USD/CAD daily chart


© 2000-2024. All rights reserved.
This site is managed by Teletrade D.J. LLC 2351 LLC 2022 (Euro House, Richmond Hill Road, Kingstown, VC0100, St. Vincent and the Grenadines).
The information on this website is for informational purposes only and does not constitute any investment advice.
The company does not serve or provide services to customers who are residents of the US, Canada, Iran, The Democratic People's Republic of Korea, Yemen and FATF blacklisted countries.
Making transactions on financial markets with marginal financial instruments opens up wide possibilities and allows investors who are willing to take risks to earn high profits, carrying a potentially high risk of losses at the same time. Therefore you should responsibly approach the issue of choosing the appropriate investment strategy, taking the available resources into account, before starting trading.
Use of the information: full or partial use of materials from this website must always be referenced to TeleTrade as the source of information. Use of the materials on the Internet must be accompanied by a hyperlink to teletrade.org. Automatic import of materials and information from this website is prohibited.
Please contact our PR department if you have any questions or need assistance at pr@teletrade.global.
transfers