- Analytics
- News and Tools
- Quotes
- Chart and quotes for NZDUSD
CFD Trading Rate New Zealand Dollar vs US Dollar (NZDUSD)
| Date | Rate | Change |
|---|
Related news
-
18.04.2024 08:01NZD/USD rises toward 0.5950 amid subdued US Dollar, risk-on mood
- NZD/USD extends gains as the US Dollar faces challenges on subdued Treasury yields.
- The latest inflation data from New Zealand offers the RBNZ greater flexibility to consider interest rate cuts.
- Fed’s Mester acknowledged that the central bank needs additional assurance before confirming the sustainability of 2% inflation.
NZD/USD continues to gain ground for the second consecutive day, hovering around 0.5930 during the early European session on Thursday. The decline in the US Dollar (USD) contributes support for the NZD/USD pair, which could be attributed to the improved risk sentiment.
On Wednesday, the report indicated that New Zealand's Consumer Price Index (CPI) has hit a nearly 3-year low, registering at 4% year-over-year in the first quarter. This situation provides the Reserve Bank of New Zealand (RBNZ) with more flexibility to contemplate interest rate cuts. Despite acknowledging persistent inflation in specific sectors, the RBNZ opted to maintain interest rates at 5.5% during its policy meeting last week.
On the other side, Federal Reserve Bank of Cleveland President Loretta Mester acknowledged on Wednesday that inflation has exceeded expectations. Mester stressed that the Fed requires further assurance before confirming the sustainability of 2% inflation, as per a Reuters report.
In addition, US Federal Reserve (Fed) Chair Jerome Powell commented on Tuesday that recent data indicates limited progress in inflation this year, suggesting an extended period before reaching the 2% target. This statement potentially signals a hawkish sentiment surrounding the Fed’s upcoming policy decision, which could provide support for the US Dollar, consequently, limiting the advance of the NZD/USD pair.
On the data side, traders await the release of weekly Initial Jobless Claims and Existing Home Sales from the United States (US) on Thursday, which could provide further insight into the state of the US economy and potentially impact the direction of the Greenback.
-
17.04.2024 21:49NZD/USD Price Analysis: Downward trend likely to continue despite indicators recovering
- The RSI on the daily chart lies deep in negative terrain but recovered.
- The hourly RSI paints a growing buying momentum, trending the positive territory.
- The MACD on both charts signals a less intense selling momentum.
The NZD/USD stands recovered to 0.5919, it seeing 0.60% gains. The dominant sentiment remains bearish, subtly dominated by sellers due to the consistent positioning beneath key Simple Moving Averages (SMAs). However, indicators on the daily and hourly charts seem to be recovering.
On the daily chart, the Relative Strength Index (RSI) demonstrates a negative sentiment as it continues an under-50 trend. Although there was a slight uptick from the recent low point seen on Monday, the RSI remains in deep in negative territory. Moreover, the Moving Average Convergence Divergence (MACD) displays falling red bars, reinforcing a weakening bearish momentum.
NZD/USD daily chart
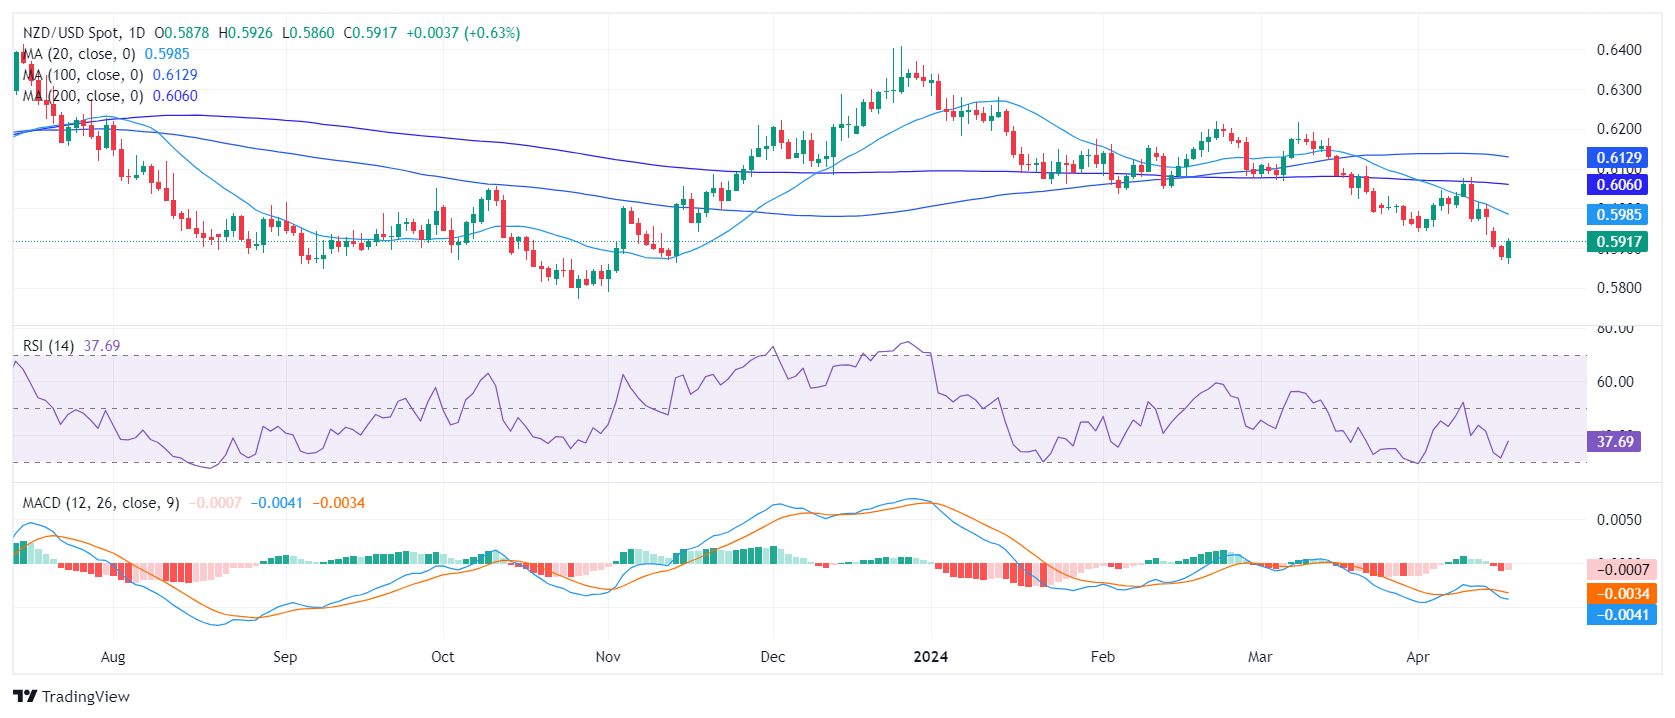
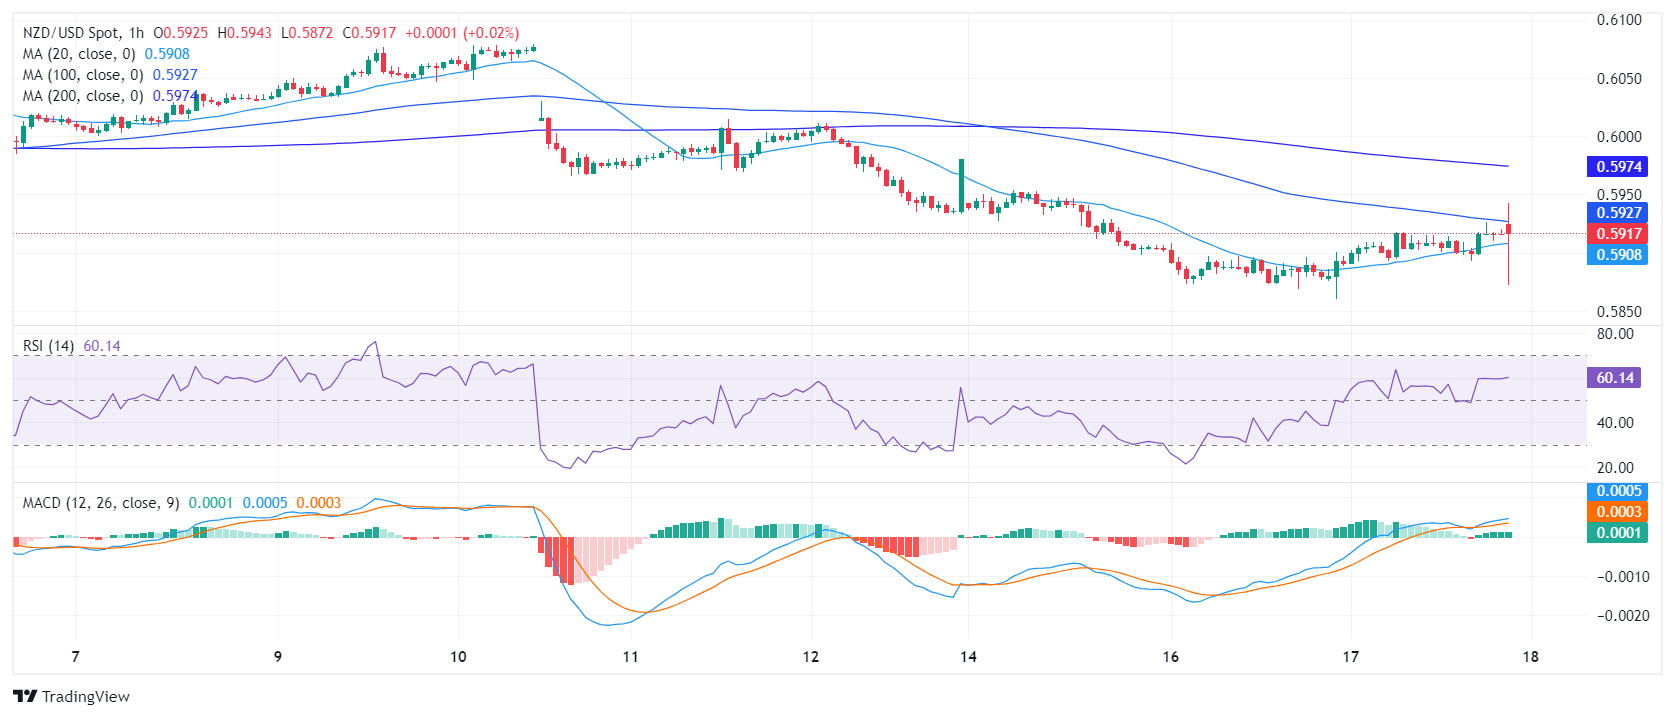
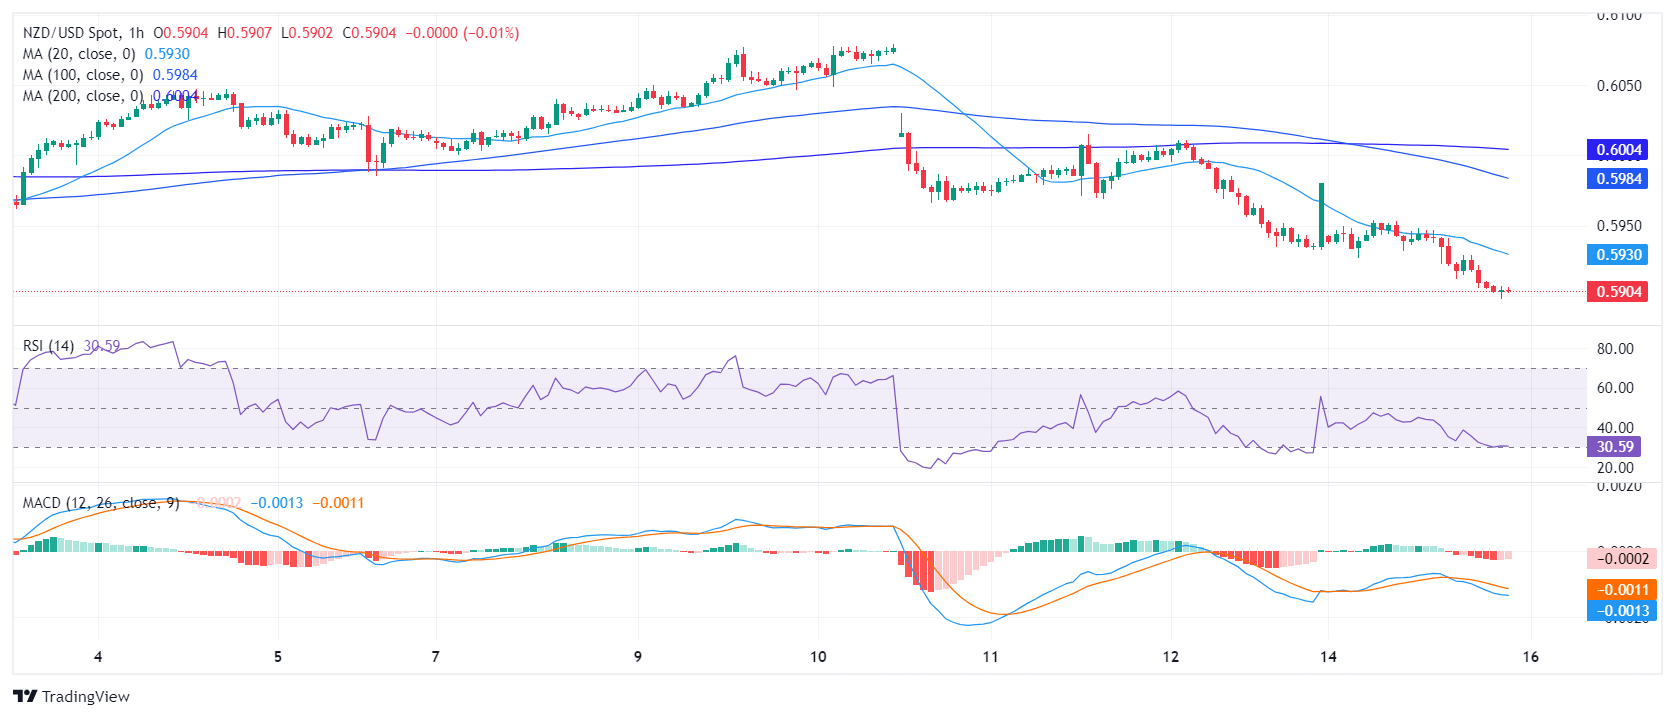
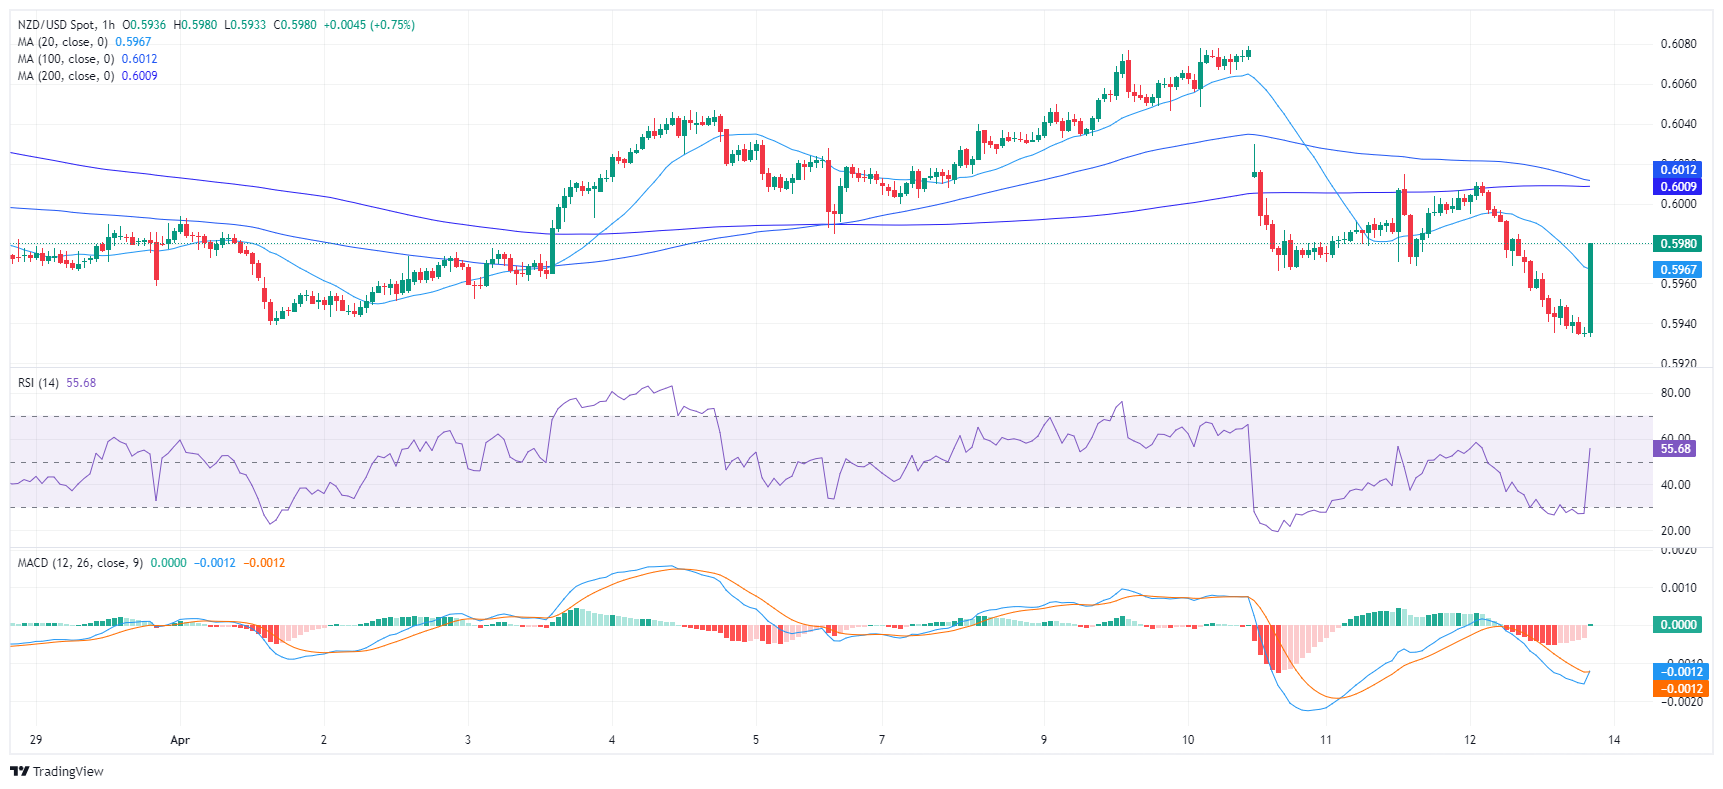
The hourly chart presents an interesting contrast. Here, recent RSI readings consistently float above 50, marking a positive territory. The latest reading is 57, revealing that buyers are taking the reins on the hourly scale. The MACD histogram echoes the buying momentum printing rising green bars.
NZD/USD hourly chart
Upon examining the long-term trend, it becomes apparent that the NZD/USD exhibits bearish momentum as it slots below the 20-day, 100-day, and 200-day Simple Moving Average (SMA) indicators. So any movements which keeps the pair beneath these levels shouldn't be considered as a clear buying signal.
-
17.04.2024 10:50NZD/USD jumps to 0.5900 as investors see RBNZ pivoting to rate cuts later than expected
- NZD/USD moves higher to 0.5900 as traders see the RBNZ reducing key interest rates from November.
- NZ Q1 inflation grew by 0.6% as expected.
- Fed Powell returns to the “higher for longer interest rates” argument.
The NZD/USD pair extends its recovery to the round-level resistance of 0.5900 in Wednesday’s European session. The Kiwi asset strengthens as traders repriced bets supporting rate cuts by the Reserve Bank of New Zealand (RBNZ).
Investors now see the RBNZ beginning to lower borrowing rates from the November meeting instead of the October meeting. Market expectations for the RBNZ starting to reduce its Official Cash Rate (OCR) have been significantly influenced by the expected rise in New Zealand’s Q1 Consumer Price Index (CPI) data released in Wednesday’s early Asian session.
Stats NZ showed that NZ inflation rose by 0.6% as expected, higher from 0.5% growth recorded in the last quarter of 2023. The annual inflation data decelerated to 4.0% against the prior reading of 4.7%. Currently, the RBNZ has been maintaining its Official Cash Rate (OCR) at 5.5%.
A sharp improvement in market sentiment has also boosted demand for the New Zealand Dollar. S&P 500 futures have posted significant gains in the European session. 10-year US Treasury yields have dropped slightly to 4.64%. The rally in the US Dollar Index (DXY) seems stalled near 106.40 as investors had priced in that the Federal Reserve (Fed) will lean towards keeping interest rates higher for a longer period.
On Tuesday, Fed Chair Jerome Powell said, “The recent data have clearly not given us greater confidence, and instead indicate that it’s likely to take longer than expected to achieve that confidence” reported Reuters. In this statement, the recent data is hot consumer price inflation data for March.
Currently, financial markets are anticipating that the Fed will start reducing interest rates from the September meeting.
-
17.04.2024 02:33NZD/USD holds above 0.5900 following New Zealand CPI data
- NZD/USD pair holds positive ground around 0.5905 following New Zealand inflation data.
- The New Zealand CPI inflation rose to 0.6% QoQ in Q1 from 0.5% in the previous reading, as expected.
- Powell said recent data have not given Fed greater confidence, likely to take longer than expected to achieve its target.
The NZD/USD pair rebounds to 0.5905, bouncing off the yearly low of 0.5860 on Wednesday during the early Asian session. The expectation that the Reserve Bank of New Zealand is unlikely to lower its Official Cash Rate (OCR) soon lift the New Zealand Dollar (NZD) against the US Dollar (USD).
The annual rate of inflation in New Zealand has continued to fall, according to figures released by Stats NZ today. The Consumer Price Index (CPI) rose 4.0% YoY in the first quarter of 2024. Stats NZ’s consumer prices senior manager Nicola Growden said, "Price increases this quarter are the smallest since June 2021. However, they remain above the Reserve Bank of New Zealand’s target range of 1 to 3 percent,”
Inflationary pressures in New Zealand eased further in the March quarter, although domestic prices remained uncomfortably sticky, keeping rate cuts by the Reserve Bank of New Zealand unlikely to happen soon. This, in turn, provides some support to the NZD.
On the USD’s front, the hawkish comments from Federal Reserve (Fed) Jerome Powell might lift the US Dollar (USD) in the near term. Fed Chair Powell stated that the US economy has not seen inflation come back to the central bank’s target, suggesting that interest rate cuts are unlikely to be seen in the near future. Investors see a nearly 67% chance that the Fed will cut interest rates in September, according to the CME FedWatch Tool.
Furthermore, the safe-haven flows amid the rising geopolitical tensions in the Middle East might boost the Greenback and cap the upside of the NZD/USD pair. National Security Advisor Jake Sullivan said in a statement late Tuesday that new sanctions targeting Iran and sanctions against entities supporting the Islamic Revolutionary Guard Corps and Iran's Defense Ministry will be imposed in the coming days. -
16.04.2024 22:18NZD/USD plunges on hawkish Powell, risk aversion
- The USD strengthened, propelled by rising US Treasury yields and speculation of a Fed's delaying cuts.
- Escalating geopolitical tensions in the Middle East also drive demand for the Greenback.
- Fed's Powell commented that inflation is showing a lack of progress.
- Soft housing market from the US data failed to trigger a reaction on the pair.
The NZD/USD declined towards 0.5879 on Tuesday reflecting a loss of 0.46%, despite. The pair's movements are largely influenced by the market’s adjustments of their expectations and the delay of a rate cut by the Federal Reserve (Fed) by year-end. Rising Treasury yields are also applying downward pressure on the pair.
On the data front, in March, Building Permits experienced a decline of 4.3%, dropping to 1.458 million, below both projected and February's figures. Housing starts also saw a significant drop of 14.7%, falling short of expectations at 1.321 million. However, industrial production for the same month rose by 0.4%, meeting expectations.
What drives the pair downwards is markets now betting on a more aggressive Fed. Following strong US data, market sentiment adjusted with expectations of an initial rate cut in September, and a 70% probability for a second cut in December. Expectations for a June rate cut have decreased to 25% from 60% the previous week. In addition, on Tuesday, Jerome Powell hinted that he sees no progress on inflation and that he considered that the monetary policy may need some additional time to work. The readjustments in expectations are also propelling US Treasury yields which also benefits the USD over the NZD.
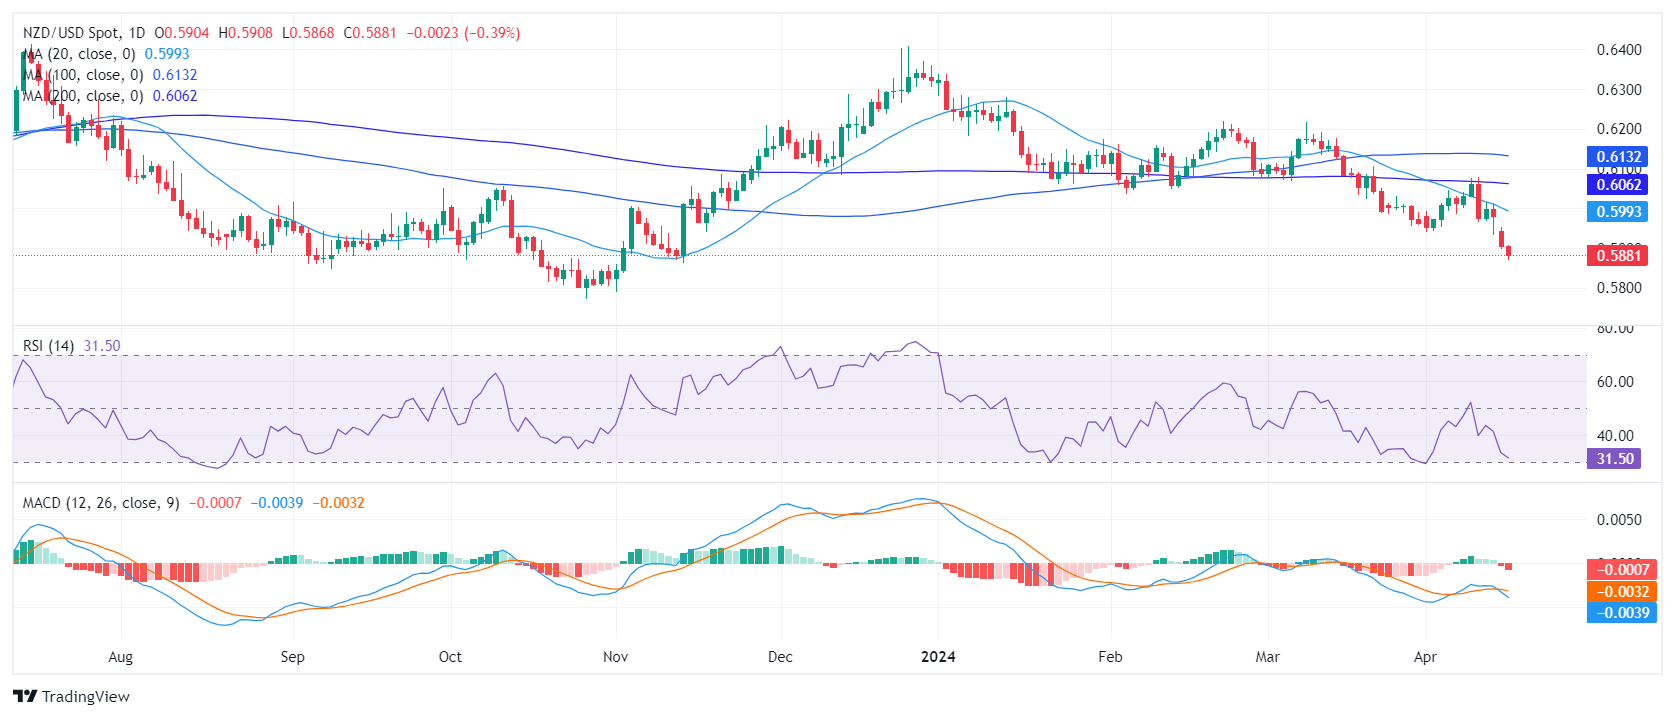
NZD/USD technical analysis
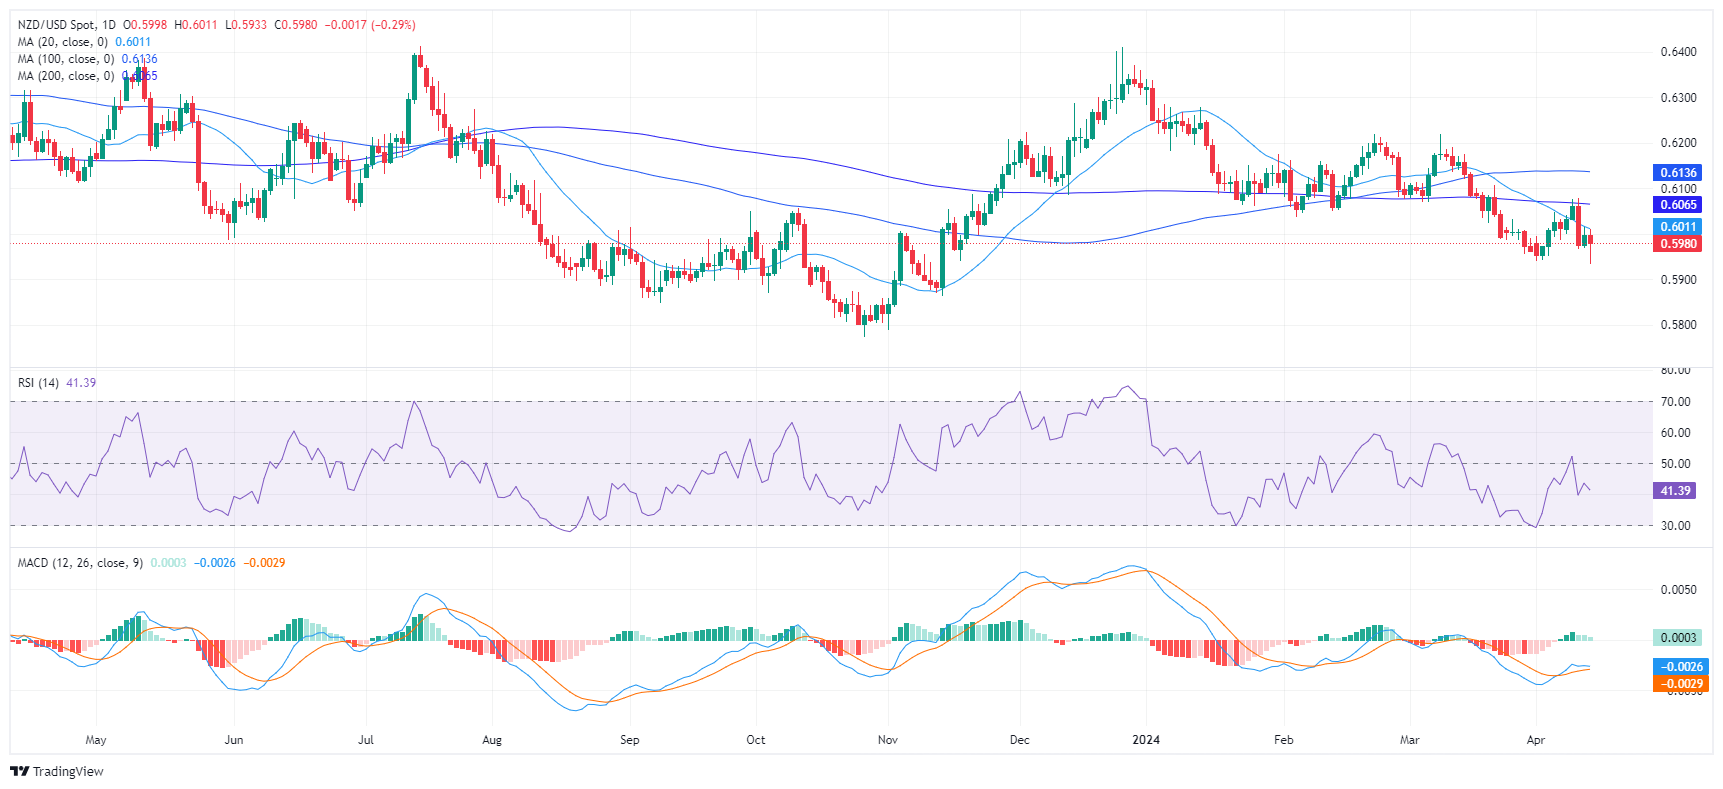
Based on the indicators of the daily chart, the NZD/USD pair is exhibiting negative momentum. The Relative Strength Index (RSI) stands at 33.18, indicating a negative trend and nearing the oversold territory. Additionally, the Moving Average Convergence Divergence (MACD) histogram is exhibiting rising red bars, confirming the negative momentum and suggesting that sellers currently dominate the market.
On the broader outlook, the NZD/USD also shows a negative trend as it trades below its 20, 100, and 200-day Simple Moving Averages (SMA). Unless buyers make a move above these levels, the bears will remain comfortable and dictate the pace of the pair.
NZD/USD daily chart
-
16.04.2024 17:58NZD/USD drops to fresh below 0.5900 on hawkish Powell and risk-off markets
- Fed Powell warns about sticky inflation and sends the US Dollar higher.
- The frail market sentiment on concerns about the Middle East conflict is weighing on the risk-sensitive Kiwi.
- Investors' focus is now on the New Zealand CPI data, due later on Tuesday.
The risk-averse sentiment on concerns about an escalation of the Middle East conflict is hammering the Kiwi this week. The NZD/USD has depreciated about 3.6% in the last few trading days and is about to test the support area at 0.5860.
The US Dollar remains firm, fuelled by rising US bond yields, with investors reassessing their Fed easing calendar. On Tuesday, Fed Chair, Jerome Powell suggested that recent data shows a lack of progress on inflation, which endorses the “higher for longer” Fed outlook.Earlier on Tuesday, the mixed Chinese data seen on Wednesday failed to provide a significant impulse to the China-proxy Kiwi. China’s GDP accelerated to a 5.3% yearly growth in the first quarter, above expectations of a 5% reading. These figures, however, have been offset by weak consumption and industrial production data.
The focus is now on New Zealand’s Consumer Prices Index report, due later on Tuesday. Price pressures are expected to have ticked up in March, which would support the Kiwi. A negative surprise could accelerate the pair’s downtrend. -
16.04.2024 03:30NZD/USD depreciates amid risk aversion due to geopolitical tensions, trades below 0.5900
- NZD/USD extends its losing streak as traders adopt cautious stance amid anticipation of Israel's response to Iran's assault.
- US Retail Sales (MoM) rose by 0.7% in March, against the expected 0.3% and 0.9% prior.
- US Dollar extends gains on amplified expectations of the Fed maintaining higher policy rates for an extended period.
NZD/USD depreciates to near 0.5880 during the Asian trading session on Tuesday, as investors turn toward the US Dollar (USD) seeking refuge amid escalated geopolitical tensions in the Middle East. Traders await Israel’s response to Iran’s airstrike over the weekend. Additionally, traders are awaiting New Zealand's Consumer Price Index (CPI) data for the first quarter of 2024, scheduled for release on Wednesday. Market expectations suggest a slight uptick to 0.6% quarter-on-quarter, compared to the previous period's 0.5%.
The Chinese and Iranian foreign ministers recently engaged in a phone conversation, during which the Iranian foreign minister conveyed Iran's willingness to exercise restraint and expressed no desire to escalate the current situation further, as per Chinese state media. Additionally, China vehemently condemns and firmly opposes the recent attack on the Iranian embassy in Syria, deeming it a serious breach of international law and categorizing it as 'unacceptable'.
The New Zealand Dollar (NZD) fails to take any response from the mixed Chinese data, considering the two nations are close trading partners. China’s Gross Domestic Product (GDP) rose by 1.6% QoQ in the first quarter of 2024, against the previous quarter’s increase of 1.0%. GDP year-over-year rose by 5.3%, exceeding the expected 5.0% and 5.2% prior. Meanwhile, China’s Industrial Production (YoY) increased by 4.5% in March, against the market expectations of 5.4% and 7.0% prior
On the other side, the US Dollar (USD) gained strength as Retail Sales surpassed expectations, denting hopes for potential monetary policy easing by the Federal Reserve (Fed). March's Retail Sales (MoM) surged by 0.7%, outpacing forecasts of 0.3%. February's figure was also revised upward from 0.6% to 0.9%. The Retail Sales Control Group climbed by 1.1%, marking a substantial increase from the previous 0.3%. Investors are now eyeing upcoming US housing data due on Tuesday, as well as Fed Chair Jerome Powell's speech at the Washington Forum.
-
15.04.2024 22:13NZD/USD Price Analysis: Bears maintain control, upwards correction signals emerge
- The daily RSI reveals a negative trend for NZD/USD, suggesting prevalent selling pressure.
- As the RSI stands near oversold conditions, the daily chart hints at a potential consolidation in the next sessions.
- Indicators on the hourly chart corroborate the selling bias, while subtly highlighting signs of imminent recovery.
The NZD/USD pair is currently trading at around 0.5903, suggesting a stronghold of the sellers in the market. The pair's tendency to trade below the short-term Simple Moving Averages (SMAs) indicates a short-term bearish outlook. However, with the oversold conditions looming, a possible reversal may not be too far off.
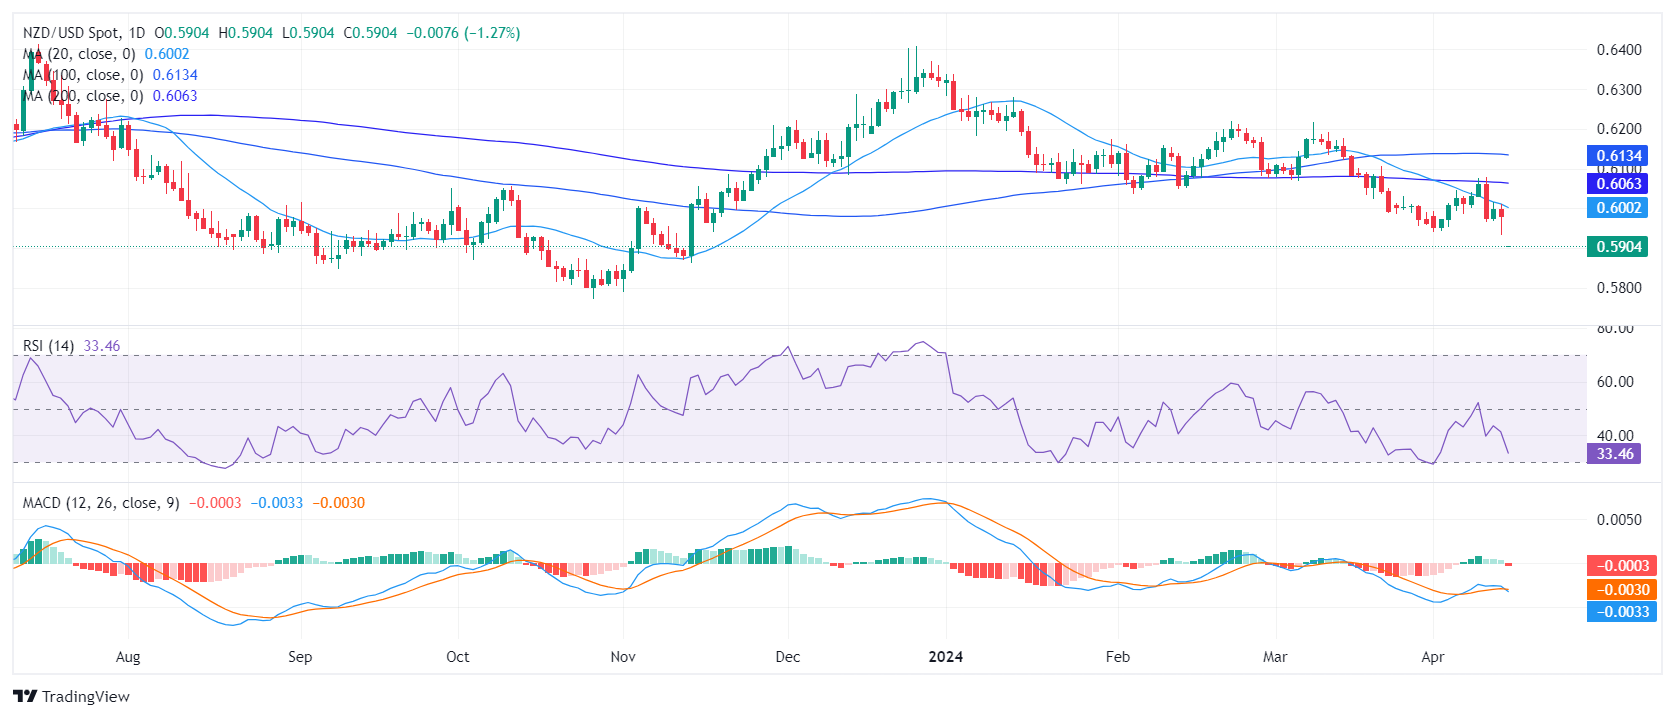
On the daily chart, the Relative Strength Index (RSI) readings have remained under a negative trend with the RSI sitting at 35, indicating a nearing oversold condition. This suggests that sellers have dominated the market in recent sessions. The negative momentum is also represented by the fresh red bar of the Moving Average Convergence Divergence (MACD), suggesting a current bearish bias. However, the nearing oversold condition signals the possibility of a trend reversal.
NZD/USD daily chart
Comparing this to the hourly chart, it is observed that the RSI values are still in the negative range and dangerously near the oversold threshold. The MACD histogram presents a flat red bar, indicating negative momentum, and essentially reaffirms the conclusion drawn from the daily charts, that the market has a prevalent selling bias, but there are signs of potential recovery.
NZD/USD hourly chart
Inspecting the broader outlook, the NZD/USD shows a negative outlook as it sits below its 20,100 and 200-day Simple Moving Average (SMA).
In conclusion, both the daily and the hourly technical outlooks suggest a bearish bias for the NZD/USD pair. However, traders should remain cautious of potential reversals given the nearing oversold condition based on the RSI readings.
-
15.04.2024 09:29NZD/USD Price Analysis: Tests the key barrier of 0.5950; next resistance at 14-day EMA
- NZD/USD consolidates amid heightened geopolitical tensions after Iranian attack on Israel.
- Technical analysis suggests a confirmation of a tepid momentum for the pair.
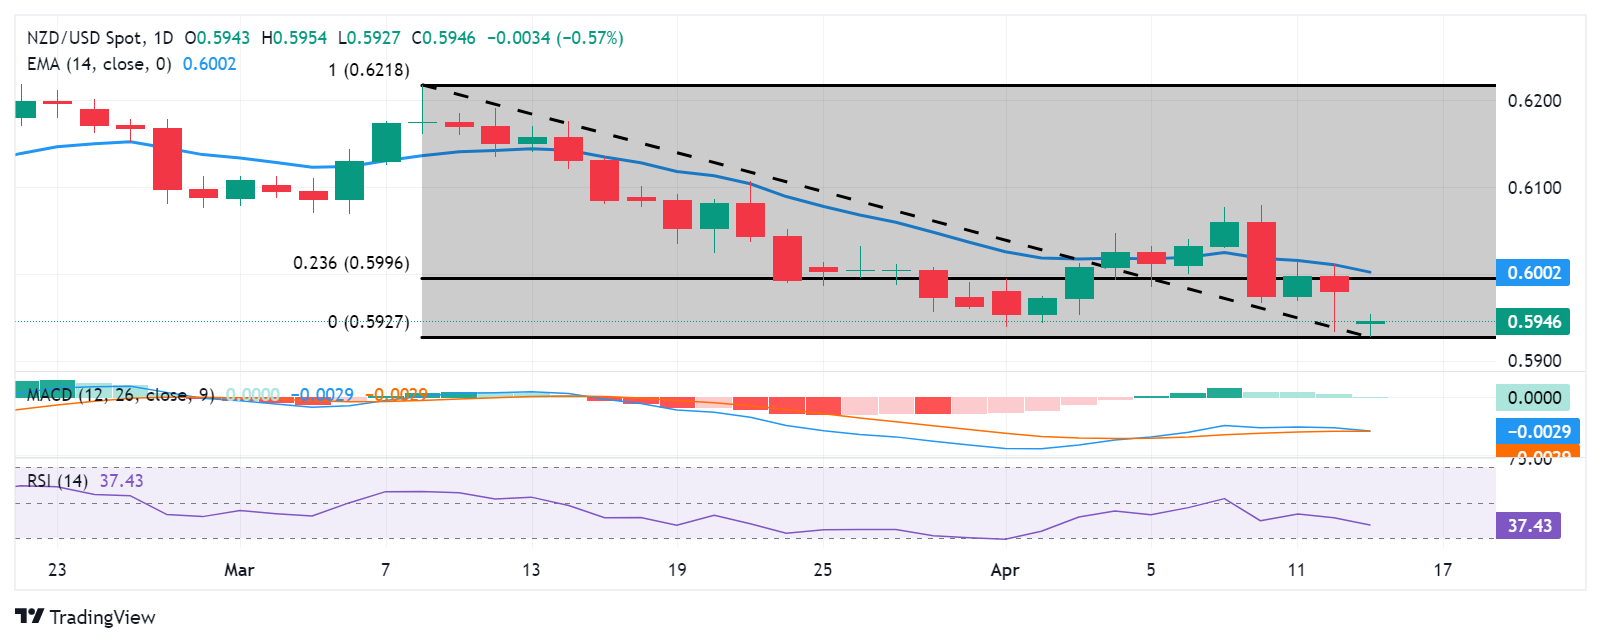
- The level of 0.5950 appears as the immediate barrier followed by the 23.6% Fibo level of 0.5996 and the psychological level of 0.6000.
NZD/USD moves back and forth amid heightened geopolitical tensions in the Middle East after Iran attacked potential Israel military on Saturday by launching explosive drones and missiles targeting military installations in Israel. However, Israel successfully intercepted most of the incoming projectiles, according to Reuters. The NZD/USD pair consolidates around 0.5940 during the European session on Monday.
According to the Moving Average Convergence Divergence (MACD) analysis, a prevailing downward sentiment is indicated for the NZD/USD pair. This is evidenced by the MACD line positioned below the centerline and the signal line, signaling a bearish trend.
Furthermore, the 14-day Relative Strength Index (RSI) is below the 50 level, providing additional confirmation of the bearish sentiment, which could prompt traders of the NZD/USD pair to navigate the region around the psychological level of 0.5900. A break below the latter could influence the NZD/USD pair to approach further support at the major level of 0.5850.
On the upside, the NZD/USD pair could find immediate resistance at the major level of 0.5950. A breakthrough above this level could lead the pair to test a strong resistance area around the 23.6% Fibonacci retracement level of 0.5996, aligned with the psychological level of 0.6000 and 14-day Exponential Moving Average (EMA) of 0.6001.
NZD/USD: Daily Chart
-
15.04.2024 05:41NZD/USD clings to near 0.5950, Business NZ PSI falls back into contraction
- NZD/USD rebounds from five-month lows despite hawkish tone surrounding the Fed.
- Business NZ PSI decreased to 47.5 for March, from the previous reading of 52.6.
- Fed Kansas President Lorie K. Logan will speak in a panel discussion at the BoJ-IMF conference on Monday.
NZD/USD rebounds from a five-month low of 0.5927 reached on Monday, hovering around 0.5950 during the Asian trading hours. The New Zealand Dollar (NZD) might have faced a struggle as New Zealand’s services sector fell back into contraction during March. Business NZ Performance of Services Index (PSI) report posted a reading of 47.5 for March, as compared to 52.6 prior.
According to BNZ’s Senior Economist Doug Steel, when today’s weak PSI activity is combined with last week’s similarly weak PMI activity, the composite reading suggests that GDP could decline by more than 2% compared to year-earlier levels. This projection is significantly weaker than what most analysts are forecasting.
Furthermore, market participants will likely closely observe a slew of key data from top trading partner China on Tuesday, including Q1 Gross Domestic Product (GDP) readings and Retail Sales and Industrial Output for March. Traders will shift their focus to the release of New Zealand’s Consumer Price Index (CPI) data on Wednesday.
On the other side, the Federal Reserve (Fed) seems to reevaluate its monetary easing plans due to ongoing US inflation and robust macroeconomic indicators. Core US Producer Price Index (PPI) report showed on Thursday, an increase of 2.4% YoY in March. The market was expecting a rise to 2.3% from 2.1% prior.
Market participants are expected to closely watch the US Retail Sales figures due to be released on Monday. Additionally, Federal Reserve Bank of Kansas President Lorie K. Logan will participate in a panel discussion at the BoJ-IMF conference on Monday.
-
12.04.2024 21:26NZD/USD Price Analysis: Bearish dominance persists, signs of short-term bullish recovery detected
- The daily RSI of the NZD/USD reveals that sellers remain in command with values below 50.
- The daily MACD shows a slowdown in selling pressure as flat green bars begin to form.
- Buyers hint at gaining minor traction in the short term, with hourly indicators recovering.
The NZD/USD pair reflects the ongoing dominance of sellers, declining towards the 0.5935 mark. While signs of bearish control are evident, there is a clue of bullish resilience, hinting at a neutral to bearish outlook in the short term.
The daily Relative Strength Index (RSI) maintains a consistent presence in the negative territory below 50, with the latest value at 38 which indicates that sellers are in command. That being said, green bars take shape on the Moving Average Convergence Divergence (MACD) histogram, indicating a slowing of the bearish momentum.
NZD/USD daily chart
In contrast, the hourly chart indicates a gradually increasing RSI with the latest reading at 47. This suggests a mild recovery of buying interest after dropping into oversold conditions earlier in the session. Moreover, the MACD histogram shows a fresh green bar, implying a positive change in the short term momentum.
NZD/USD hourly chart
With respect to the broader trend, the outlook is bearish with the pair below the 20,100 and 200-day Simple Moving Averages (SMAs). However, the pair is close to its 20-day average and if buyers regain additional ground and recapture it, the outlook may start to shift in favor of the bulls.
-
12.04.2024 08:07NZD/USD refreshes daily low on weaker Chinese trade data, sustained USD buying
- A combination of factors prompts fresh selling around NZD/USD on Friday.
- Reduced Fed rate cut bets and geopolitical tensions lift the USD to YTD top.
- Weaker Chinese trade data drives flow away from antipodean currencies.
The NZD/USD pair meets with a fresh supply on Friday and drops to a fresh daily low following the release of weaker Chinese trade data during the early European session. Spot prices reverse the previous day's modest recovery gains and currently trade near the lower end of the weekly range, around the 0.5970-0.5975 region.
Data published by the Customs General Administration of China showed that exports declined sharply, by the 7.5% YoY rate in March as compared to the 3.0% fall expected and the 7.1% growth registered in the January-February period. Adding to this, imports fell by the 1.9% YoY rate during the reported month against the 1.2% rise anticipated and the 3.5% previous. This points to weak global as well as domestic demand and adds to concerns about recovery in the world's second-largest economy, which, in turn, undermines antipodean currencies, including the Kiwi.
The US Dollar (USD), on the other hand, gains strong follow-through positive traction and hits a fresh YTD peak in the wake of expectations that the Federal Reserve (Fed) will delay cutting interest rates amid sticky inflation. Apart from this, persistent geopolitical tensions turn out to be another factor benefiting the safe-haven buck, which, in turn, is seen exerting downward pressure on the NZD/USD pair. The fundamental backdrop, meanwhile, suggests that the path of least resistance for spot prices is to the downside and any attempted recovery is likely to get sold into.
Market participants now look forward to the release of the Preliminary Michigan Consumer Sentiment Index. This, along with speeches by influential FOMC members, will drive the USD demand later during the early North American session and provide some impetus to the NZD/USD pair. Nevertheless, spot prices remain on track to register weekly losses, though manage to hold above the YTD trough, around the 0.5940 region touched last week.
-
11.04.2024 11:08NZD/USD Price Analysis: Remains below 0.6000 as US Dollar sees more upside
- NZD/USD dips below 0.6000 as US Dollar strengthens after the release of the hot US Inflation data.
- Investors see the Fed to begin reducing interest rates from September, previously anticipated from June.
- The RBNZ delivered a hawkish guidance after keeping the OCR steady at 5.5%.
The NZD/USD pair finds a temporary cushion near 0.5966 in Thursday’s European session after falling vertically from the round-level resistance of 0.6100. The Kiwi asset is expected to deliver more losses as the US Dollar strengthens after expectations for the Federal Reserve (Fed) pivoting to rate cuts shifted to the September policy meeting from prior anticipation in June.
The US Dollar Index (DXY) jumps to more than four-month high above 105.00 as stronger-than-expected United States inflation data for March forces traders to unwind bets supporting rate cuts by the Fed. Also, traders’ anticipation for number of rate cuts by the Fed this year reduced to two from three projected by policymakers in the latest dot plot.
Meanwhile, investors shift focus to the US Producer Price Index (PPI) data for March, which will be published at 12:30 GMT. The annual headline PPI is forecasted to have grown strongly by 2.2% after increasing 1.6% in February. In the same period, annual core PPI that excludes volatile food and energy prices is anticipated to have risen sharply by 2.3% against the former reading of 2.0%.
On the Kiwi front, the Reserve Bank of New Zealand (RBNZ) kept its Official Cash Rate (OCR) unchanged at 5.5% for the sixth time in a row. The RBNZ delivered a hawkish guidance as annual price pressures at 4.7% are significantly higher than the desired range of 1-3%.
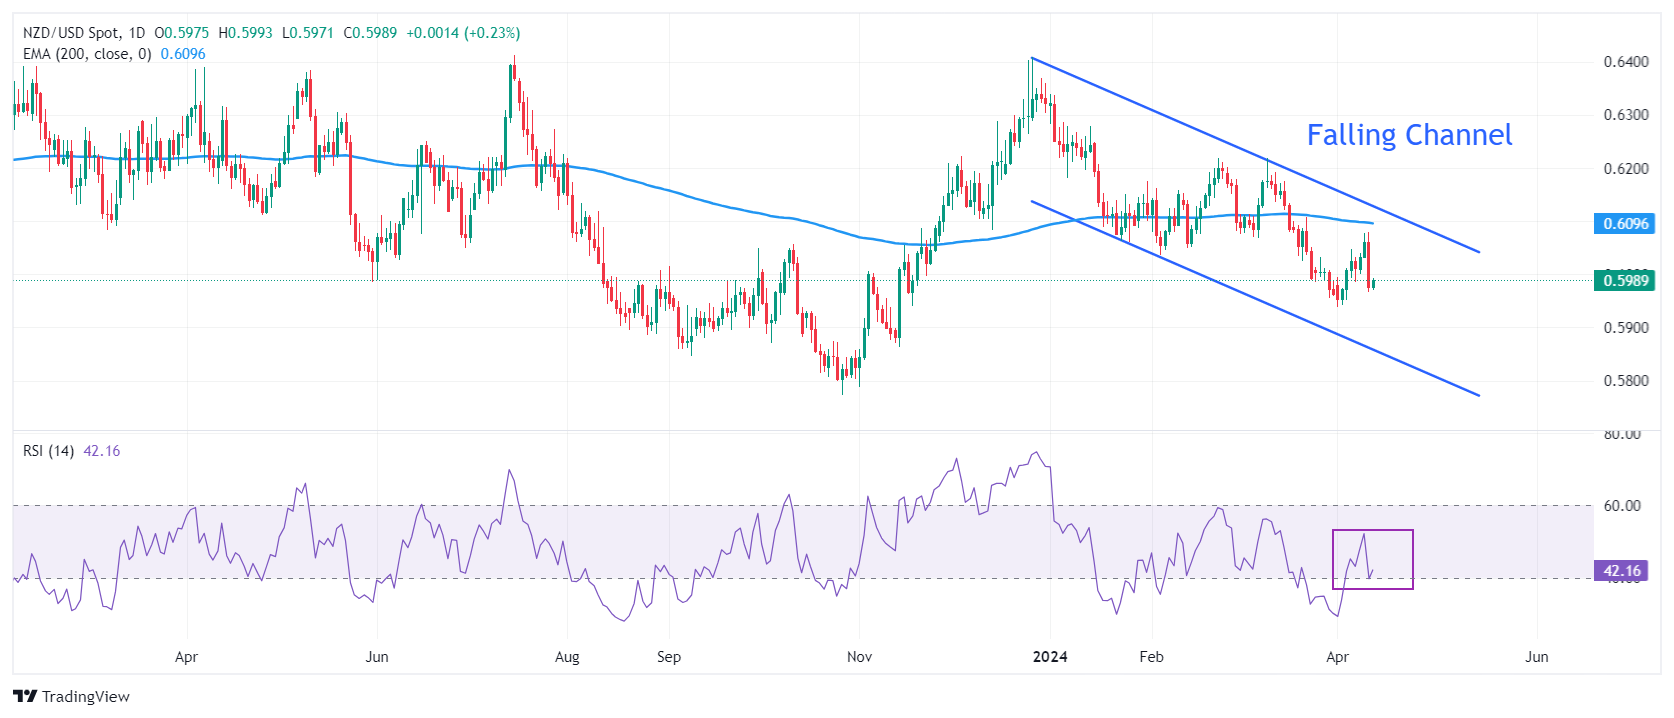
NZD/USD falls sharply while attempting to recapture the crucial resistance of 0.6100. The Kiwi asset trades in the Falling Channel chart pattern in which each pullback is considered as selling opportunity by the market participants. The long-term outlook of the Kiwi asset remains bearish as it trades below the 200-period Exponential Moving Average (EMA), which trades around 0.6100.
The 14-period Relative Strength Index (RSI) drops to 40.00. A bearish momentum would trigger if the RSI drops below the above-mentioned level.
Fresh downside would appear if the asset breaks below November 17 low at 0.5940. This would drag the asset toward the round-level support of 0.5900, followed by November 13 low at 0.587.
On the flip side, a recovery move above March 18 high at 0.6100 will drive the pair toward March 12 low at 0.6135. A breach of the latter will drive the asset further to February 9 high around 0.6160.
NZD/USD daily chart
-
11.04.2024 01:55NZD/USD trades strongly above 0.5980 following the Chinese CPI, PPI data
- NZD/USD holds positive ground near 0.5982 after the Chinese economic data on Thursday.
- Chinese CPI rose 0.1% YoY in March, compared to a 0.7% rise in February and the consensus of 0.4% increase.
- The strong US economy and elevated inflation triggered the Federal Reserve (Fed) to delay cutting interest rates this year.
The NZD/USD pair gains ground around 0.5982 on Thursday during the Asian trading hours. The Chinese Consumer Price Index (CPI) was softer than estimated in March, while the Producer Price Index (PPI) was in line with expectations. The attention will shift to the US PPI for March, due later on Thursday.
The latest key Chinese data from the National Bureau of Statistics of China indicated easing inflation in the world’s second-largest economy. China’s Consumer Price Index (CPI) rose 0.1% YoY in March, compared to a 0.7% rise in February and the consensus of a 0.4% increase. On a monthly basis, Chinese CPI inflation arrived at -1.0% MoM in March versus 1.0% prior, below the 0.5% decline estimated.
Finally, China’s Producer Price Index (PPI) fell 2.8% YoY in March, compared with a 2.7% decline in the previous reading, beating market expectations in the reported period. Concerns over slowing economic growth in China have grown in recent months and the softer inflation data raises concerns about uncertain economic prospects, which might cap the upside of the China-proxy New Zealand Dollar (NZD) against the USD.
On the other hand, the robust US economy and elevated inflation could convince the Federal Reserve (Fed) to cut interest rates this year. This, in turn, provides some support to the Greenback. According to the CME's FedWatch tool, financial markets now see a 66% likelihood of an interest rate cut at the September meeting. -
10.04.2024 10:42NZD/USD Price Analysis: Aims to recapture 0.6100 as RBNZ maintains hawkish guidance
- NZD/USD marches toward 0.6100 as RBNZ’s hawkish interest rate outlook strengthens the Kiwi dollar.
- The RBNZ kept its OCR steady at 5.5% for the sixth time in a row.
- Investors await the US Inflation data that will influence expectations for Fed pivoting to rate cuts.
The NZD/USD pair advances toward the round-level resistance of 0.6100. The Kiwi asset exhibited strength in Wednesday’s European session as the Reserve Bank of New Zealand (RBNZ) delivered hawkish guidance after keeping its Official Cash Rate (OCR) unchanged at 5.50%.
The RBNZ hold its OCR steady at 5.50% for the sixth time in a row. The RBNZ commented that the monetary policy will remain restrictive to maintain downward pressure on inflationary pressures. The New Zealand economy is going through a rough phase as it remained in a technical recession in the second-half of 2023. Though the RBNZ needs to make a balance as annual inflation at 4.7% is significantly higher than the desired range between 1% and 3%.
Meanwhile, investors await the United States Consumer Price Index (CPI) data for March, which will be published at 12:30 GMT. According to economists, monthly headline and core inflation data are projected to have increased by 0.3%, higher than the pace of 0.17%, which is required for inflation to come down to the 2% target. This would not convince Federal Reserve (Fed) policymakers to consider rate cuts by the first half of this year.
The appeal for the US Dollar will strengthen if the inflation data turns out hotter than expected. Currently, the US Dollar Index (DXY), which tracks the US Dollar’s value against six major currencies, is slightly down to 104.00.
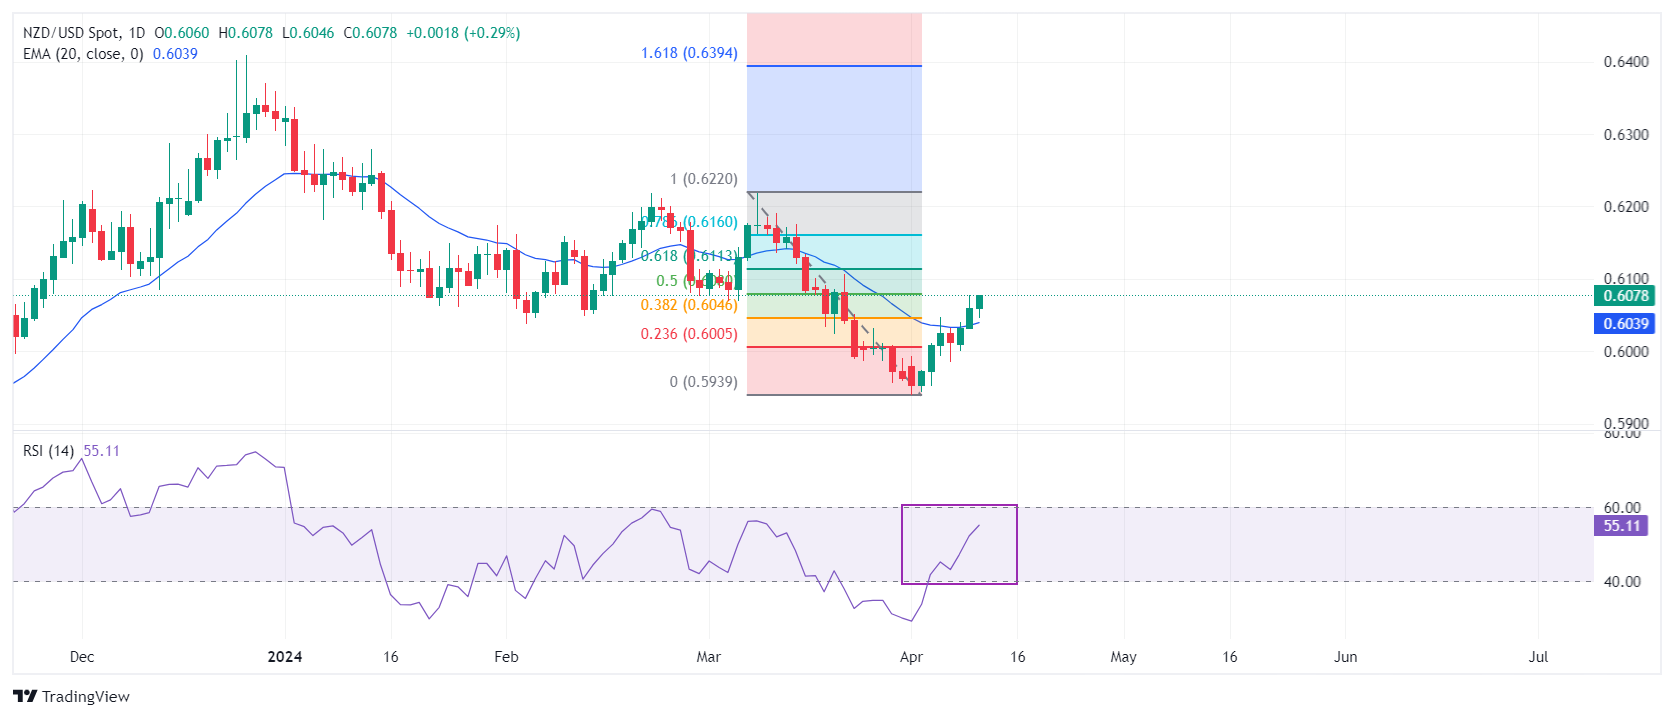
NZD/USD continues its winning spell for the third trading session on Wednesday. The Kiwi asset recovers to 50% of the Fibonacci retracement (plotted from March 8 high at 0.6218 to April 1 low near 0.5940), which is at 0.6080. The asset remains above the 20-day Exponential Moving Average, which trades around 0.6040, suggesting that near-term demand remains intact.
The 14-period Relative Strength Index (RSI) approaches 60.00. If the RSI manages to break decisively above that level, bullish momentum will trigger.
Further upside above March 18 high at 0.6100 will drive the pair toward March 12 low at 0.6135. A breach of the latter will drive the asset to 78.6% Fibo retracement at 0.6160.
In an alternate scenario, a downside move would appear if the asset breaks below April 5 low of 0.5985. This would drag the asset toward November 17 low at 0.5940, followed by the round-level support of 0.5900.
NZD/USD four-hour chart
-
10.04.2024 02:18NZD/USD moves back and forth after RBNZ interest rate decision, hovers around 0.6060
- NZD/USD experiences volatility after RBNZ’s interest rate decision.
- RBNZ holds its current Official Cash Rate at 5.5%.
- US Dollar receives downward pressure due to lower US Treasury yields.
NZD/USD has experienced fluctuations after the interest rate decision by the Reserve Bank of New Zealand (RBNZ). As expected, the central bank has maintained its Official Cash Rate (OCR) at 5.5% for the sixth consecutive meeting. The pair maintains position around 0.6060 during the Asian trading hours on Wednesday.
Policymakers emphasized the importance of keeping rates restrictive to curb inflation. Additionally, some economists perceived this decision as dovish, considering New Zealand's economy has entered a recession and consumer confidence has sharply declined. Markets are pricing in the possibility of the RBNZ's first rate cut in August.
US Dollar Index (DXY) attempts to hold its ground ahead of the release of the US Consumer Price Index (CPI) data and the FOMC Minutes scheduled to be released later in the North American session.
However, the US Dollar (USD) faced struggles due to lower US Treasury yields. At the time of writing, DXY consolidates around 104.10, with 2-year and 10-year yields on US Treasury bonds standing at 4.74% and 4.35%, respectively.
The US headline Consumer Price Index is anticipated to accelerate in March, while the core measure is expected to moderate. The US Dollar is in a state of anticipation, awaiting potential policy shifts influenced by incoming data. Strong labor market figures from last week may prompt a more hawkish stance from the Federal Reserve if inflation surpasses expectations.
According to the CME FedWatch Tool, the probability of a 25-basis point rate cut by the Fed in June has slightly risen to 53.5%. However, the likelihood of a rate cut in July has decreased to 49.9%.
-
10.04.2024 00:51NZD/USD gains ground above 0.6060 ahead of RBNZ rate decision, US CPI data
- NZD/USD edges higher to 0.6065 in Wednesday’s early Asian session.
- RBNZ will announce its monetary policy decision on Wednesday, with no change in rates expected as inflation remains too high.
- The recent US employment report raises speculation that the Fed might delay the easing cycle.
The NZD/USD pair trades in positive territory for the third consecutive day near 0.6065 during the early Asian section on Wednesday. Market players will closely watch the Reserve Bank of New Zealand (RBNZ) interest rate decision on Wednesday. Later in the day, the US March Consumer Price Index (CPI) inflation figures and the FOMC Minutes will be in the spotlight.
The RBNZ is widely expected to maintain the Official Cash Rate (OCR) at 5.50% for the sixth meeting in a row. As a rate-on-hold decision is fully priced in, markets will monitor the tone of the New Zealand central bank and the timing of rate cuts. High inflation is a major factor in why the RBNZ is cautious of signals that rate cuts are imminent. Analysts believe the RBNZ would rather wait for the Federal Reserve (Fed) to cut rates first. This, in turn, might boost the New Zealand Dollar and create a tailwind for the NZD/USD pair.
On the USD’s front, the recent US employment report last week indicated the US economy added more jobs than expected, prompting speculation that the Fed might delay the easing cycle. Fed Chair Jerome Powell said that the US central bank could cut rates if the US economy continued on its current course, while adding that the main factor in the central bank's rate-cutting decision is when or whether inflation will return to the Fed’s 2% target. After the RBNZ monetary policy meeting, attention will shift to the US CPI inflation data and the FOMC Minutes, which might offer some insights about the further inflation and interest rate outlook. -
09.04.2024 22:04NZD/USD Price Analysis: Bears weaken as bullish momentum hints at possible recovery
- The daily chart reveals a shift in NZD/USD from a bearish to a bullish short-term outlook.
- Hourly chart indicators echo the bullish trend visible in the daily analysis.
- Buyers will need to claim dominance over key SMAs to make strides in the market.
The NZD/USD rose to around 0.6058, reflecting a 0.41% gain on Tuesday's session. Despite the pair experiencing a momentum shift from bearish to bullish, it is positioned beneath key Simple Moving Averages (SMAs), hinting at a possible extended downtrend.
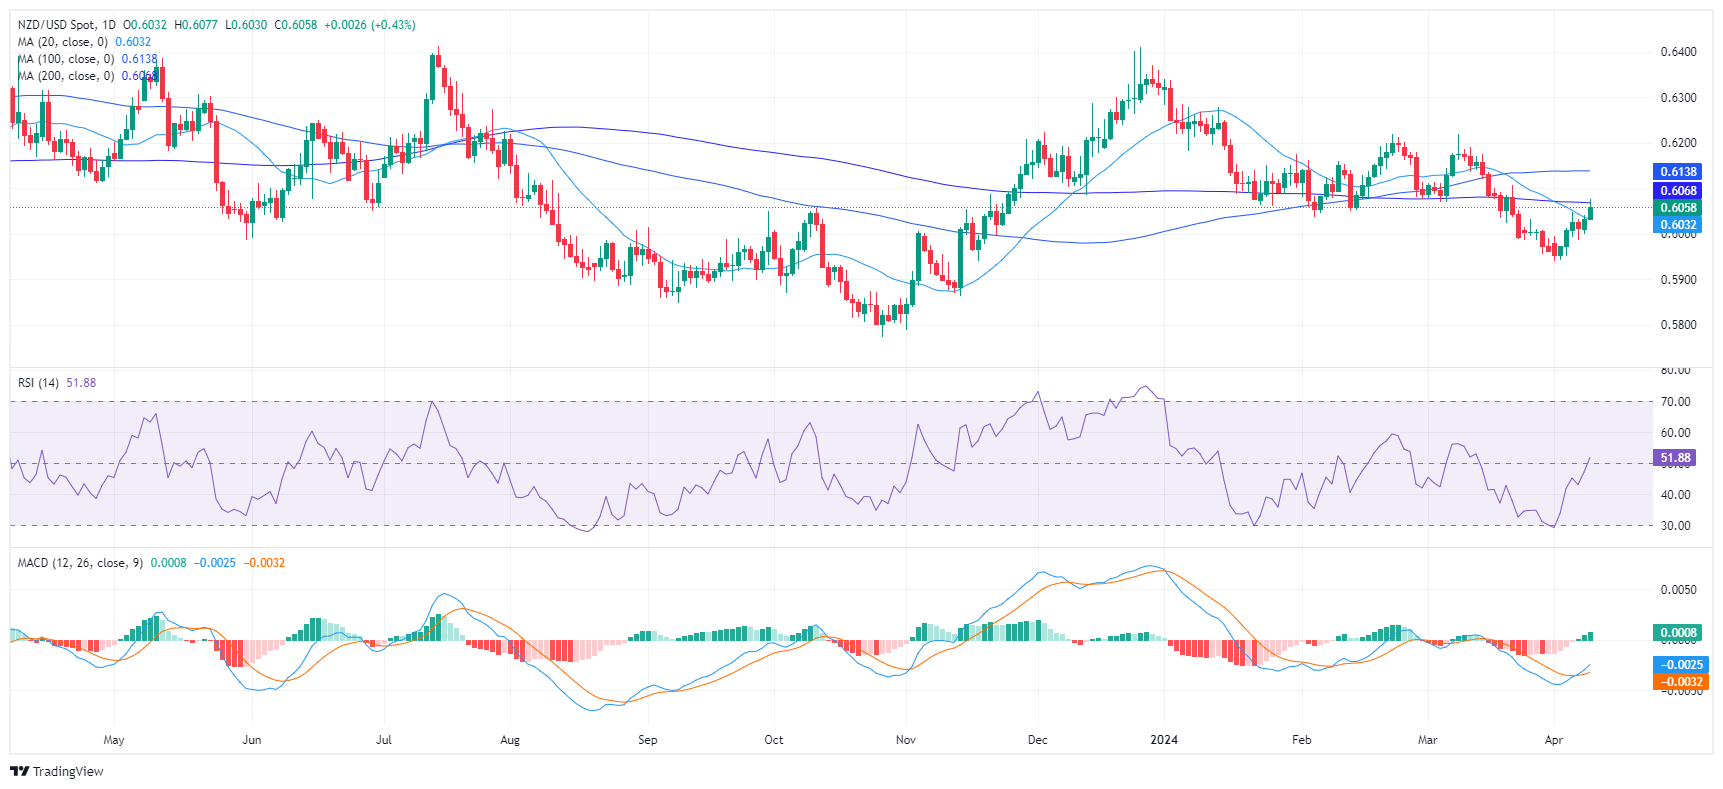
On the daily chart, the Relative Strength Index (RSI) rose from negative territory and is now within the positive zone. This indicates a reversal from a bearish trend to a bullish short-term outlook. Further strengthening that, the Moving Average Convergence Divergence (MACD) histogram prints rising green bars for the first time since mid-March, signaling a potential upward momentum.
NZD/USD daily chart
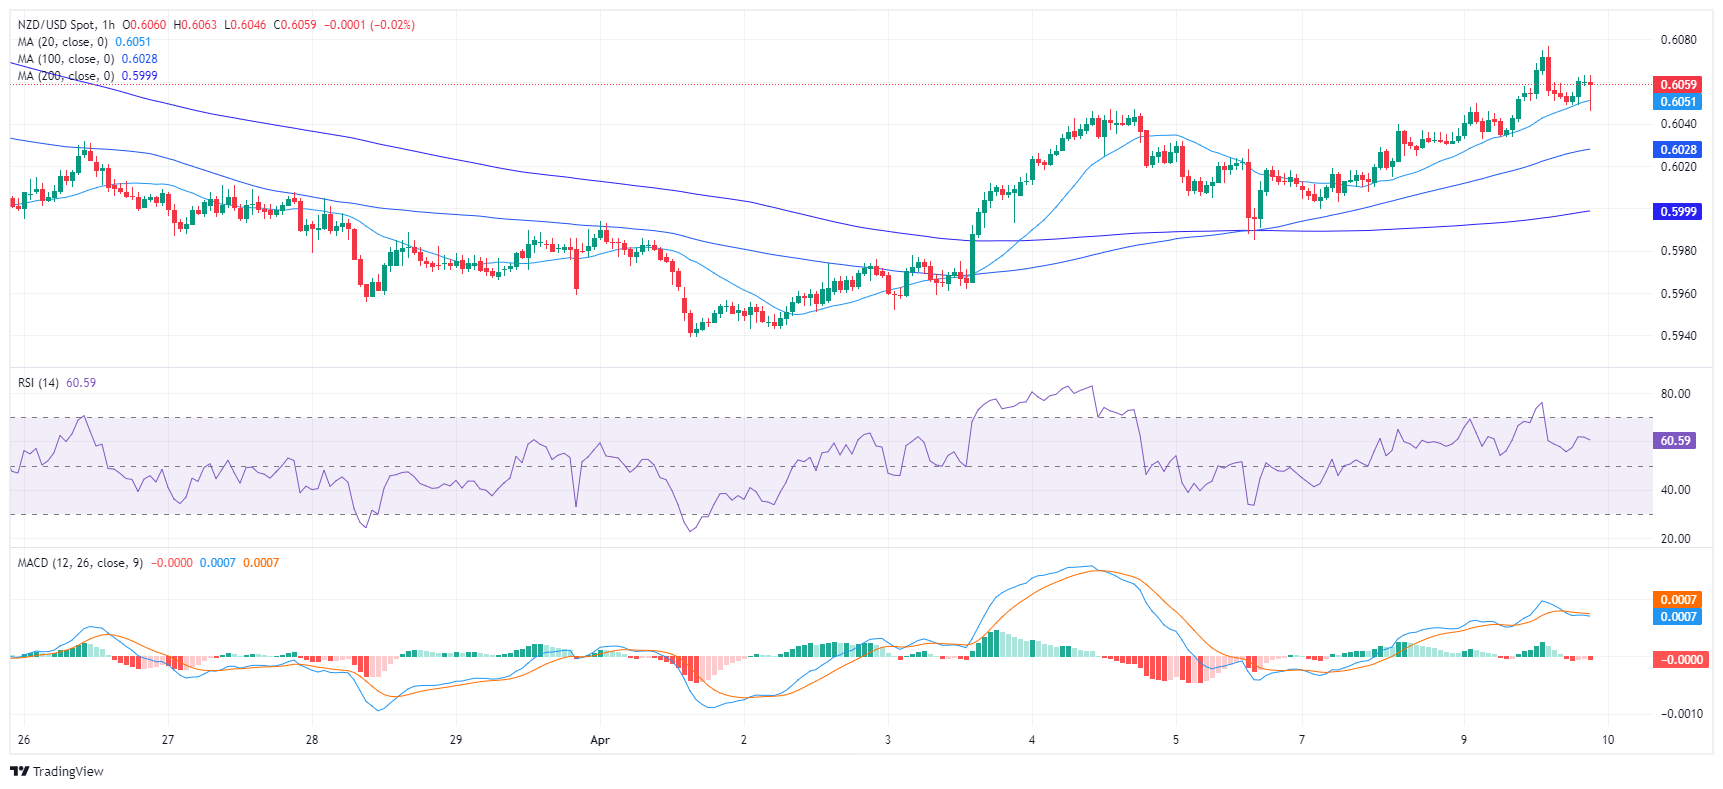
Turning to the hourly chart, the RSI is on the rise, mirroring the trend found on the daily chart. The MACD histogram on the hourly scale is relatively flat but displays red bars, indicating a mild negative momentum, probably hinting that the bulls are taking profits after the RSI hit overbought conditions earlier in the session.
NZD/USD hourly chart
Regarding the overall trend, the NZD/USD has demonstrated a significant jump above its 20-day Simple Moving Average (SMA), suggesting a bullish shift in the short-term outlook. This development indicates that the pair has found some near-term buying strength. However, it continues to be positioned below both the 100 and 200-day SMA, implying a long-term bearish stance. Further to this, the pair was recently rejected by its 100-day SMA at 0.6138, suggesting a reinforced resistance at this level. A sustained move above this level would be required to alter the overall bearish bias.
-
09.04.2024 11:24NZD/USD Price Analysis: Jumps to 0.6050 ahead of RBNZ monetary policy, US Inflation data
- NZD/USD advances to 0.6050 as the appeal for risky assets improves.
- The RBNZ is expected to hold the OCR steady at 5.5%.
- US inflation data for March will guide market expectations for Fed rate cuts.
The NZD/USD pair climbs to more than a two-week high near 0.6055 in Tuesday’s London session. The Kiwi asset soars as an appeal for risk-sensitive assets improves despite uncertainty ahead of the United States Consumer Price Index (CPI) data for March, which will be published on Wednesday.
S&P 500 futures have posted decent gains in the London session, portraying demand for risk-perceived assets. 10-year US Treasury yields correct to 4.40%. The US Dollar falls to 104.00.
According to economists, monthly headline and core inflation data are projected to have increased by 0.3%, higher than the pace of 0.17%, which is required for inflation to return to the 2% target. Traders would be wary of betting big on the Federal Reserve (Fed) to begin reducing interest rates from the June meeting if the inflation data remains hotter than anticipated.
Meanwhile, the New Zealand Dollar strengthens ahead of the Reserve Bank of New Zealand’s (RBNZ) interest rate decision, which will be announced on Wednesday. The RBNZ is widely expected to keep its Official Cash Rate (OCR) unchanged at 5.5%. Therefore, the next move in the New Zealand Dollar will be guided by a fresh interest rate outlook from RBNZ policymakers.
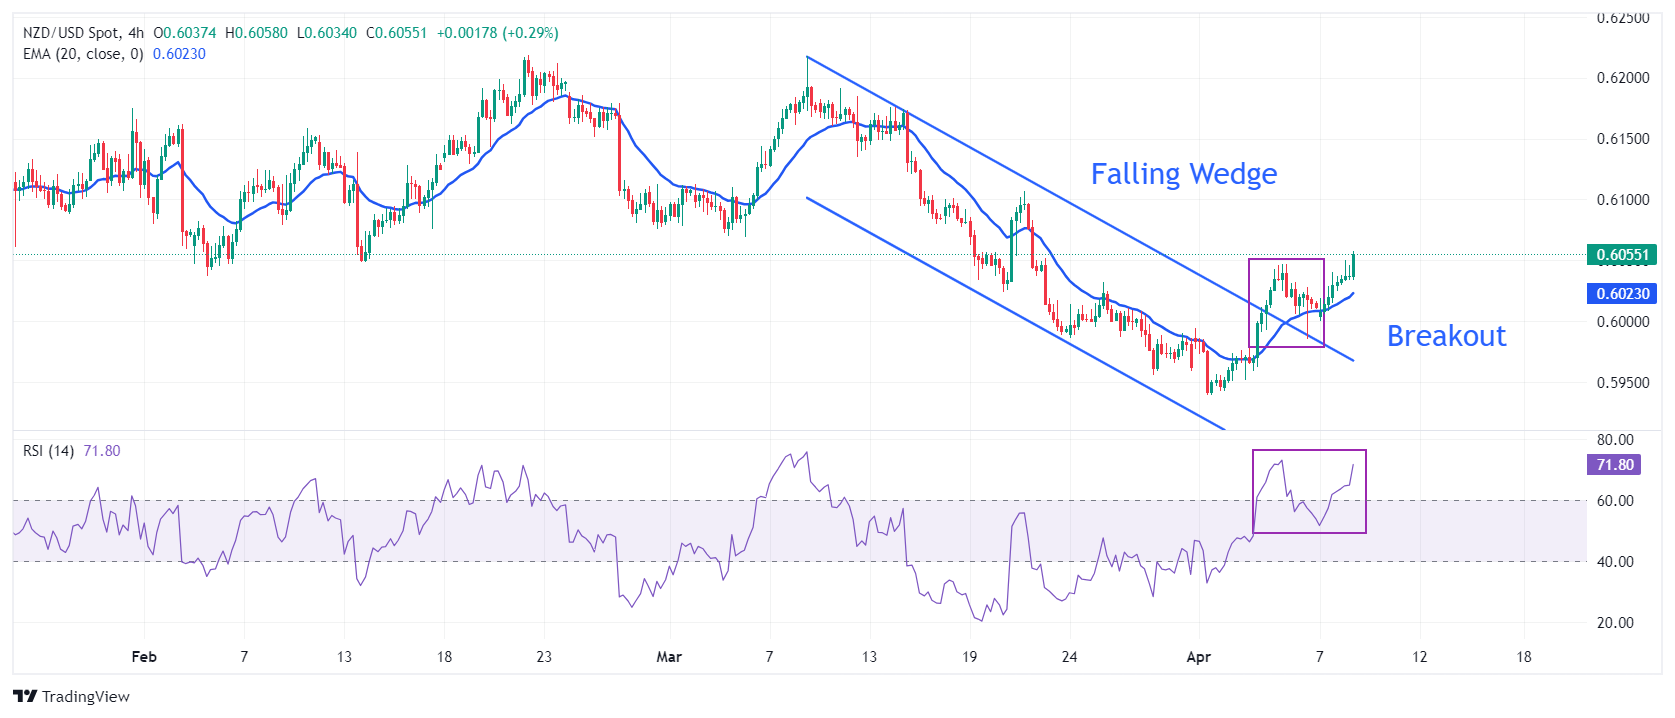
NZD/USD delivers a sharp upside after a breakout of the Falling Wedge pattern formed on a four-hour timeframe. A breakout of the aforementioned pattern suggests a bullish reversal, which exposes the asset to more upside.
The near-term demand turns bullish as the 20-period Exponential Moving Average (EMA) at 0.6023 slops higher.
The 14-period Relative Strength Index (RSI) shifts into the bullish range of 60.00-80.00, indicating a strong bullish momentum.
Further upside above March 6 low at 0.6069 will drive the pair toward March 18 high at 0.6100. A breach of the latter will drive the asset further to March 12 low at 0.6135.
In an alternate scenario, a downside move would appear if the asset breaks below April 5 low of 0.5985. This would drag the asset toward November 17 low at 0.5940, followed by the round-level support of 0.5900.
NZD/USD four-hour chart
-
09.04.2024 04:08NZD/USD pares gains after weaker NZIER Business Confidence, stays near 0.6040
- NZD/USD faces struggles on contracted business outlook in New Zealand.
- RBNZ is anticipated to maintain cash rates at 5.5% for the sixth consecutive meeting on Wednesday.
- Headline US CPI could show an increase in March while the core measure is anticipated to cool down.
NZD/USD retains its position in positive territory, although it has trimmed some intraday gains, following the release of weaker Business Confidence data from New Zealand on Tuesday. At the time of writing, the pair trades near 0.6040 during the Asian session.
The NZIER Business Confidence (quarter-over-quarter) indicated a 25% contraction in the business outlook in New Zealand for the first quarter of 2024, compared to a 2% decline in the previous quarter. Additionally, the Reserve Bank of New Zealand (RBNZ) is scheduled to hold its monetary policy meeting on Wednesday.
The RBNZ is anticipated to maintain cash rates at 5.5% for the sixth consecutive meeting and emphasize the necessity to remain restrictive for a while longer to curb inflation. In February, the board indicated it would refrain from easing policy until 2025, citing worries about record immigration.
The NZD/USD pair saw gains as risk appetite improved ahead of the upcoming release of Consumer Price Index (CPI) data from the United States (US) scheduled for Wednesday. The CPI report is expected to show an acceleration in headline CPI for March while the core measure is anticipated to cool down. However, the US Dollar (USD) strives to recover its recent losses amidst market volatility.
Support for the US Dollar could stem from remarks by Federal Reserve (Fed) Bank of Minneapolis President Neel Kashkari, who emphasized the importance of bringing down the current inflation rate of around 3% to the target level of 2%.


© 2000-2024. All rights reserved.
This site is managed by Teletrade D.J. LLC 2351 LLC 2022 (Euro House, Richmond Hill Road, Kingstown, VC0100, St. Vincent and the Grenadines).
The information on this website is for informational purposes only and does not constitute any investment advice.
The company does not serve or provide services to customers who are residents of the US, Canada, Iran, The Democratic People's Republic of Korea, Yemen and FATF blacklisted countries.
Making transactions on financial markets with marginal financial instruments opens up wide possibilities and allows investors who are willing to take risks to earn high profits, carrying a potentially high risk of losses at the same time. Therefore you should responsibly approach the issue of choosing the appropriate investment strategy, taking the available resources into account, before starting trading.
Use of the information: full or partial use of materials from this website must always be referenced to TeleTrade as the source of information. Use of the materials on the Internet must be accompanied by a hyperlink to teletrade.org. Automatic import of materials and information from this website is prohibited.
Please contact our PR department if you have any questions or need assistance at pr@teletrade.global.
transfers