- Analytics
- News and Tools
- Quotes
- Chart and quotes for EURJPY
CFD Trading Rate Euro vs Japanese Yen (EURJPY)
| Date | Rate | Change |
|---|
Related news
-
18.04.2024 19:23EUR/JPY Price Analysis: Bulls Maintain Control, consolidation phase likely
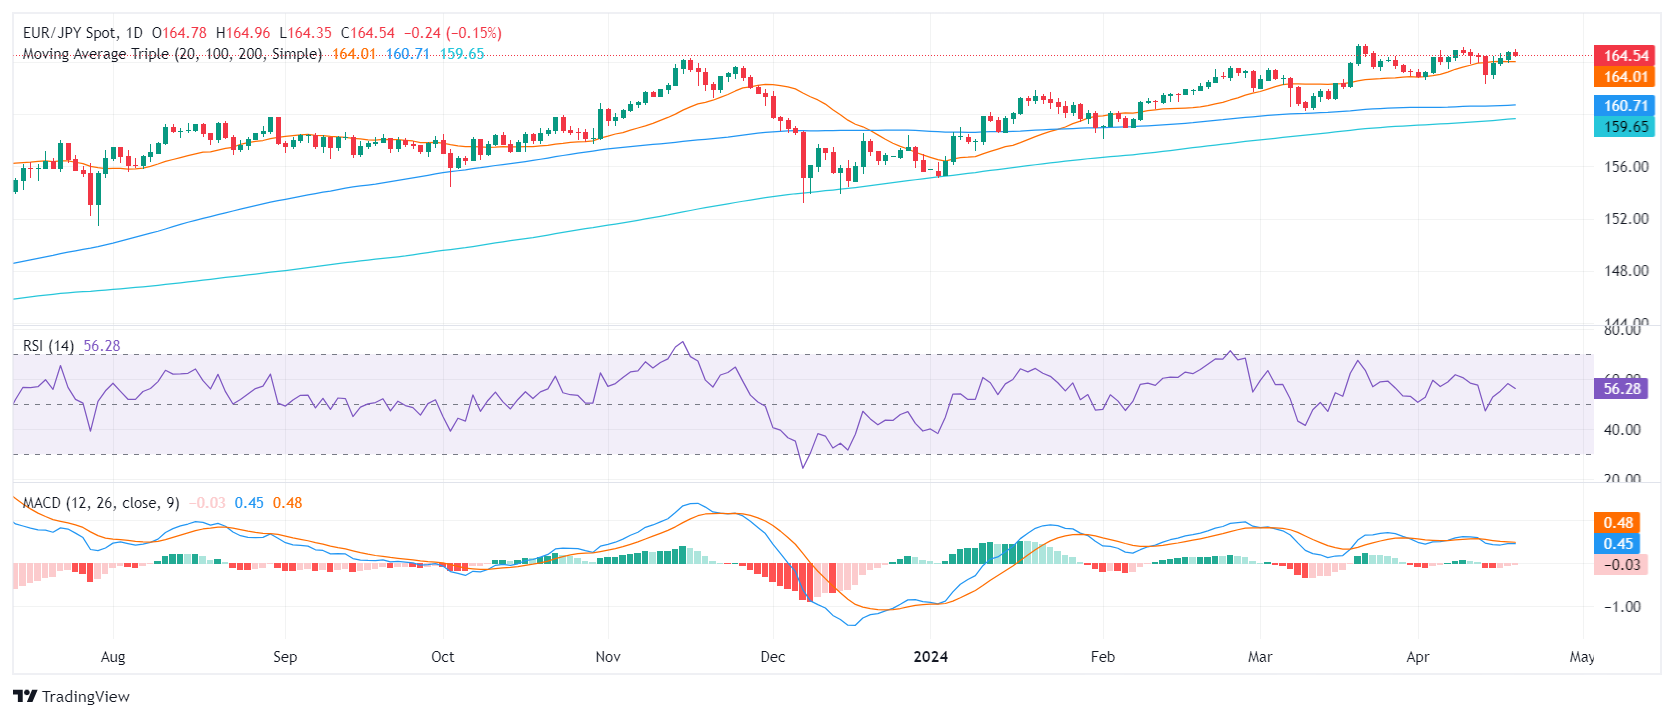
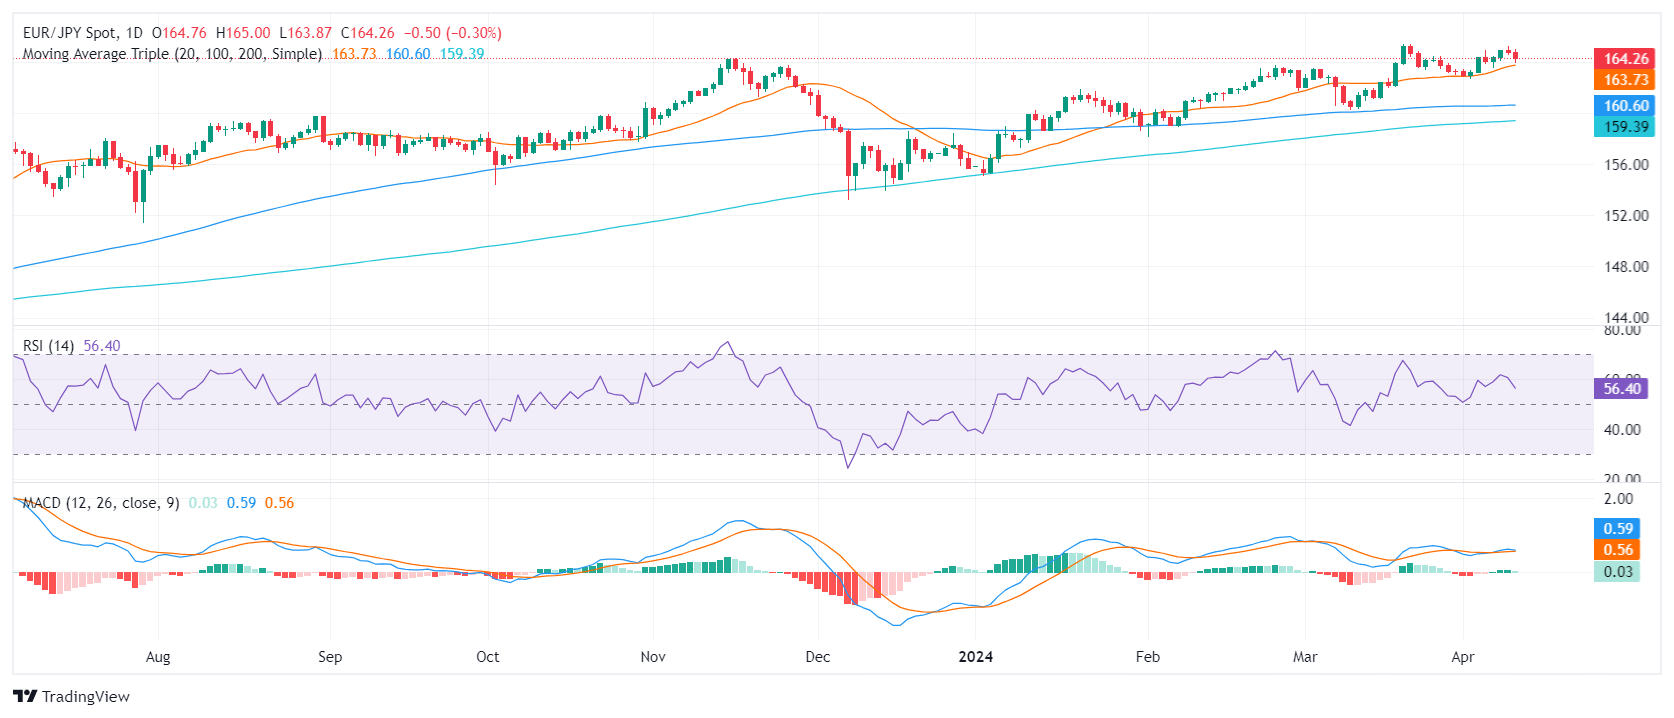
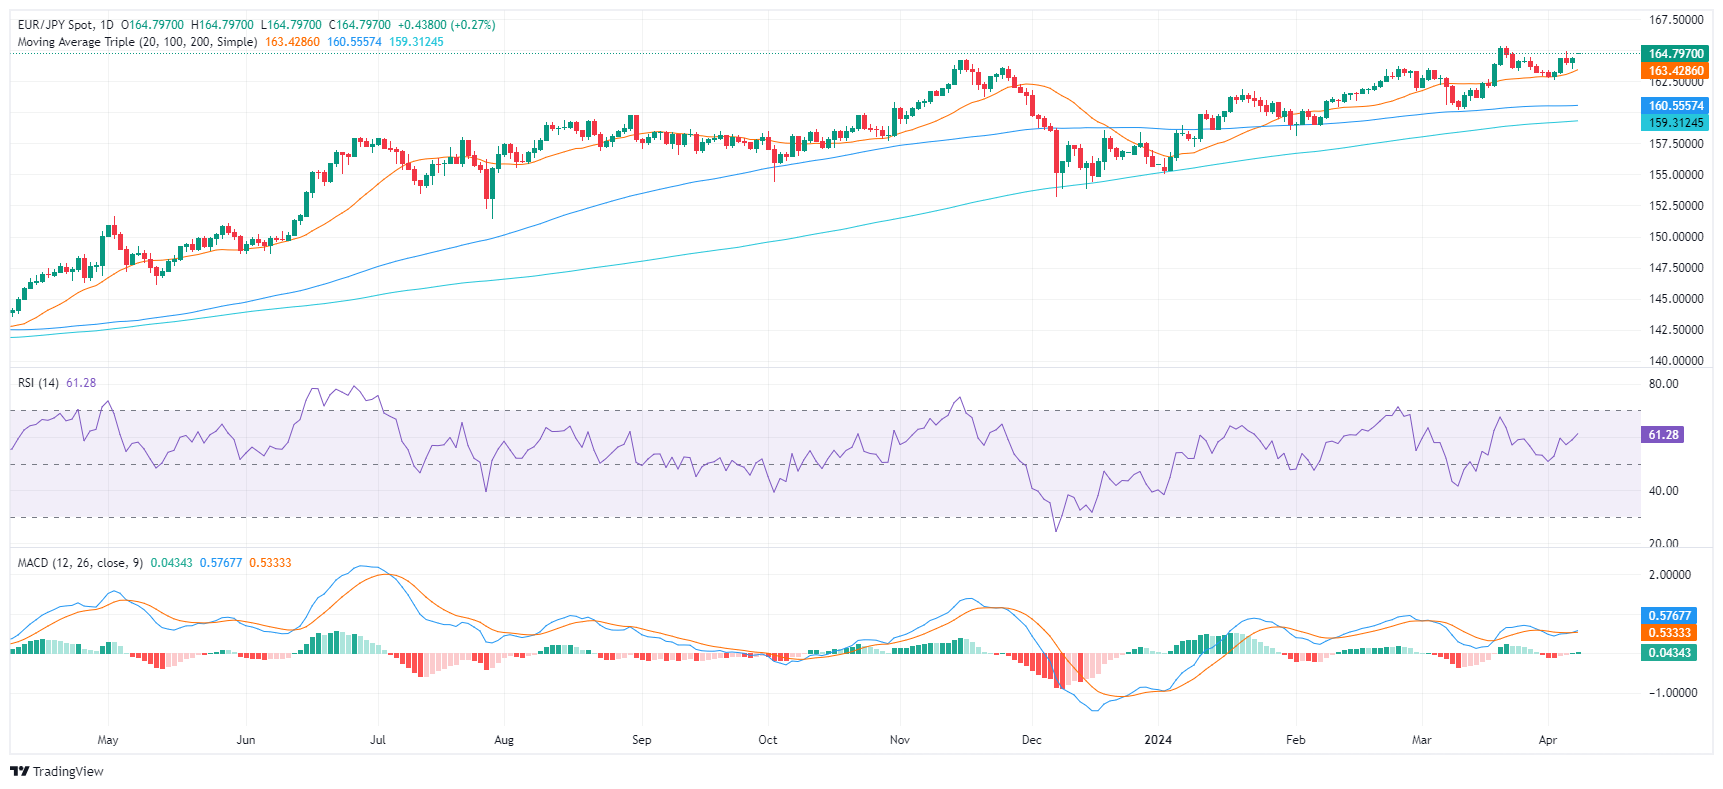
- The RSI on the daily chart of EUR/JPY indicates sustained bullish momentum.
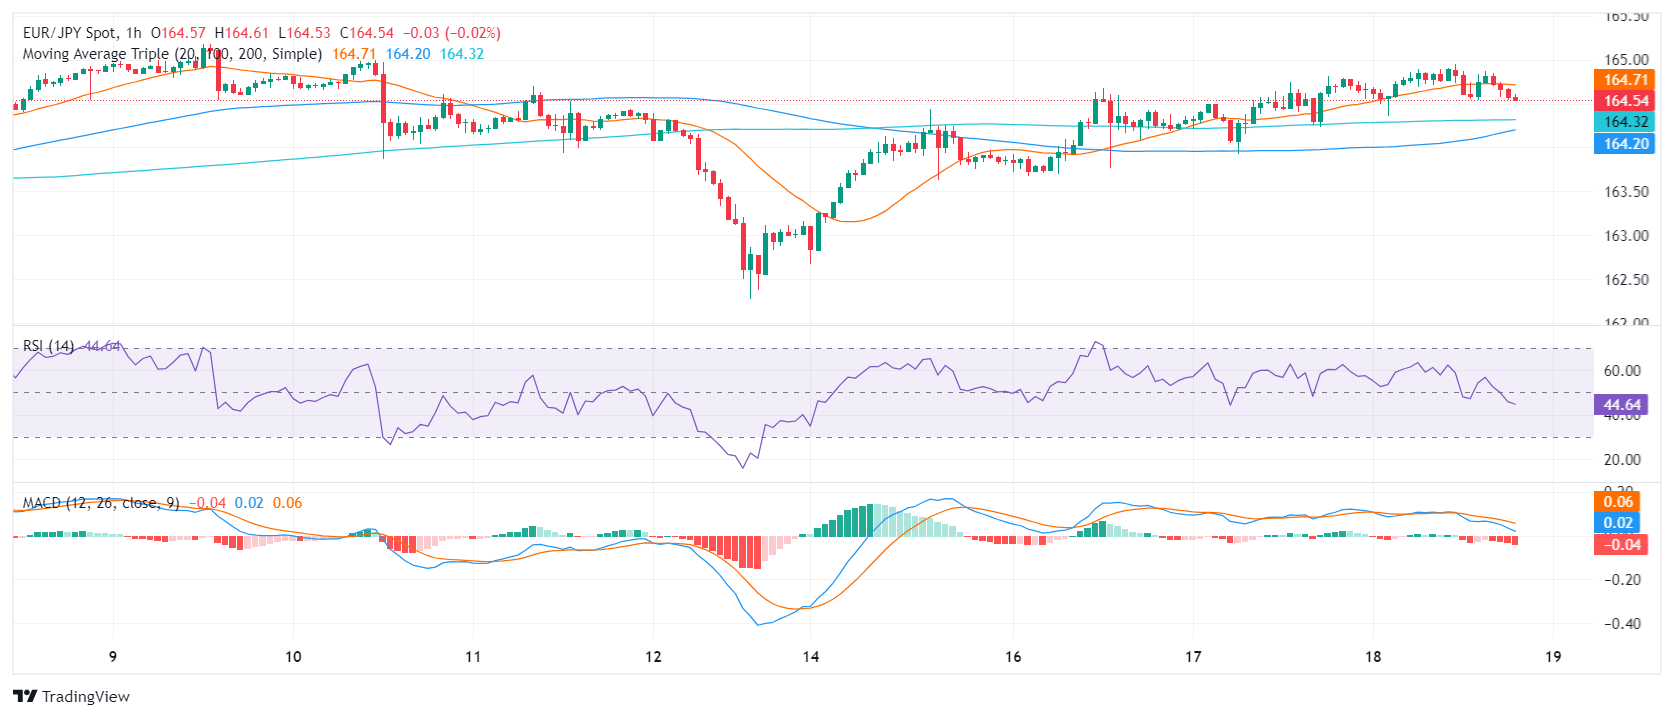
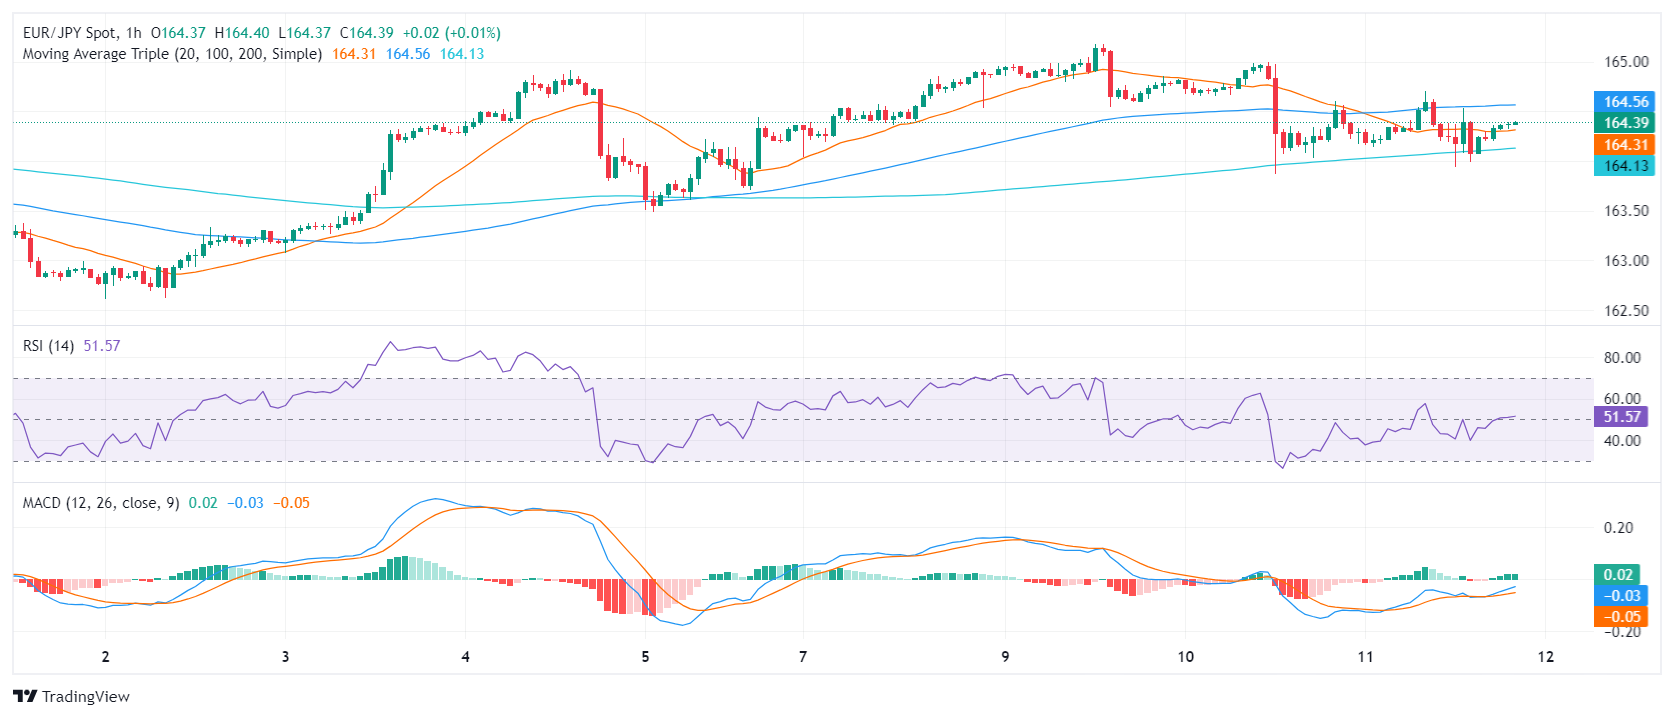
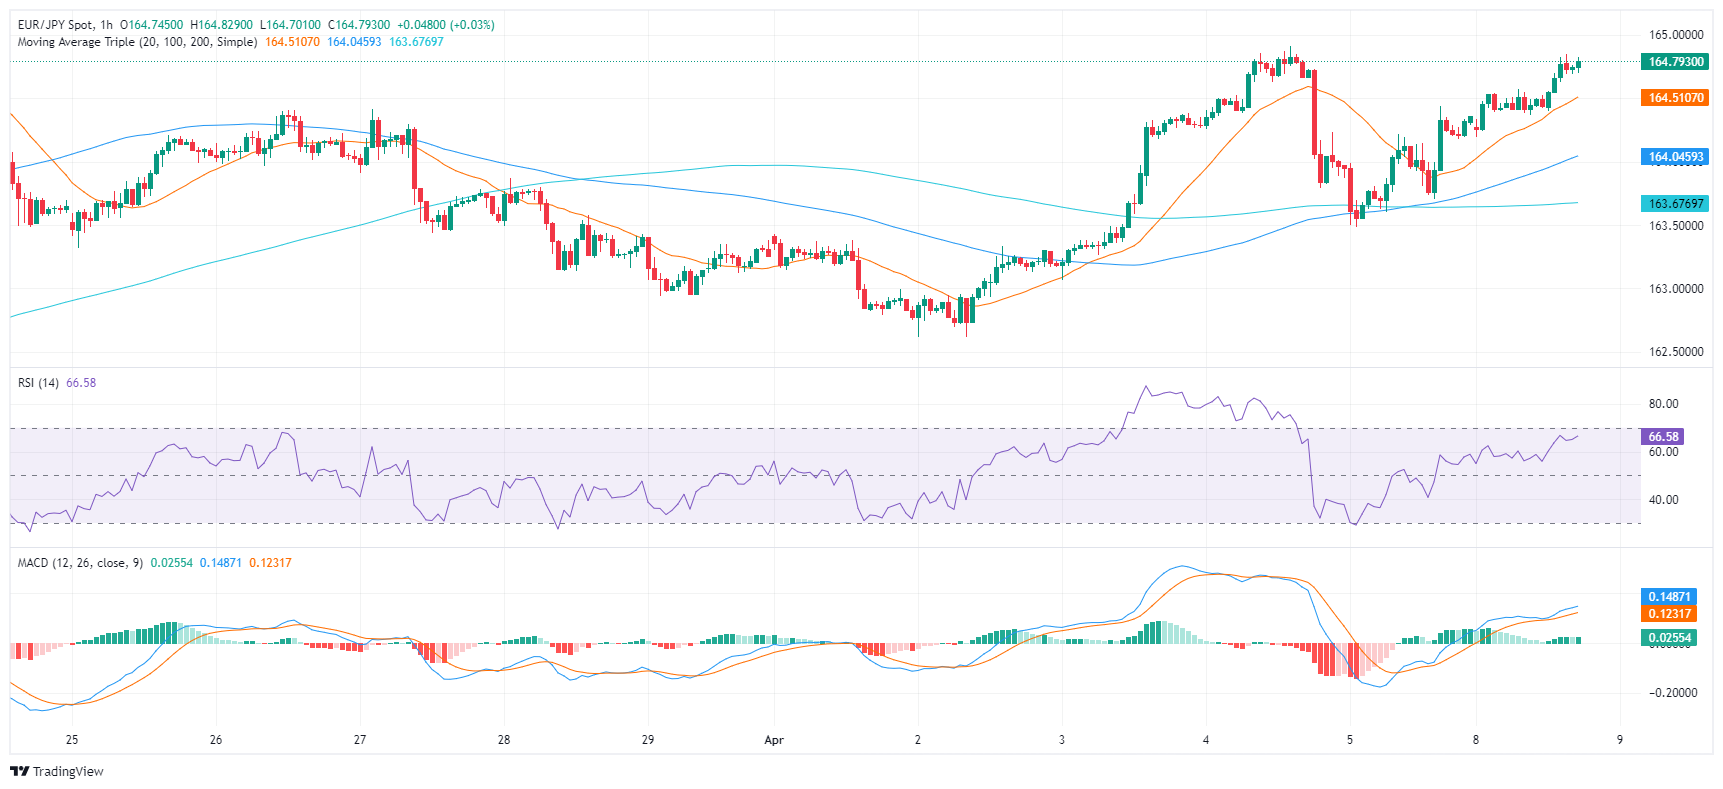
- Hourly chart shows an RSI below its mid-zone and MACD with rising red bars, pointing towards possible consolidation.
- The EUR/JPY's position above main SMAs underscores a strong bullish bias.
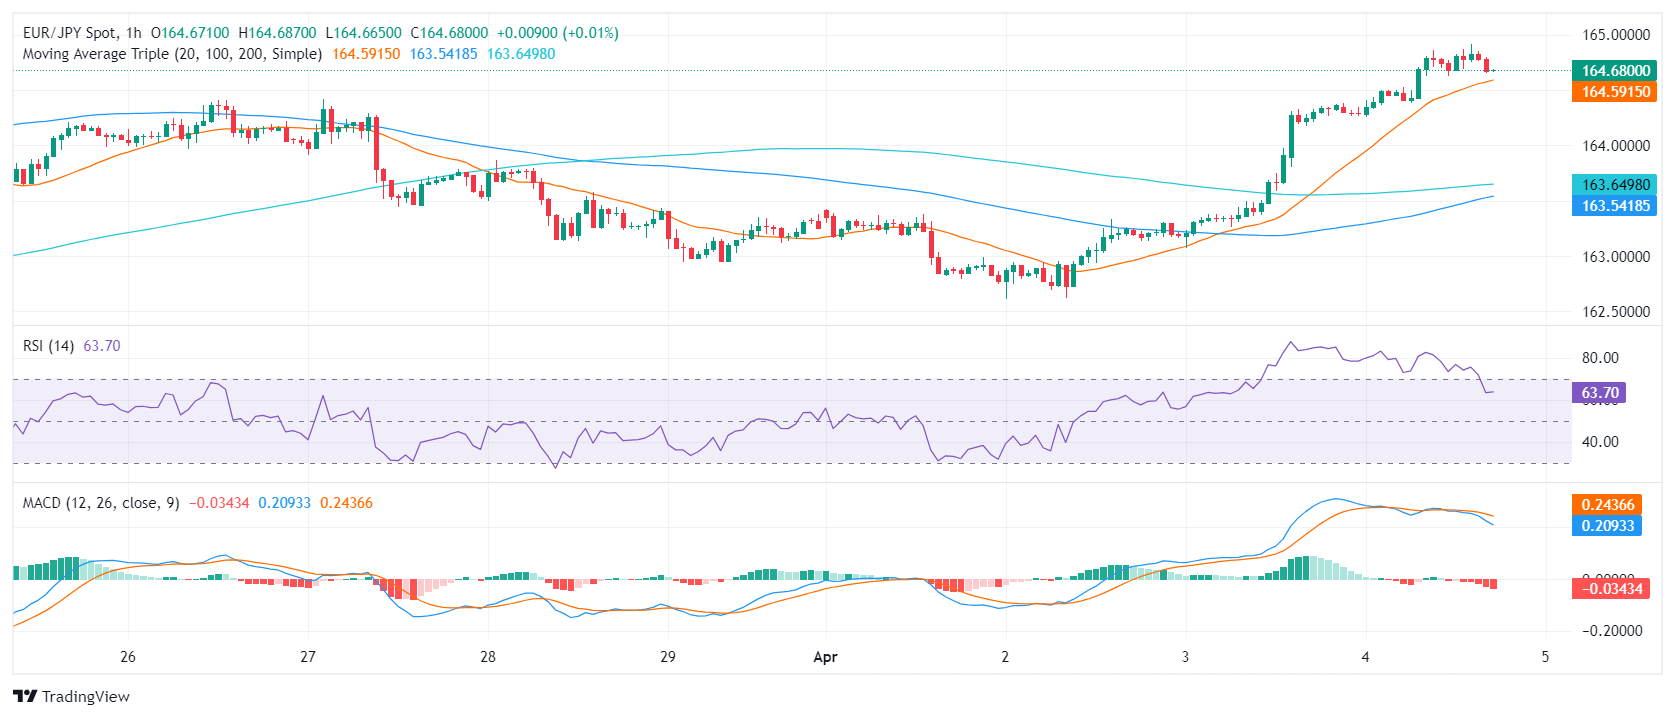
The EUR/JPY slightly declined to 164.70 in Thursday’s session. That being said, the overall trend still favors the bulls but a consolidation phase, suggested by bears dominating the hourly chart, may create a balanced playing field for both buyers and sellers ahead of the Asian session.
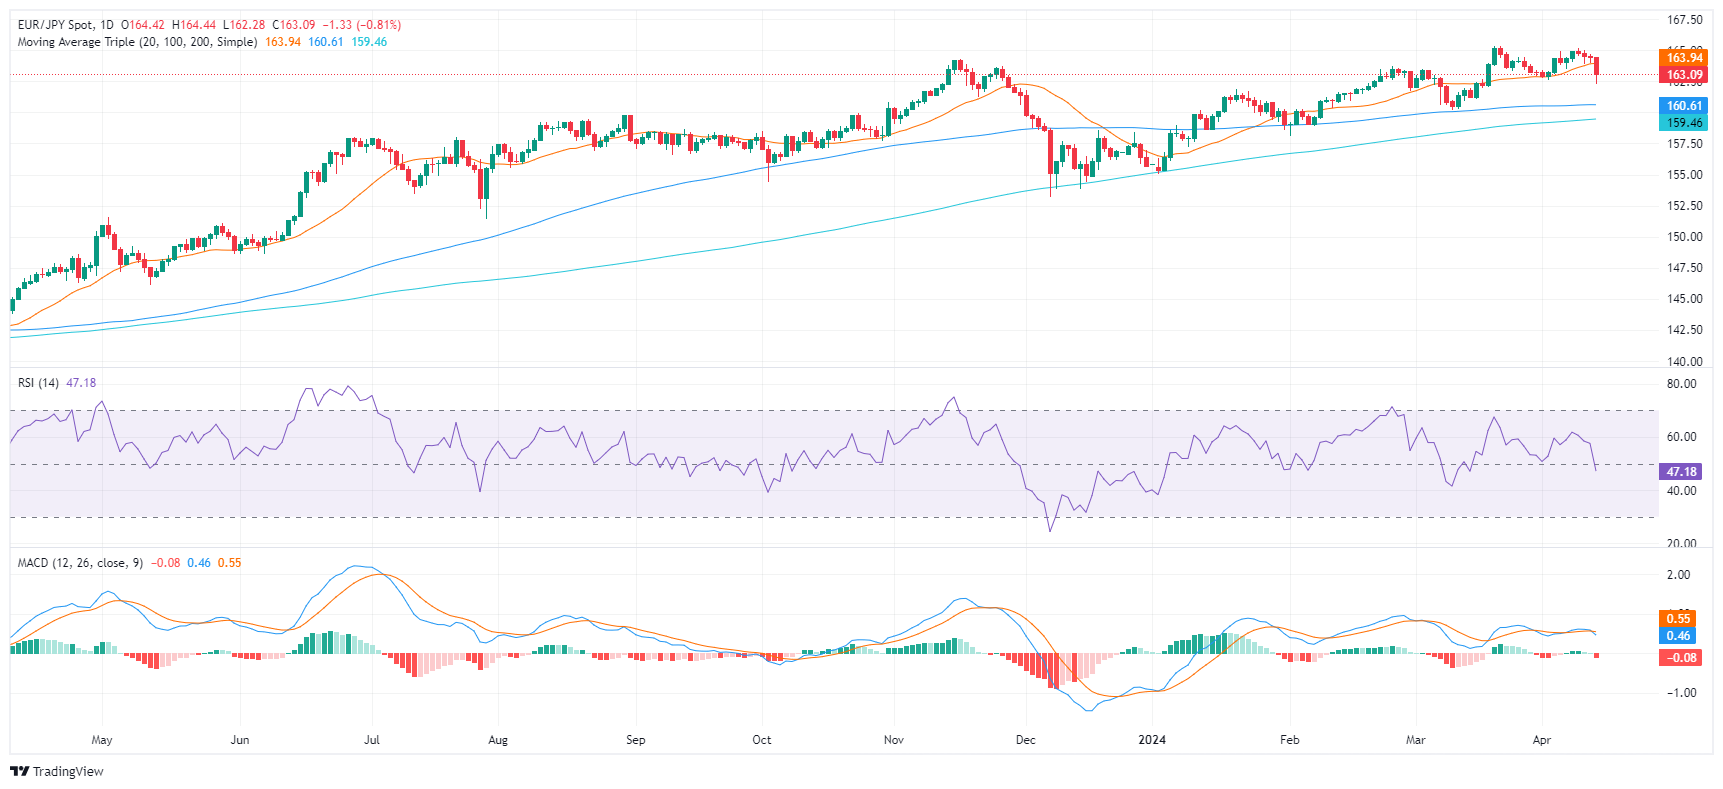
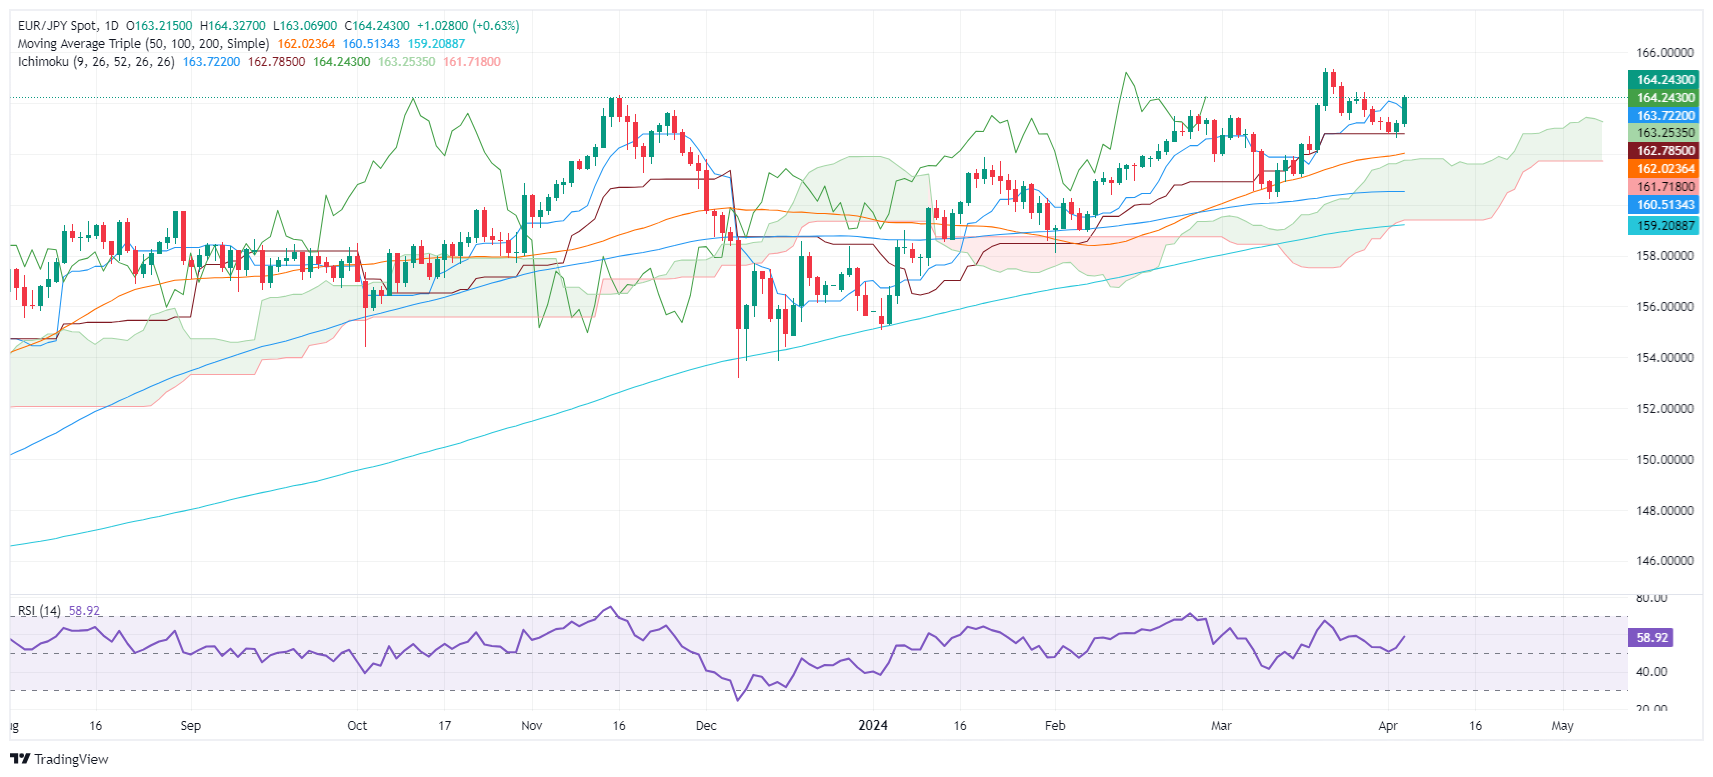
On the daily chart, the Relative Strength Index (RSI) for the EUR/JPY pair is in positive territory, with a most recent reading of 58. This suggests that the pair's upsurge might remain intact as long as the RSI stays above the 50 mark, indicating that buyers are in control at this moment.
EUR/JPY daily chart
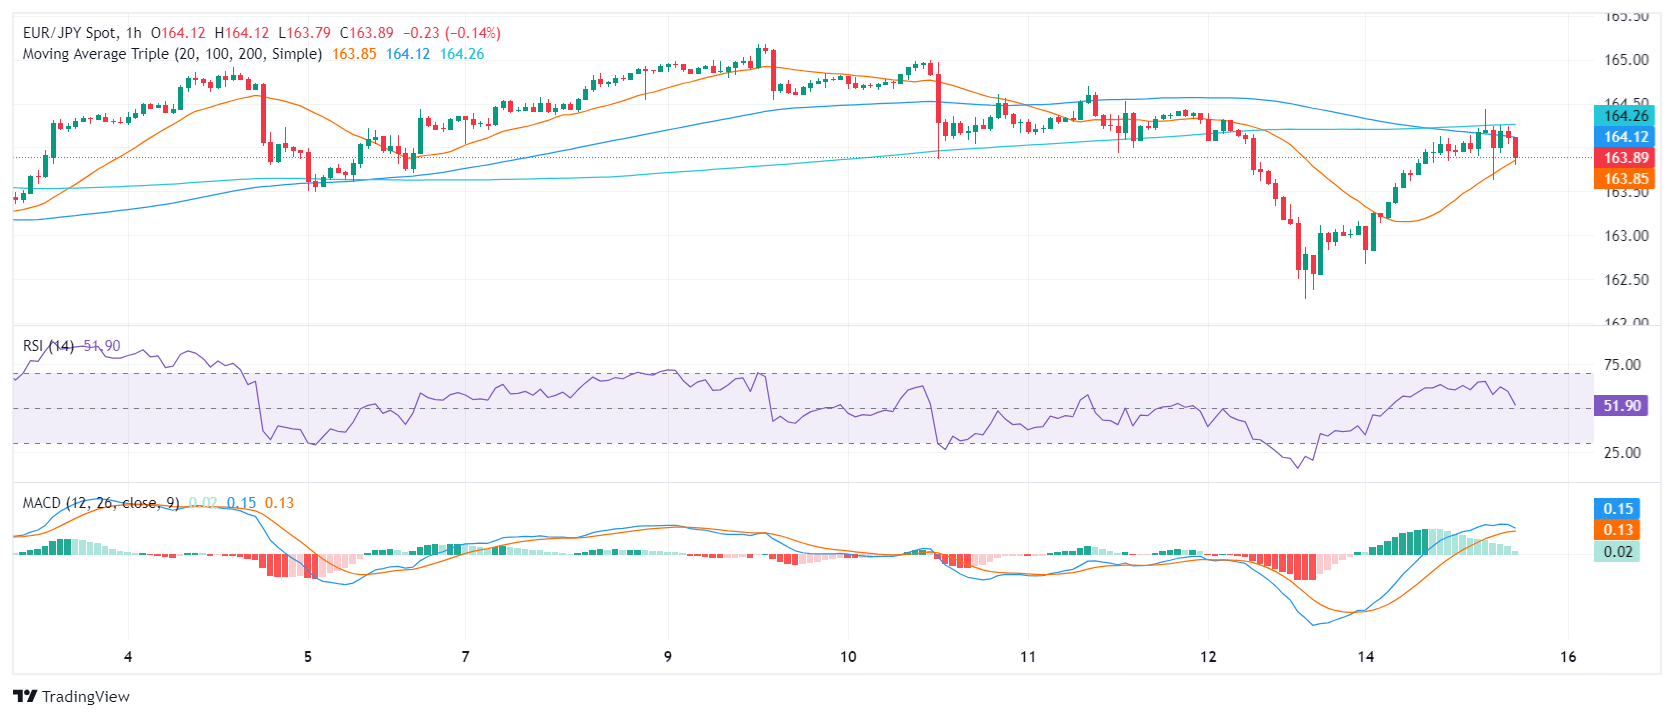
Meanwhile, on the hourly chart, the EUR/JPY's RSI declined below its middle zone, with the latest reading of 44 as of the last hour. This could point towards a pending period of consolidation. The Moving Average Convergence Divergence (MACD) displays rising red bars, also hinting at a temporary slowdown in the bullish momentum.
EUR/JPY hourly chart
Regarding the Simple Moving Average (SMA), the cross EUR/JPY holds strong above its 20, 100, and 200-day SMAs, indicating a bullish stance. That being said the pair must defend the 20-day SMA at 164.00 which is a strong support to maintain the positive short-term outlook.
-
17.04.2024 11:36EUR/JPY continues higher after Eurozone inflation data keeps in line
- EUR/JPY continues rising after the release of final Eurozone inflation data shows no change from estimates.
- Comments from the Japanese Cabinet Secretary suggest the authorities may be close to an FX market intervention.
- Further commentary from ECB speakers could cause fluctuations for EUR/JPY.
The EUR/JPY is trading in the mid 164.00s on Wednesday, up by over a tenth of a percent. The pair’s fluctuations seem to have been mainly driven by a combination of Eurozone inflation data and comments from a Japanese government official designed to support the Japanese Yen (JPY).
EUR/JPY rose following the release of the final figure for March Eurozone Harmonized Index of Consumer Prices (HICP) by Eurostat. The final estimate showed no change from the initial release, which showed a 2.4% YoY rise in HICP and 2.9% in core HICP. This also meant both readings were still below the 2.6% and 3.1% readings respectively of the previous month.
Whilst the data showed no change, the Euro (EUR) rose in most pairs following the release, perhaps because market expectations had fallen. Recent dovish comments from European Central Bank (ECB) officials, have suggested an increasing willingness to cut interest rates because of falling inflation and stuttering growth, and this could have been responsible for the lower outlook.
On Tuesday, for example, ECB President Christine Lagarde said that the ECB will cut rates soon, bar a surprise, and that the ECB was keeping a close eye on Oil prices due to tensions in the Middle East.
EUR/JPY upside has likely been tempered by comments from Japan’s Chief Cabinet Secretary Yishimasa Hayashi, who issued a verbal intervention on Wednesday to prop up the Yen. Hayashi said that “we are closely watching FX moves” and are “prepared for full measures.”
This may indicate the Japanese authorities are seriously considering a direct intervention in FX markets in which they would sell their FX reserves to buy JPY in the hope of strengthening it. The knock-on effect of such an intervention, though felt most keenly in USD/JPY, would probably result in a weakening in the EUR/JPY pair.
His intervention may have come on the back of recent comments from Federal Reserve Chairman Jerome Powell, in which he said “Recent data shows a lack of further progress on inflation this year,” adding, “If higher inflation persists the Fed can maintain current rate as long as needed.”
His comments led to an appreciation of the US Dollar because the maintenance of higher interest rates tends to be positive for a currency. This is due to the fact that it increases foreign capital inflows. Powell’s remarks resulted in USD/JPY rising to above 154.00. This is above the ideal 150.00 threshold beyond which the Japanese do not like to see their currency devalue.
A string of speeches by key ECB members during Wednesday, including ECB Executive Board Member Piero Cipollone, ECB Executive Board Member Isabel Schnabel and President Christine Lagarde herself could also impact the EUR/JPY’s volatility.
The release of Japanese trade data overnight had little effect on the exchange rate. The data showed only a slight moderation in Exports, which continued to grow by above 7.0% year-on-year in March, a fall in Imports by 4.9% (after a 0.5% rise in the preceding month), and a surplus trade balance of ¥366.5 billion from a ¥377.8 billion deficit in February.
-
16.04.2024 17:50EUR/JPY Price Analysis: Bulls make a stride and reclaim the 20-day SMA
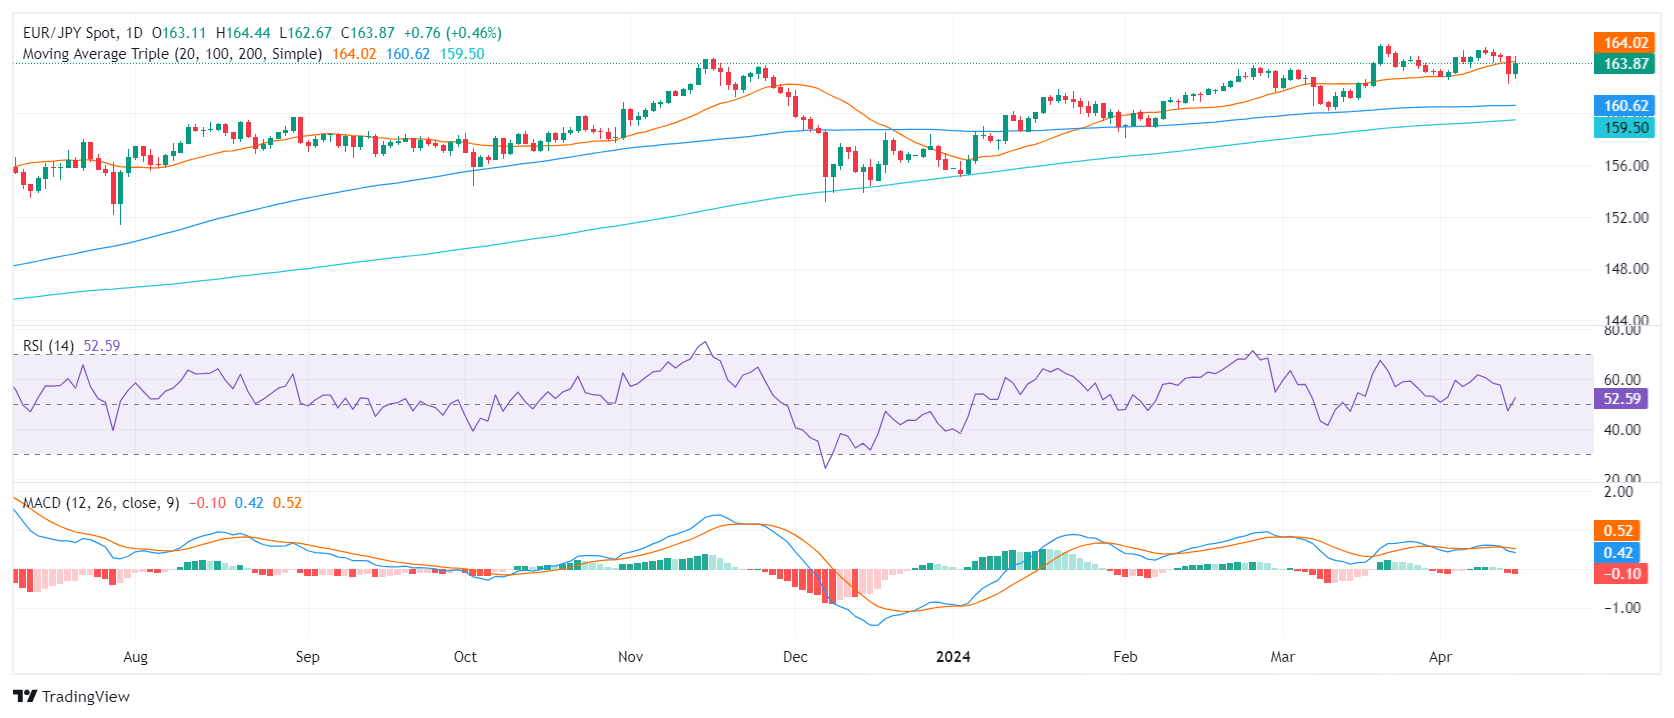
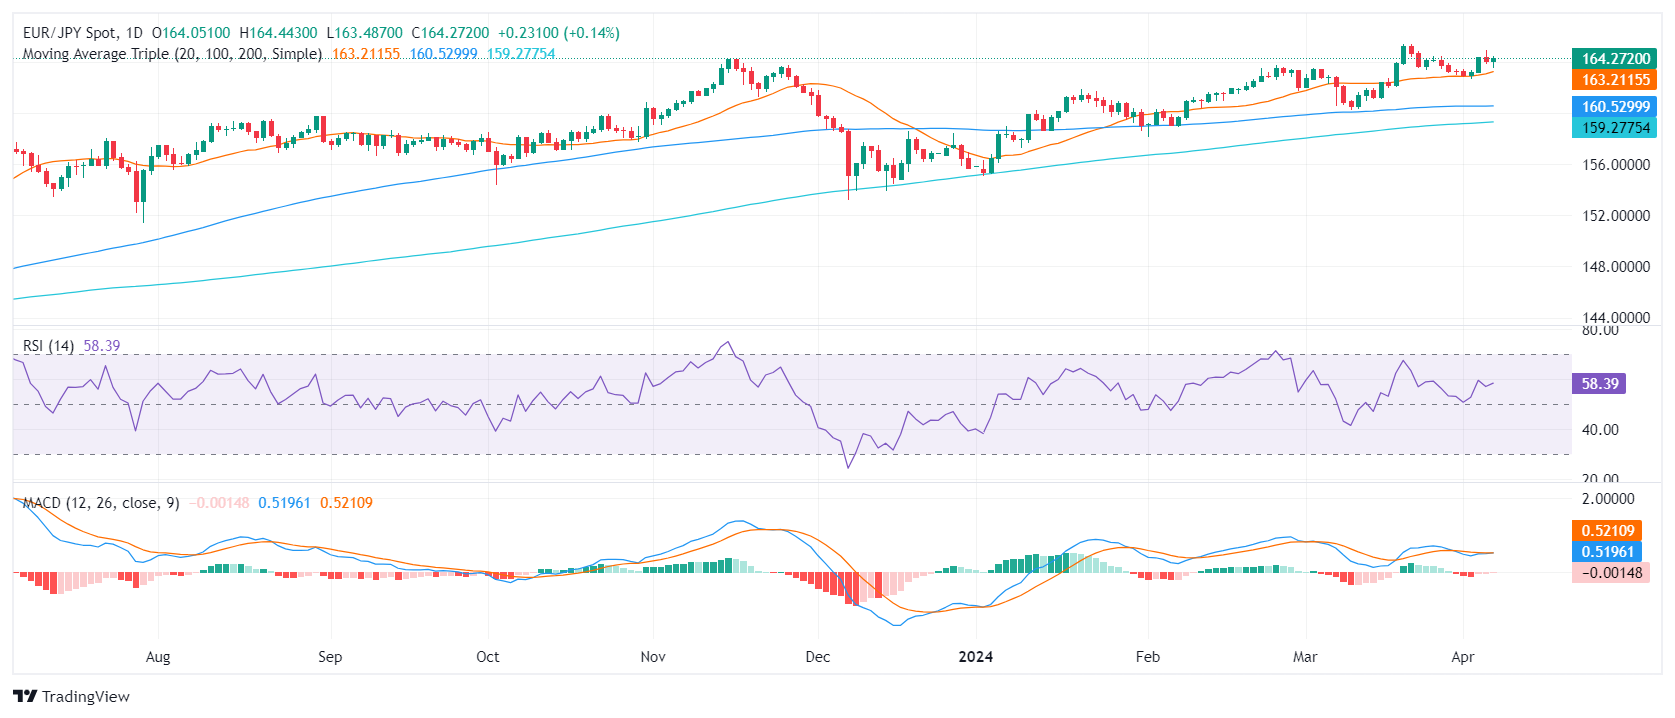
- The daily chart reveals that the EUR/JPY maintains a bullish sentiment, as indicated by the rising RSI and diminishing negative momentum via MACD.
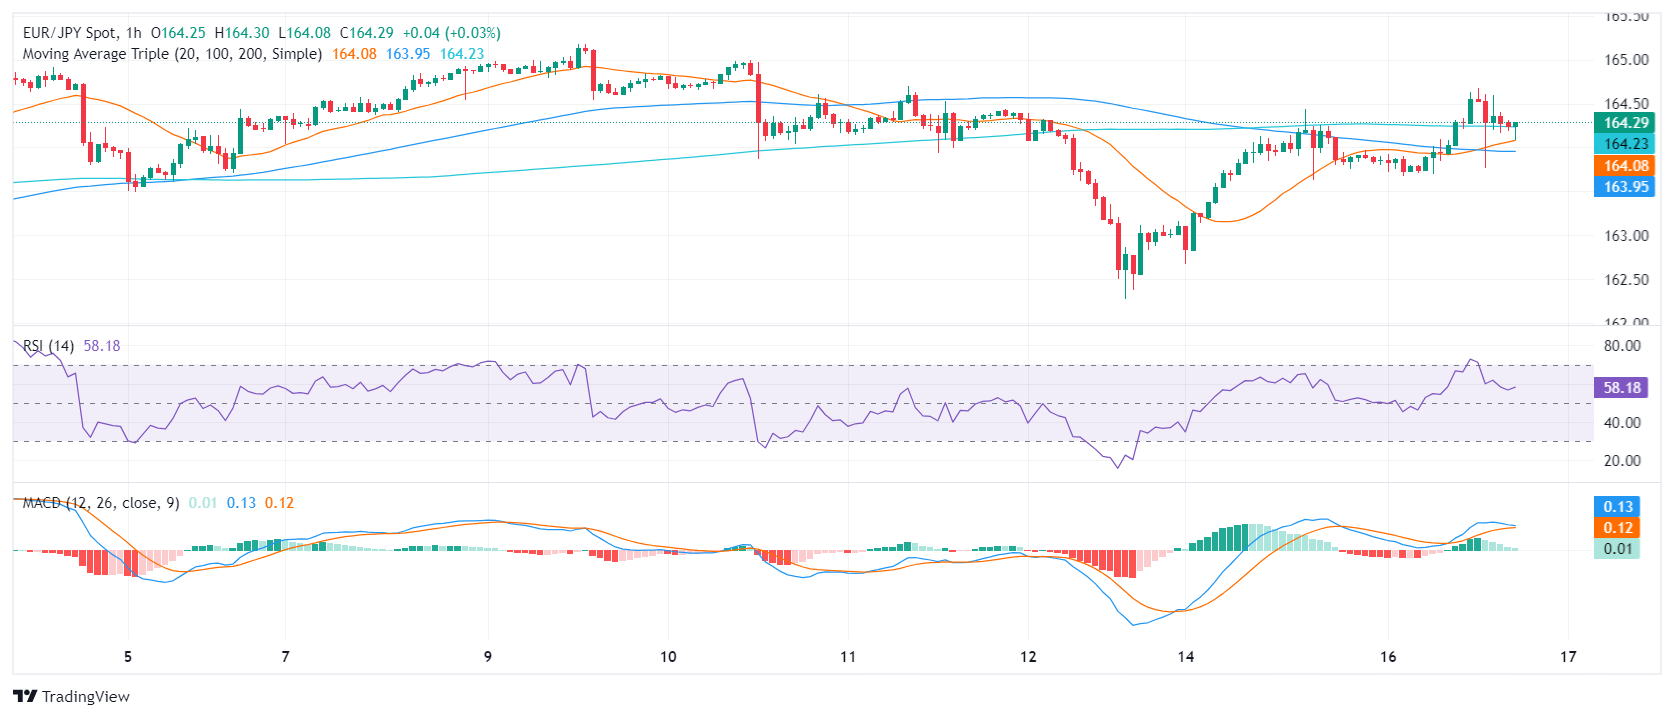
- The hourly chart's RSI shows that the pair is correcting overbought conditions.
The EUR/JPY pair is trading at 164.22, recording a slight uptick on Tuesday’s session. This slight appreciation points towards a continuing strength of the Euro against the Japanese Yen. Despite minor market fluctuations suggesting temporary corrections, the broader technical outlook remains largely bullish. To reinforce this, bulls stepped in and recovered the 20-day Simple Moving Average (SMA) which brightened the outlook for the buyers.
The daily chart reveals that the EUR/JPY pair maintains a bullish momentum, indicated by its Relative Strength Index (RSI) standing at 55, comfortably within the positive trend zone. This is supported by the falling red bars of the Moving Average Convergence Divergence (MACD) histogram, which demonstrates diminishing negative momentum.
EUR/JPY daily chart

Moving to the hourly chart, recent RSI readings oscillate between 71 and 54, suggesting the buyers are taking a quick breather. In addition, the relatively flat green bars of the hourly MACD indicate a nearly stagnant positive momentum.
EUR/JPY hourly chart
The broader outlook of the EUR/JPY based on its position relative to the Simple Moving Average (SMA) provides more insight. The EUR/JPY jump above the 20-day SMA today may signal a sharp short-term uptick, suggesting buy opportunities for traders. Moreover, its position above both the 100-day and 200-day SMA confirms a long-term bullish trend, implying that the Euro retains its strength against the Japanese Yen.
-
15.04.2024 18:03EUR/JPY Price Analysis: Mildly bullish sentiment persists, bears present
- The daily EUR/JPY chart reveals a cautiously optimistic tone, despite a somewhat weakened RSI.
- Indicators on the hourly chart also suggest weakening buying momentum.
- If bulls fail to recapture the 20-day SMA, additional downside may be incoming.
The EUR/JPY pair is currently trading at 163.80, indicating a rise of 0.46%. The cross maintains a positive long-term outlook, despite the short-term bearish impulses from sellers which breached through the 20-day Simple Moving Average (SMA). For the session, bulls seem to have already given all as indicators lose traction in the shorter timeframes.
The latest daily EUR/JPY chart session has shown a Relative Strength Index (RSI) in the positive territory, reflecting a mildly bullish sentiment. However, the fluctuating RSI observed in the last sessions and the recent dip into the negative territory suggests that bears are gearing up. Concurrently, the Moving Average Convergence Divergence (MACD) histogram reveals an uptrend with rising red bars, highlighting bearish momentum.
EUR/JPY daily chart
Turning to the hourly EUR/JPY chart, the RSI appears predominantly positive with a current reading of 57 but points downwards. The MACD Histogram on this timeframe shows diminishing green bars, further indicating lessening bullish momentum.
EUR/JPY hourly chart
From a broader perspective, the EUR/JPY is giving mixed signals. Notably, it has fallen below its 20-day Simple Moving Average (SMA) today which may be seen as a bearish short-term indicator. However, it stays above both its 100-day and 200-day SMAs, suggesting a persisting long-term bullish trend.
In summary, the technical indicators on both the daily and hourly charts present a mixed outlook for the EUR/JPY pair. The short-term bearish signals are juxtaposed with a sustained long-term bullish trend, signifying prospective market volatility. Buyers seem to have made one last stride on Monday, but their momentum is weakening, and unless the buyers regain the 20-day SMA, the outlook might shift in favor of the bears.
-
12.04.2024 18:41EUR/JPY Price Analysis: Bearish sentiment gains sway, 20-day SMA lost
- Increasing bearish pressure is shown by the RSI and MACD of both hourly and daily charts.
- Sellers appear to have control, after gaining the 20-day SMA.
- Buyers need to maintain control over the 100 and 200-day SMAs to prevent further bearish inclination.
The EUR/JPY pair is settling at the 163.00 level, displaying a noteworthy shift favoring the sellers. Although the pair is securely situated above key long-term Simple Moving Averages (SMAs), implying a possible enduring bullish bias, recent indicators suggest a change in the narrative for the short term.
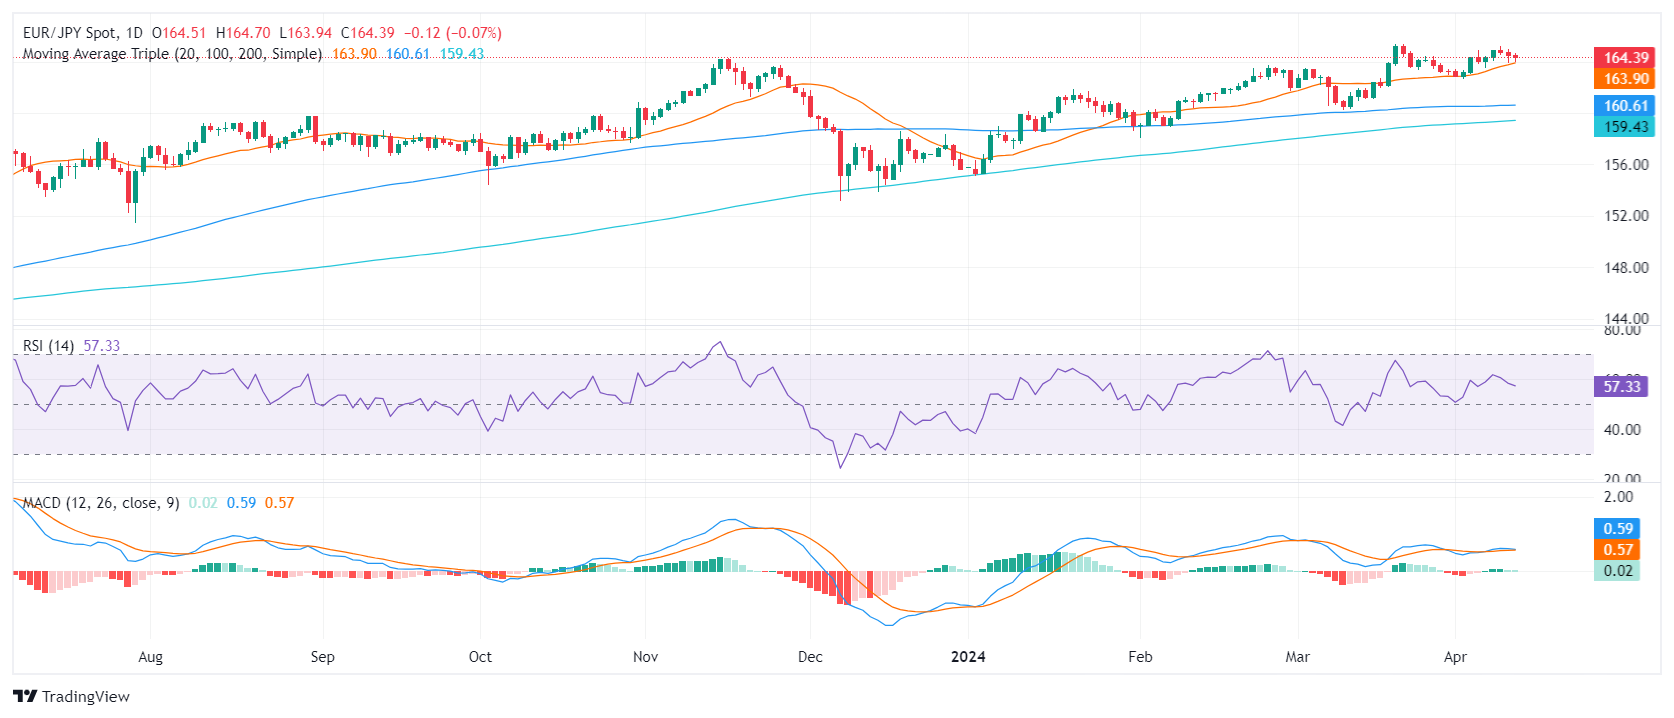
On the daily chart the Relative Strength Index (RSI) indicates a negative trend, having dropped from positive territory to 46. Illustrating this downward trajectory, the Moving Average Convergence Divergence (MACD) also prints red bars, indicating a negative momentum underway.
EUR/JPY daily chart
Switching to the hourly chart, the RSI reveals a similar picture, with the latest reading sitting at 39, reflecting a continuous negative trend. The MACD also prints red bars, carrying the negative momentum from the daily chart to the hourly chart. These indicators, together, could suggest an ongoing bearish pressure for the EUR/JPY throughout the session.
EUR/JPY hourly chart
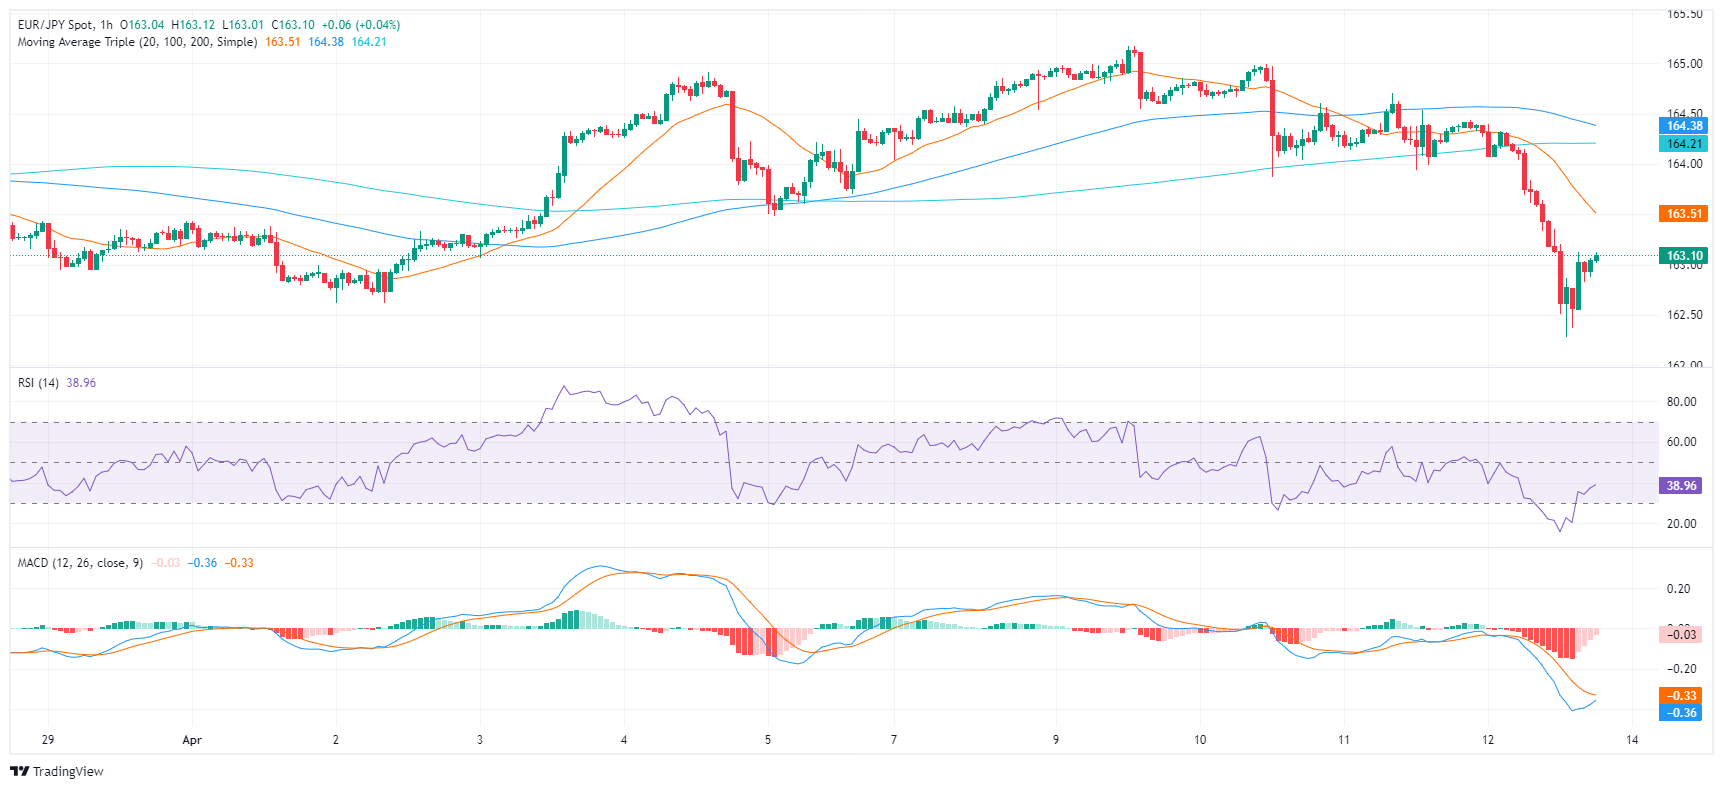
On the broader outlook, the EUR/JPY gives mixed signals from a technical analysis standpoint. On Friday, it fell below the 20-day Simple Moving Average (SMA), hinting at a possible bearish shift in the short-term trend. This could trigger increased selling pressure on the pair with the potential of further losses. Yet, from a broader perspective, the cross stands above both the 100 and 200-day SMA, which leaves a long-term bullish outlook intact.
-
11.04.2024 20:40EUR/JPY Price Analysis: Bullish trend perseveres, bears confronts crucial SMA
- Continued placement of EUR/JPY above key SMA levels shows strong bullish sentiment.
- The daily chart indicators reveal a loss of the bullish momentum.
- The hourly RSI and rising MACD depict short-term buyers' shift to regain momentum.
- The pair's approach towards the key SMA level at 163.09 raises the possibility of a trend shift.
The EUR/JPY pair currently trades at approximately 164.37, indicating a slight decrease. Despite the bullish trend, traders must closely monitor for potential reversals as the bullish momentum wanes on the daily chart and bears approach the 20-day Simple Moving Average (SMA).
On the daily chart, The Relative Strength Index (RSI) consistently has been within the positive territory, but on Thursday it pointed south suggesting a loss of buying traction. The Moving Average Convergence Divergence (MACD) prints diminish green bars, also adding arguments to the momentum loss.
EUR/JPY daily chart
In contrast to the daily chart, the hourly chart tells a slightly different story. Here, the RSI readings fluctuate somewhat, particularly in the latest hours, with a decline towards the negative territory. However, recovery seems likely, as the latest hour reports an RSI value of 51, placing the index back in positive momentum. During these hours, the Moving Average Convergence Divergence (MACD) histogram prints rising green bars, indicating positive momentum.
EUR/JPY hourly chart
For a broader outlook, the EUR/JPY displays significant strength, remaining steadfast above its three crucial Simple Moving Averages (SMA) of 20, 100 and 200-day SMAs. Such positioning generally indicates a sustainable bullish climate, with strong implications for the short and long-term trend. However, today's signals suggest a potential challenge, as the pair edges closer to the 20-day SMA, currently set at 163.09 and any future movement below it could signal a shift to a bearish bias.
-
11.04.2024 09:00EUR/JPY climbs to fresh daily peak, around 164.70 area ahead of ECB policy decision
- EUR/JPY rallies over 50 pips from the daily low amid some repositioning ahead of the ECB.
- The BoJ’s dovish outlook continues to undermine the JPY and acts as a tailwind for the cross.
- Intervention fears could limit the JPY losses and cap gains ahead of the central bank event risk.
The EUR/JPY cross attracts some dip-buying near the 164.15-164.10 area on Thursday and climbs to a fresh daily peak during the first half of the European session. Spot prices currently trade around the 164.65-164.70 region and for now, seem to have snapped a two-day losing streak to the weekly low touched on Wednesday.
The Japanese Yen (JPY) continues to be undermined by the Bank of Japan's (BoJ) cautious approach and uncertain outlook for future rate hikes. Apart from this, some repositioning trade ahead of the key central bank event risk – the highly-anticipated European Central Bank (ECB) meeting – acts as a tailwind for the EUR/JPY cross. That said, a combination of factors might hold back bulls from placing aggressive bets and cap the upside.
A flurry of verbal warnings from Japanese officials that they would intervene in the markets to address any excessive falls in the domestic currency, along with the cautious market mood, could help limit losses for the safe-haven JPY. Apart from this, bets that the ECB will start cutting interest rates in June, amid a faster-than-anticipated fall in the Eurozone inflation, should contribute to keeping a lid on the EUR/JPY cross.
Hence, the market focus will remain glued to fresh economic projections, which, along with ECB President Christine Lagarde's comments at the post-meeting press conference, will be looked upon for cues about the timing of the first rate cut. This, in turn, will influence the shared currency in the near term and provide a fresh directional impetus to the EUR/JPY cross. Nevertheless, the fundamental backdrop warrants caution for bullish traders.
-
10.04.2024 18:10EUR/JPY Price Analysis: Bulls lose traction, possible market cooling may follow
- The daily RSI for EUR/JPY reveals a possible reduction in positive market momentum, signifying diminishing buyers' influence.
- The hourly indicators suggest a growing selling pressure.
The EUR/JPY pair is trading at 164.25 and has decreased by 0.30% in Wednesday’s session. Despite being positioned above its key Simple Moving Averages (SMAs), the pair is experiencing a potential shift in momentum from bulls to bears with technical indicators losing traction.
On the daily chart, the Relative Strength Index (RSI) for the pair is positioned in positive territory but points down. This, coupled with the sharp decrease in the green bars of the Moving Average Convergence Divergence (MACD), points to a possible reduction in positive market momentum. It indicates that the influence of buyers is potentially dwindling in the market. As such, the pair may start to cool off.
EUR/JPY daily chart
Zooming in, the hourly RSI value hovers mostly in the oversold region, with the latest value just above 30. Additionally, the MACD histogram on this timeframe presents rising red bars, showcasing an increase in negative momentum. This hints at a rise in sellers' dominance in the market.
EUR/JPY hourly chart
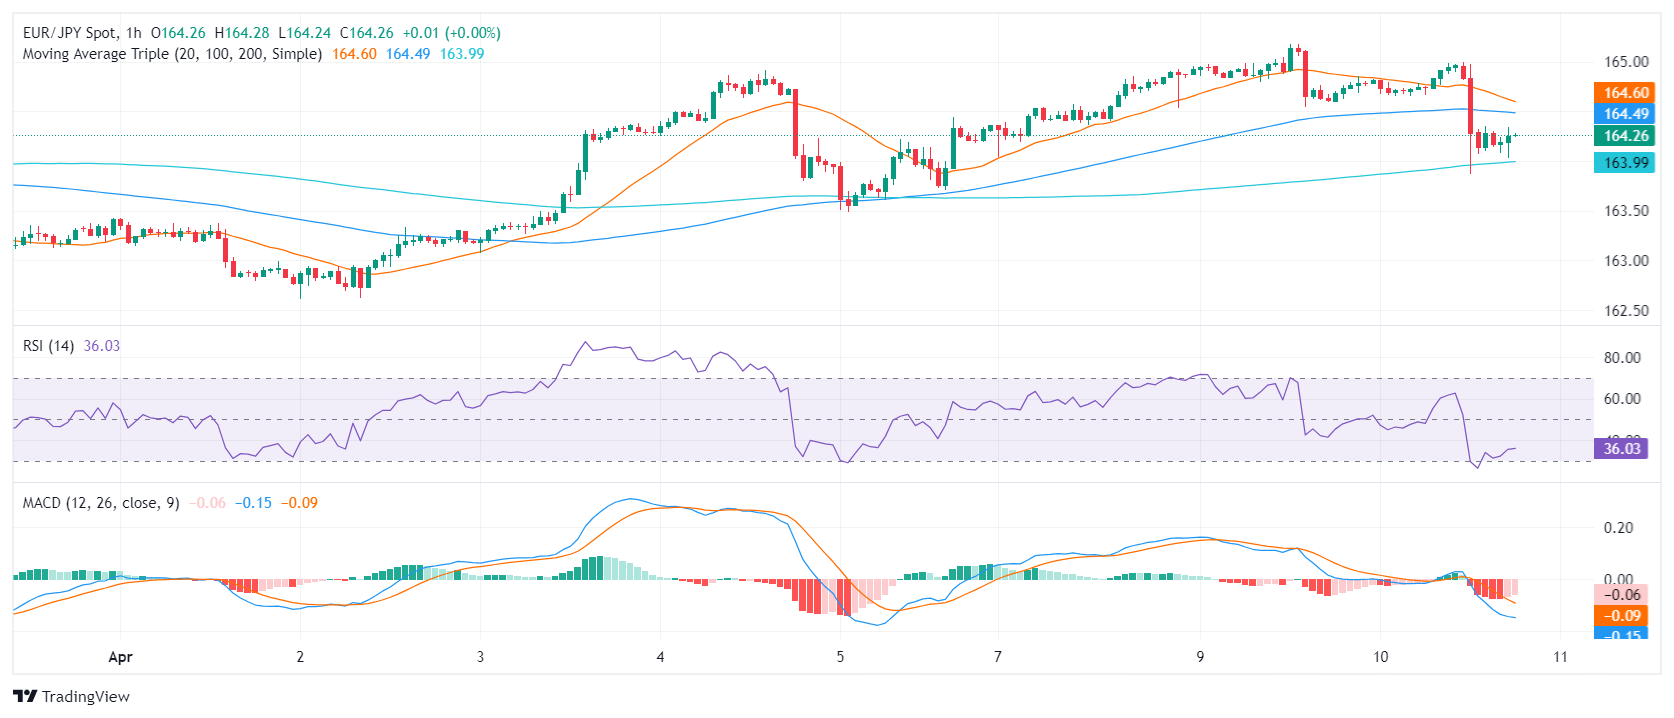
Inspecting the broader outlook, the EUR/JPY demonstrates considerably bullish signals. It stands above the 20-day, 100-day, and 200-day Simple Moving Averages (SMA). Such a position typically signifies a strong and resilient upward trend for both short-term and long-term scenarios. However, today's significant movements must be taken into account. Notably, the pair is challenging the 20-day SMA at the 163.72 mark. If the selling momentum grows and bears conquer the 20-day average, the pair may see further downside.
-
09.04.2024 16:00EUR/JPY Price Analysis: Consolidates around 164.00 as intervention threats remain
- EUR/JPY slightly falls to 164.65, amid intervention rumors, ECB easing expectations.
- Surpassing 165.00 may indicate bullish trend, aiming beyond YTD high to 166.00.
- Falling below 164.00 might lead to correction, with key supports at Ichimoku Cloud indicators.
The EUR/JPY pair remains subdued in early trading during the North American session, posting minuscule losses of 0.14% and exchanging hands at 164.65. Japanese authorities intervention threats, along with speculations that the European Central Bank (ECB) could begin easing policy in June, increased appetite for the safe-haven Japanese Yen (JPY).
EUR/JPY Price Analysis: Technical outlook
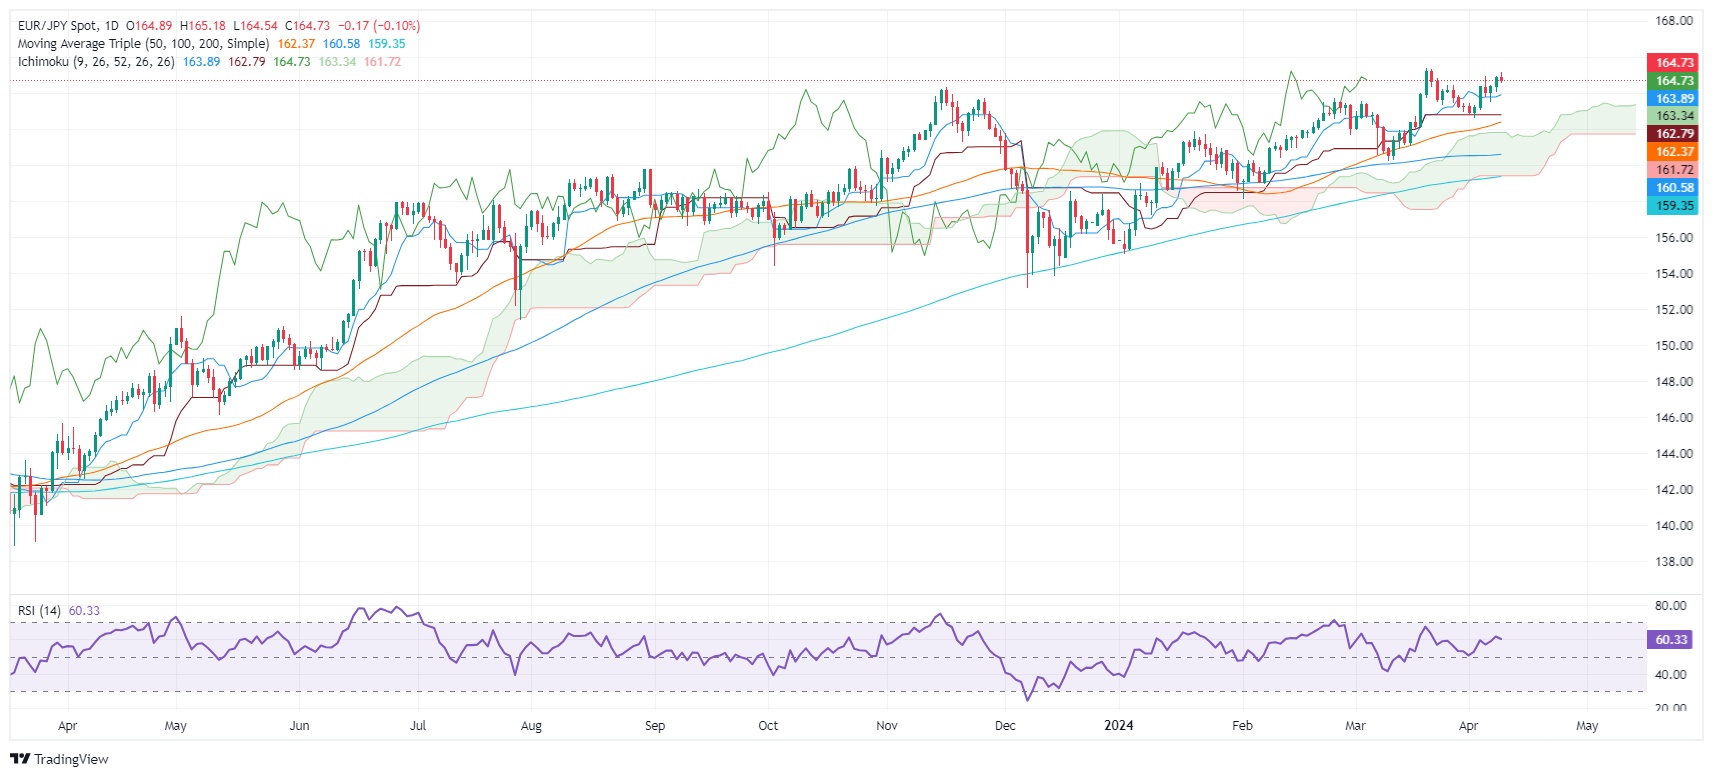
From a technical standpoint, the EUR/JPY is in consolidation at around the 164.00/165.33 year-to-date (YTD) high, with price action getting closer to the Ichimoku Cloud (Kumo). That means the uptrend stalled, and market participants are scrambling for direction in the pair.
For a bullish continuation, the EUR/JPY must break above 165.00, followed by the YTD high of 165.33. Up next sits the psychological 166.00 figure.
Conversely, if sellers push prices below 164.00, that would pave the way for a deeper correction. The next support would be the Tenkan Sen at 163.89, followed by the Senkou Span A at 163.33. Further losses are seen at the Kijun-Sen at 162.78, before clashing with the top of the Kumo around 162.50.
EUR/JPY Price Action – Daily Chart
-
09.04.2024 06:42EUR/JPY Price Analysis: Trades with a mild positive bias above 164.80
- EUR/JPY posts modest gains around 164.88 amid the BoJ’s dovish stance.
- The cross maintains the bullish outlook above the key EMA; RSI indicator holds in the bullish territory above the 50-midline.
- The first upside barrier is located at 165.18; the initial support level is seen at 164.53.
The EUR/JPY cross trades with mild positive bias near 164.988 on Tuesday during the early European trading hours. The dovish language from Bank of Japan (BoJ) policymakers exerts some selling pressure on the Japanese Yen (JPY). However, the potential intervention from the Japanese authorities might lift the JPY and cap the upside of the cross. Investors await the European Central Bank’s (ECB) interest rate decision on Thursday, which is widely anticipated to keep interest rates unchanged at 4.5%.
From a technical perspective, the bullish stance of EUR/JPY remains unchanged as the cross is above the 50-period and 100-period Exponential Moving Averages (EMA) on the four-hour chart. The upward momentum is supported by the Relative Strength Index (RSI), which stands in bullish territory around 66, suggesting the path of least resistance level is to the upside for the time being.
The upper boundary of the Bollinger Band at 165.18 acts as an immediate resistance for the EUR/JPY. The next upside target to watch is a high of March 20 at 165.35. Any follow-through buying above the latter will expose the 166.00 psychological round mark.
On the flip side, the initial support level for the cross is seen near a swing low of April 9 at 164.53. The additional downside filter to watch is the 50-period EMA at 164.07. The crucial downside target is near the confluence of the 100-period EMA and the lower limit of the Bollinger Band at 163.70. A breach of this level will see a drop to a low of April 5 at 163.48.EUR/JPY four-hour chart
-638482414246752183.png)
-
08.04.2024 18:15EUR/JPY Price Analysis: Bulls step in and momentum grows
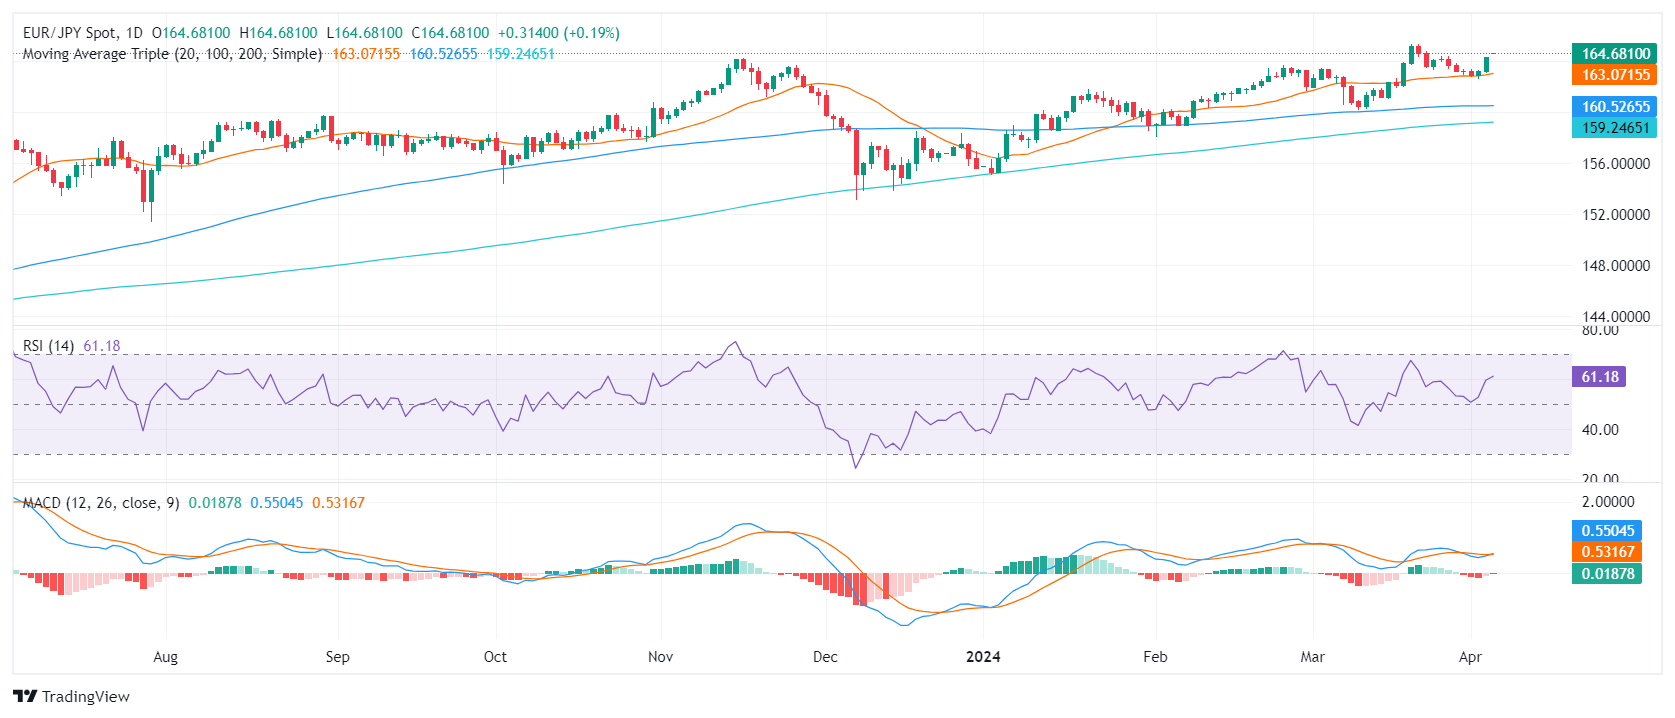
- The daily chart analysis of EUR/JPY reveals a strong buying momentum, as indicated by RSI and MACD in the positive territory.
- The MACD on the daily and hourly charts shows growing buying traction, reinforcing the bullish trend.
- The pair stance above the crucial Simple Moving Averages indicates a prolonged bullish phase.
The EUR/JPY currency pair currently trades at 164.78, demonstrating a daily gain of 0.28%. It suggests a likely continued bullish phase, well positioned above essential Simple Moving Averages (SMAs). The market's current stance signifies the dominance of buyers, with long positions appearing favorable.
On the daily chart, the Relative Strength Index (RSI) resides in the positive territory, hovering at around 62, near to the overbought region, which suggests a rather potent buying pressure. Concurrently, the Moving Average Convergence Divergence (MACD) displays ascending green bars, signifying positive momentum.
EUR/JPY daily chart
Turning to the hourly chart, the RSI portrays a similar bullish sentiment, as its latest reading registers at 67. The MACD remains consistent with the daily chart, as it exhibits an emerging green bar, indicating enhanced positive momentum. This corroborates the dominance of buyers in this time frame as well.
EUR/JPY hourly chart
Considering the broader outlook, the EUR/JPY appears to be in a solid position, standing above the 20-day, 100-day, and 200-day Simple Moving Averages (SMAs). SMAs are crucial as positions above these levels suggest a prevailing bullish trend. The higher above the SMA, the stronger the bullish sentiment.
-
05.04.2024 19:48EUR/JPY Price Analysis: Bullish stance holds strong, potential minor correction anticipated
- The daily chart reveals an encouraging picture for the bulls, with the RSI close to 60.
- On the hourly chart, the indicators are weakening, but remain in a positive area.
- The cross operating above main SMAs, suggests a maintained bullish bias in both short-term and long-term contexts.
The EUR/JPY pair is currently exchanging hands at 164.24, registering a minor gain of 0.16%. Trading dynamics are steadily bullish, with buyers having a dominant influence over market actions. However, indicators are losing steam in the hourly chart.
The daily Relative Strength Index (RSI) reading, residing near 60, places the market in a positive territory and its consistent positive trend in the RSI, indicates that buyers maintain control over the market. Consistently, the Moving Average Convergence Divergence (MACD) presents an encouraging picture with decreasing red bars suggesting weak negative momentum.
EUR/JPY daily chart
Taking a look at the hourly chart, a similar tone of bullish dominance resounds but with indicators losing traction. The RSI values show a positive terrain, position between 40 and 60 during the most recent hours but point south. The MACD on the other hand, prints flat green bars, indicating a steady buying momentum.
EUR/JPY hourly chart

In the broader perspective, EUR/JPY maintains a significant bullish stance. Notably, the EUR/JPY stands above both the 20,100 and 200-day SMA, reaffirming a solid long-term bullish position and confirming the dominant upward movement shown by the RSI.
In conclusion, the comprehensive examination of EUR/JPY, considering both the daily and hourly charts, delivers a dual message. Buyers generally command the market, as illustrated by the upward RSI trend and the presence of green MACD bars. However, minor dips and slowdowns on the hourly chart imply occasional shifts in market dynamics toward sellers.
-
05.04.2024 09:11EUR/JPY remains calm amid mixed Eurozone Retail Sales, trades around 164.10
- EUR/JPY moves in the positive direction after recovering losses on Friday.
- Eurozone Retail Sales (YoY) contracted by 0.7% in February, a lower-than-expected decline of 1.3%.
- The Japanese Yen enjoyed a safe-haven status amid escalated tensions in the Middle East.
EUR/JPY has recovered its intraday losses to move into positive territory, inching higher to near 164.10 during the European trading hours on Friday. However, the EUR/JPY cross faced challenges as the safe-haven Japanese Yen (JPY) gained attraction amid escalated geopolitical tension after Iran vowed to retaliate against Israel's attack on Iran's embassy in Syria, which resulted in the loss of Iranian military personnel.
The downbeat economic data from Germany might have pressured the Euro, limiting the advance of the EUR/JPY cross. The seasonally adjusted Factory Orders from the Federal Statistics Office of Germany, revealed a contraction of 0.2% month-over-month in February, falling short of the expected increase of 0.8% but swinging from the previous decline of 11.4%. The index YoY fell by 10.6%, exceeding the previous decline of 6.2%.
Eurozone Retail Sales (YoY) contracted by 0.7% in February, a lower-than-expected decline of 1.3% and 0.9% prior. The monthly index declined by 0.5%, exceeding the market expectations of a 0.4% decline.
Bank of Japan (BoJ) Governor Kazuo Ueda indicated on Friday that the central bank might adjust monetary policy if foreign exchange fluctuations significantly impact the wage-inflation cycle in a manner that cannot be ignored.
Japan's Finance Minister Shunichi Suzuki echoed this sentiment, emphasizing his close monitoring of currency movements with a strong sense of urgency. He expressed readiness to explore all available options to address excessive volatility in the foreign exchange market.
Furthermore, Japan's Prime Minister Fumio Kishida stated that appropriate action would be taken if there were excessive FX movements. He emphasized the utilization of all means to respond to such fluctuations. Prime Minister Kishida also highlighted the importance of stable forex movements reflecting fundamentals, stating that volatile movements are unfavorable.
-
04.04.2024 18:19EUR/JPY Price Analysis: Bulls prevail in the short-term sphere, investors start to take profits
- Indicators from the hourly chart show that buyers are taking profits.
- As long as the cross holds above its main SMAs, the outlook will be positive.
The EUR/JPY is changing hands at 164.74, up by 0.28%. The buyers demonstrate a stronghold in the market, which has led to ascending buying momentum. On the hourly chart, indicators are correcting oversold conditions so the upside might be limited for the immediate short term.
On the daily chart, the Relative Strength Index (RSI) currently situated in the positive territory, suggests a strong prevalence of buyers in the market. Additionally, decreasing red bars on the Moving Average Convergence Divergence (MACD) histogram indicates a weak bearish momentum.
EUR/JPY daily chart
Looking at the hourly chart, the RSI, all values well above the mid-line but pointing south which suggests that the buyers are losing steam. Furthermore, rising red bars on the MACD histogram add more arguments for the bears stepping in.
EUR/JPY hourly chart
The broader market outlook harbors mixed signals as the EUR/JPY hovers above the 20, 100, and 200-day Simple Moving Averages (SMAs) which implies that the overall trends continue to be bullish. In summary, although indicators advocate for a bullish bias, a close observation of short-term bearish signals emitted by the declining RSI on the hourly chart is crucial.
-
04.04.2024 06:45EUR/JPY Price Analysis: Resumes its bullish bias near 164.50 amid the overbought condition
- EUR/JPY extends its recovery to 164.50 in Thursday’s early European session.
- The cross resumes its bullish outlook with the overbought RSI condition.
- The first upside barrier will emerge at 164.70; initial support level is located at the 164.00 round mark.
The EUR/JPY cross trades on a stronger note for the third consecutive day around 164.50 during the early European session on Thursday. The absence of clarity from the Bank of Japan (BoJ) on future policy steps puts some selling pressure on the Japanese Yen (JPY). However, the possible intervention from the Japanese authorities to prevent the JPY depreciation might cap the upside of the EUR/JPY cross.
According to the four-hour chart, EUR/JPY resumes its upside stance as the cross holds above the 50- and 100-period Exponential Moving Averages (EMA). The Relative Strength Index (RSI) holds in bullish territory above 70. However, the overbought RSI condition indicates that further consolidation cannot be ruled out before positioning for any near-term EUR/JPY appreciation.
The first upside barrier for EUR/JPY will emerge near the upper boundary of the Bollinger Band at 164.70. Any follow-through buying above this level could pave the way to a high of March 20 at 165.35. The next hurdle is seen at the psychological level of 166.00.
On the downside, the 164.00 round mark acts as an initial support level for the cross. The additional downside filter to watch is the 50-period EMA at 163.56, followed by the 100-period EMA at 163.30. A decisive break below the latter will see a drop to the lower limit of the Bollinger Band at 162.30.EUR/JPY four-hour chart
-638478098442849373.png)
-
03.04.2024 16:52EUR/JPY Price Analysis: Climbs above 164.00 with bulls eyeing YTD high
- EUR/JPY breaks above Tenkan-Sen, eyes 165.00 potential.
- Holding above 164.00 may lead to testing yearly highs.
- Bears aim below 164.00 for reversal; Tenkan-Sen, Kijun-Sen as supports.
The Euro posted solid gains against the Japanese Yen (JPY) on Wednesday, amid an improvement in risk appetite and the dovish stance adopted by the Bank of Japan (BoJ) despite rising interest rates. At the time of writing, the EUR/JPY trades at 164.25, up 0.67%.
EUR/JPY Price Analysis: Technical outlook
Euro bulls re-entered the market, lifting the EUR/JPY pair above the Tenkan-Sen a 163.71, which opened the door to reclaim the 164.00 mark. That suggests that buyers are gathering steam, which would open the door to challenge the 165.00 mark. A breach of the latter will expose the year-to-date (YTD) high of 165.34.
On the flip side, sellers must drag prices below 164.00 to challenge the new Tenkan-Sen level at 163.71, the next support level. Once surpassed, traders could test the Senkou Span Aat 163.25, followed by the Kijun-Sen level at 162.78.
EUR/JPY Price Action – Daily Chart
-
03.04.2024 07:15EUR/JPY rises to near 163.30 ahead of Eurozone HICP data
- EUR/JPY gains ground as Japanese Yen struggles to maintain its strength.
- Japanese authorities could intervene in the markets to support the Yen.
- ECB’s Robert Holzmann would like to see more supportive data before initiating rate cuts in June.
EUR/JPY continues to advance for the second consecutive session, trading around 163.30 during the early European hours. Despite a modest uptick in the Japanese Yen (JPY) yesterday, it struggles to maintain its strength. Investors are cautious amid the possibility of Japanese authorities intervening in the markets to prevent a significant decline in the Yen.
This, coupled with a subdued risk sentiment, provides some support to the safe-haven JPY. However, the Bank of Japan's (BoJ) cautious stance on further policy tightening fails to inspire bullish sentiment or offer substantial momentum.
Japanese Finance Minister Shunichi Suzuki reiterated his caution regarding excessive exchange-rate volatility and reaffirmed authorities' readiness to take appropriate action. His remarks provided some backing to the Japanese Yen.
European Central Bank (ECB) policymaker Robert Holzmann stated in a Reuters interview on Wednesday, "I have no inherent objection to a rate cut in June, but I would like to see more supportive data before making a decision."
German inflation moderated slightly more than anticipated in March, reaching its lowest level in almost three years. The preliminary German Harmonized Index of Consumer Prices (HICP) increased by 0.6% month-on-month (MoM) in March, slightly below the forecasted 0.7% rise. The year-on-year rate of HICP climbed by 2.3%, falling short of the market consensus of 2.4%.
The softer inflation figures suggest that Germany edges closer to the European Central Bank's (ECB) target of 2%, leading to market expectations of a potential interest rate cut in the near future. Consequently, this exerts selling pressure on the Euro (EUR) and presents a headwind for the EUR/JPY cross. Investors are now awaiting the advanced Eurozone Harmonized Index of Consumer Prices data for March on Wednesday for further insights.
-
02.04.2024 17:59EUR/JPY Price Analysis: Bullish trend intact, as long as bulls defend the 20-day SMA
- Indicators on the daily chart show a steady buying momentum.
- Bulls need to maintain control over the current support around the 20-day SMA to avoid additional losses.
- Hourly chart indicators show signs of recovery.
The EUR/JPY pair is currently oscillating around the 163.20 mark, showing a slight increase in Tuesday’s session. The persisting momentum suggests an upper hand for the bulls, but if the pair falls below the 20-day Simple Moving Average (SMA), there may be a likelihood for sellers to force a momentum shift.
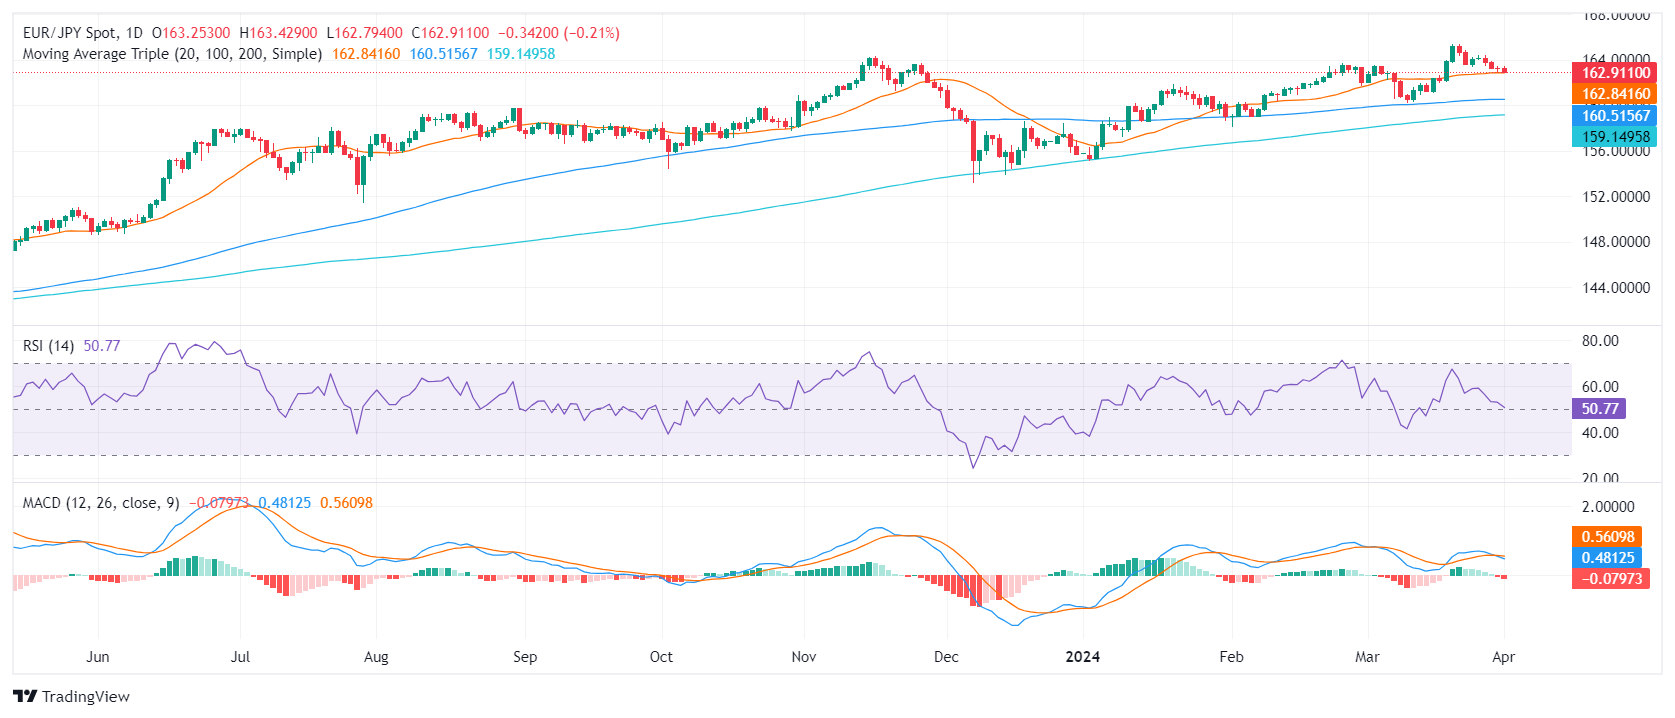
On the daily chart, the EUR/JPY pair has a mildly positive outlook. The Relative Strength Index (RSI) fluctuates in the positive territory, peaking at 65 last week before slipping to 52 in the most recent reading. The Moving Average Convergence Divergence (MACD) continues to print flat red bars, indicating a slightly negative momentum.
EUR/JPY daily chart
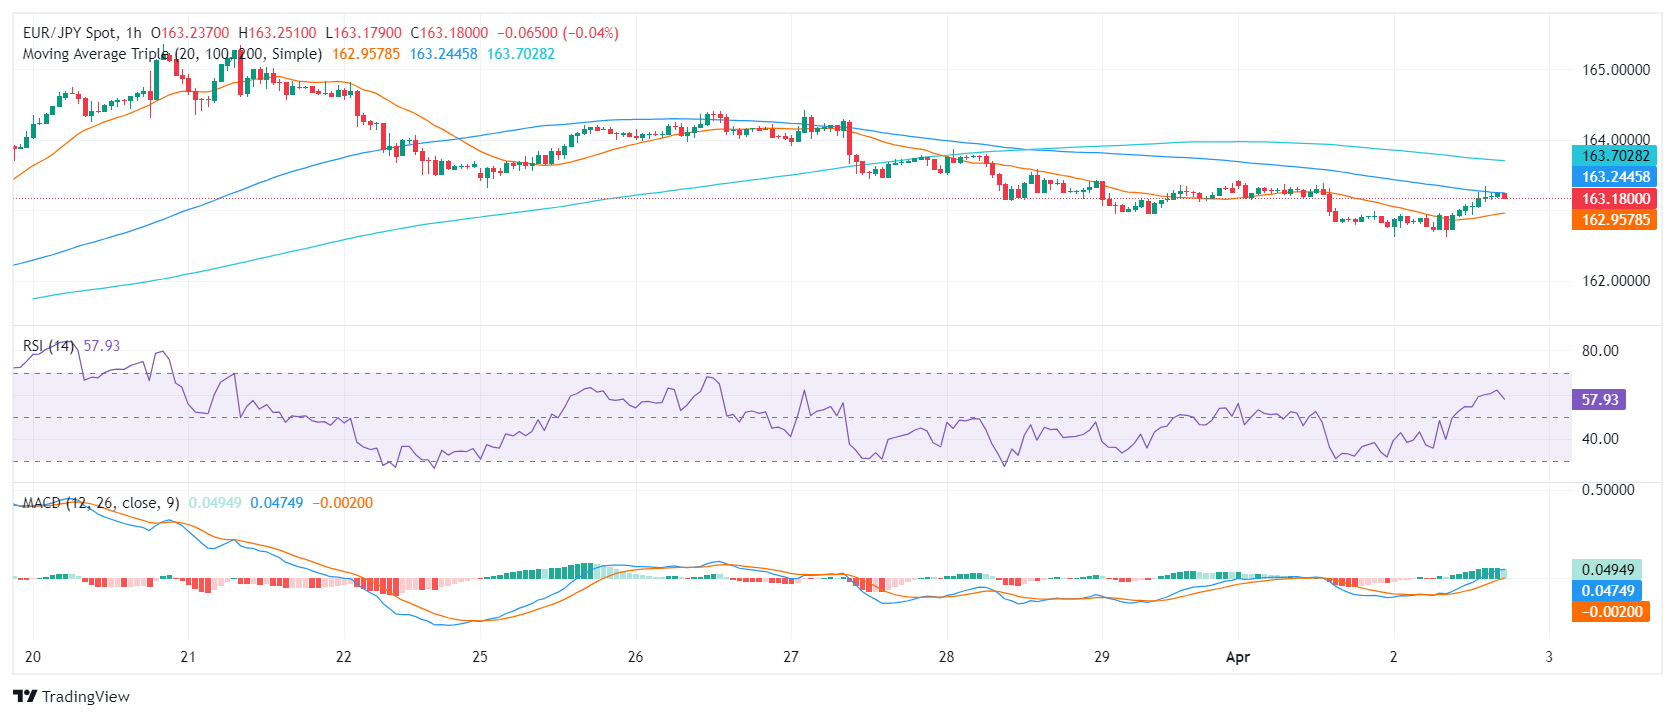
Switching to the hourly chart, the sentiment also leans towards positivity. The RSI, which started the session from a low point in negative territory at 39, has since recovered strongly to the positive territory with the most recent reading at 61. Reinforcing this positive trend, the MACD histogram prints green bars.
EUR/JPY hourly chart
In summary, the EUR/JPY pair is demonstrating an overall upward bias amidst minor setbacks. Both the daily and hourly charts portray a positive sentiment, as indicated by the RSI and MACD values. Along with the pair standing above its 20,100 and 200-day SMA, the overall market inclination leans towards the bulls.
-
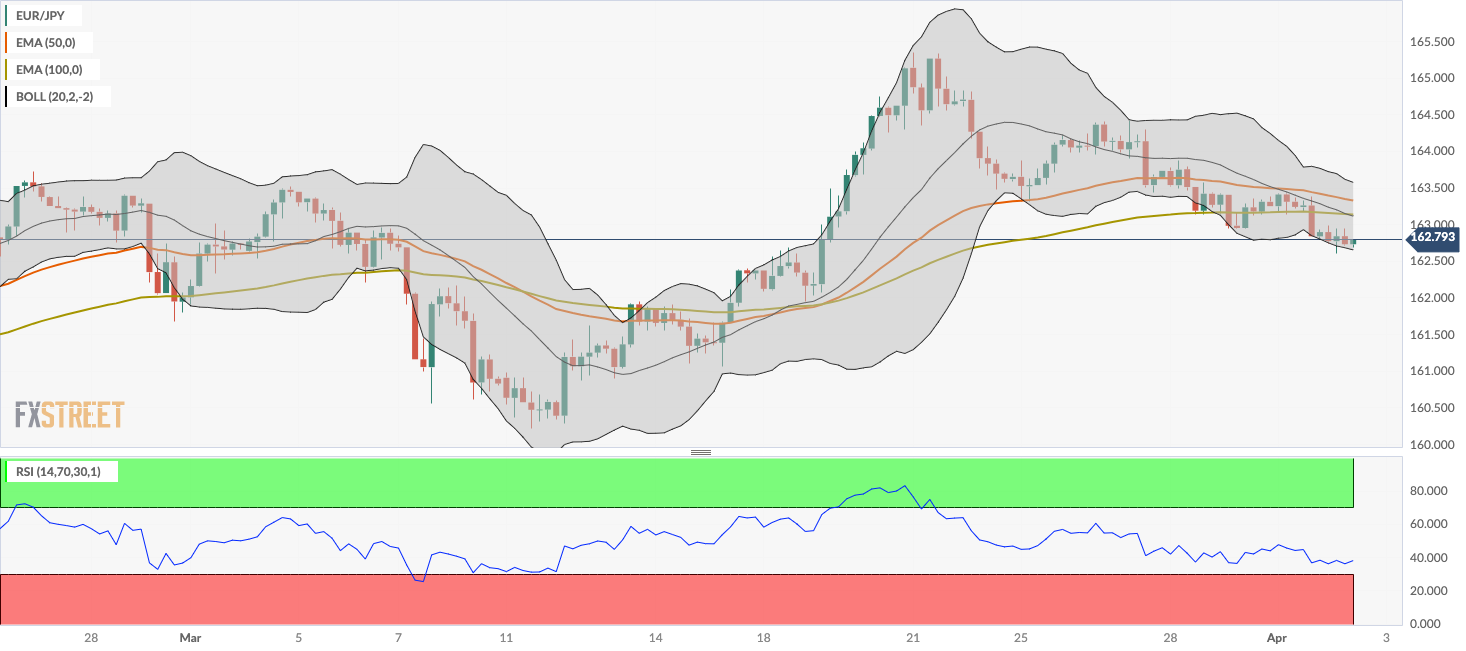
02.04.2024 07:13EUR/JPY Price Analysis: Loses momentum under 163.00, further downside looks favorable
- EUR/JPY edges lower to 162.75 amid the fear of FX intervention from the Bank of Japan (BoJ).
- The cross keeps the negative outlook below the key EMA; RSI indicator lies in bearish territory.
- The first upside barrier will emerge at 163.15; the first downside target is located at 162.65.
The EUR/JPY cross loses momentum near 162.75 during the early European trading hours on Tuesday. The growing speculation that the Bank of Japan (BoJ) will intervene in the foreign exchange market might support the Japanese Yen (JPY) in the near term. Early Tuesday, Japanese Finance Minister Shunichi Suzuki said that he will not rule out any steps to respond to disorderly moves and that he will monitor foreign exchange (FX) moves with a high sense of urgency.
From a technical perspective, the bearish outlook of EUR/JPY remains intact as the cross is below the 50- and 100-period Exponential Moving Averages (EMA) on the four-hour chart. The Relative Strength Index (RSI) lies in bearish territory around 36.40, supporting the sellers for the time being.
The first upside barrier for EUR/JPY will emerge near the 100-period EMA at 163.15. Further north, the next target is seen at the 50-period EMA at 163.32. A decisive break above the latter will expose the upper boundary of the Bollinger Band at 163.58. Any follow-through buying above this level would sustain its bullish move to a high of March 27 at 164.41.
On the flip side, the lower limit of the Bollinger Band at 162.65 acts as an initial support level for the cross. The key contention level is located at the 162.00 mark, representing a low of March 19 and a psychological level. A breach below 162.00 will see a drop to a low of March 14 at 161.10.EUR/JPY four-hour chart
-
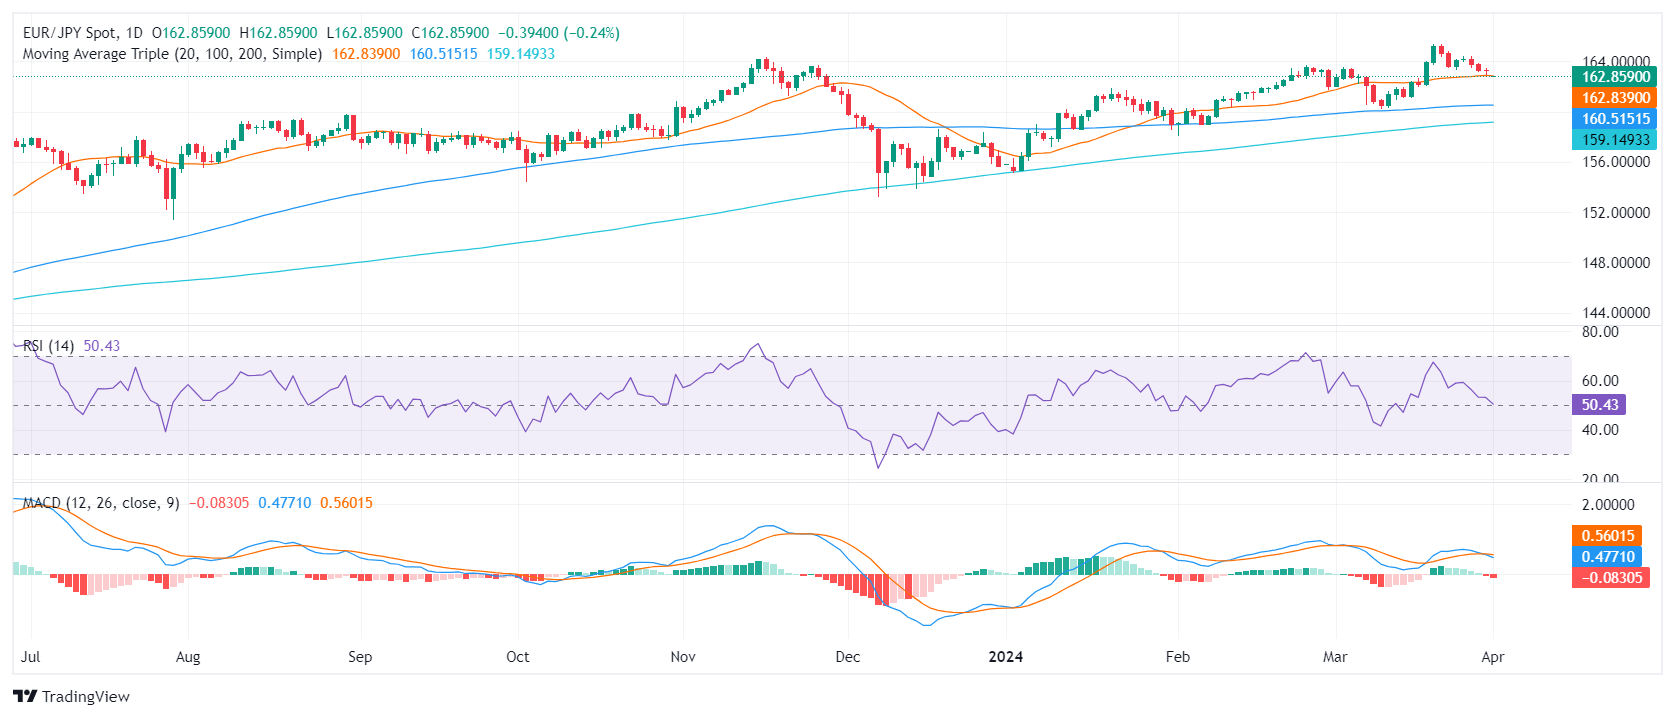
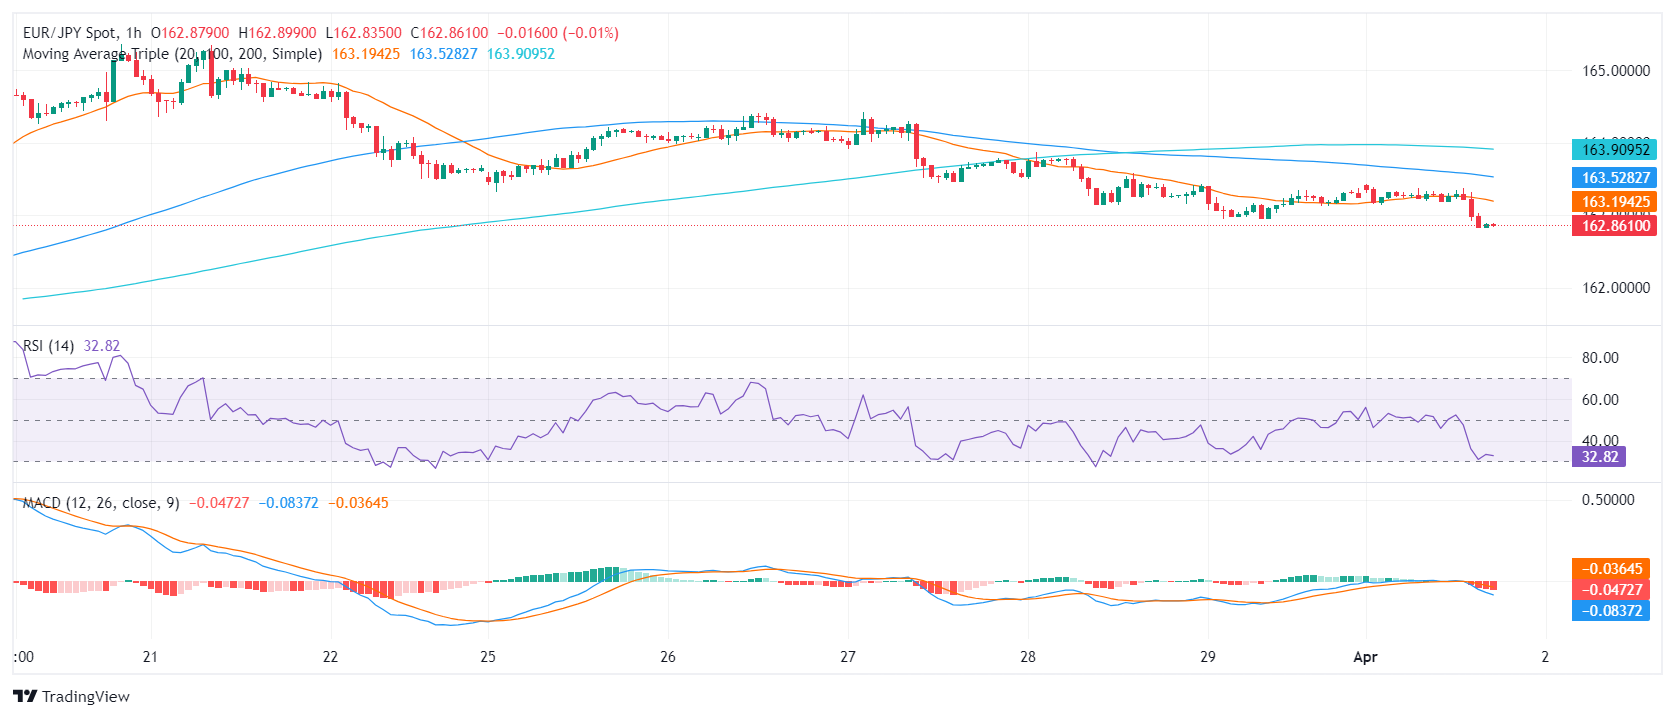
01.04.2024 19:40EUR/JPY Price Analysis: Bearish momentum gains steam, long-term bullish signals warrant vigilance
- Significant selling momentum is revealed in the daily chart as the RSI slips into negative zones while MACD signifies growing negative traction.
- In line with the daily chart, the hourly indicators show mounting selling pressure.
- The recent dip beneath the 20-day SMA may suggest a possible short-term bearish realignment.
The EUR/JPY pair is currently trading around 162.85, representing a decline of 0.30% during Monday's session. Bearish cues are intensifying as seen in the increase in selling momentum, which signals a possible shift from the preceding bullish trend.
On the daily chart for EUR/JPY, the most recent Relative Strength Index (RSI) reading fell near negative territory. This situation tends to indicate a growing selling momentum. Concurrently, the Moving Average Convergence Divergence (MACD) histogram showcases rising red bars, implying a surge in negative momentum.
EUR/JPY daily chart
Assessing the hourly chart, the EUR/JPY pair showcases similar bearish sentiments. The RSI dipped near the oversold territory demonstrating the sellers' dominance in the market over the recent hours. Adding to this, the hourly MACD histogram reinforces this sentiment, illustrating rising red bars indicating a tilt towards negative momentum.
EUR/JPY hourly chart
Scrutinizing the broader outlook, EUR/JPY portrays a blend of bullish and bearish signals. A bullish stance manifests through its standing above the 100-day and 200-day Simple Moving Averages (SMA), revealing a positive trend for the pair in the long run. However, the cross has dipped just below the 20-day SMA today, inferring a potential bearish shift in the short term.
In summary, although the longer-term trends demonstrate a predominantly bullish stance for EUR/JPY, recent readings from both the daily and hourly charts suggest a possible shift towards a sellers' market which could fuel additional downward movements in case the buyers fail to step in.
-638482414246752183.png)
-638478098442849373.png)


© 2000-2024. All rights reserved.
This site is managed by Teletrade D.J. LLC 2351 LLC 2022 (Euro House, Richmond Hill Road, Kingstown, VC0100, St. Vincent and the Grenadines).
The information on this website is for informational purposes only and does not constitute any investment advice.
The company does not serve or provide services to customers who are residents of the US, Canada, Iran, The Democratic People's Republic of Korea, Yemen and FATF blacklisted countries.
Making transactions on financial markets with marginal financial instruments opens up wide possibilities and allows investors who are willing to take risks to earn high profits, carrying a potentially high risk of losses at the same time. Therefore you should responsibly approach the issue of choosing the appropriate investment strategy, taking the available resources into account, before starting trading.
Use of the information: full or partial use of materials from this website must always be referenced to TeleTrade as the source of information. Use of the materials on the Internet must be accompanied by a hyperlink to teletrade.org. Automatic import of materials and information from this website is prohibited.
Please contact our PR department if you have any questions or need assistance at pr@teletrade.global.
transfers