- Analytics
- News and Tools
- Quotes
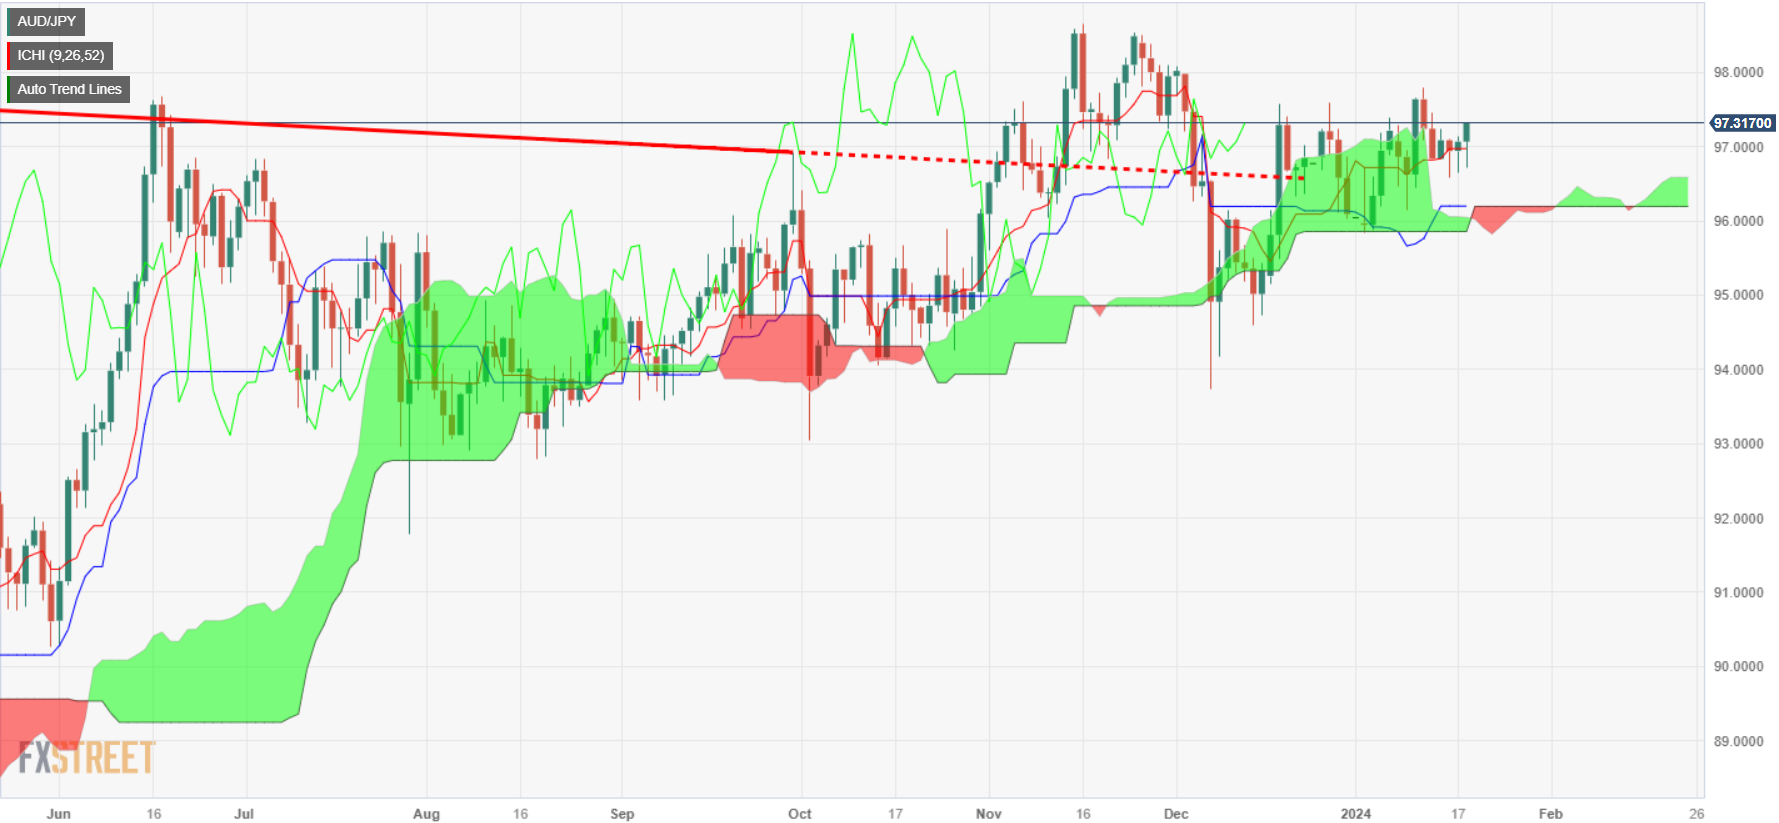
- Chart and quotes for AUDJPY
CFD Trading Rate Australian Dollar vs Japanese Yen (AUDJPY)
| Date | Rate | Change |
|---|
Related news
-
07.02.2024 03:40AUD/JPY edges higher to near 96.70 after hawkish remarks by RBA Bullock
- AUD/JPY gained ground on RBA’s hawkish stance on monetary policy.
- RBA Governor Michele Bullock did not rule anything in or out regarding policy decisions.
- Japan's Foreign Reserves decreased to $1,291.8 billion in January from the previous figure of $1,294.6 billion.
AUD/JPY trends upwards for the second consecutive day on Wednesday, trading around 96.70 during the Asian session. The hawkish remarks from Reserve Bank of Australia (RBA) Governor Michele Bullock on Tuesday have bolstered confidence in the Australian Dollar (AUD), contributing to its strength against the Japanese Yen (JPY).
The Reserve Bank of Australia (RBA) maintained its Official Cash Rate (OCR) at 4.35% on Tuesday, a move that was widely expected. RBA Governor Michele Bullock refrained from making any definitive statements about future policy decisions. She stressed the importance of balanced risks and highlighted the bank's ongoing efforts to gather data confirming a return of inflation to target levels. Governor Bullock mentioned a forecast of 2.8% inflation for the year 2025.
On the other side, Wednesday's release of Japan's Foreign Reserves report indicated a slight decrease, with the figure standing at $1,291.8 billion in January compared to December's figure of $1,294.6 billion. Additionally, on Tuesday, Labor Cash Earnings (Year-over-Year) showed improvement, registering at 1.0% in December compared to the previous reading of 0.7%, albeit falling short of the expected 1.3%.
The Japanese Yen receives support from expectations that another significant pay hike this year will contribute to sustained and stable inflation. This optimism is fueling hopes that the Bank of Japan (BoJ) may gradually move away from its ultra-dovish policy stance. Additionally, the BoJ has hinted at the possibility of ending its negative interest rate cycle, suggesting a potential shift in monetary policy direction.
-
06.02.2024 19:48AUD/JPY holds ground after RBA’s decision
- The AUD/JPY is positioned at 96.40 with mild gains.
- The RBA held rates steady as expected.
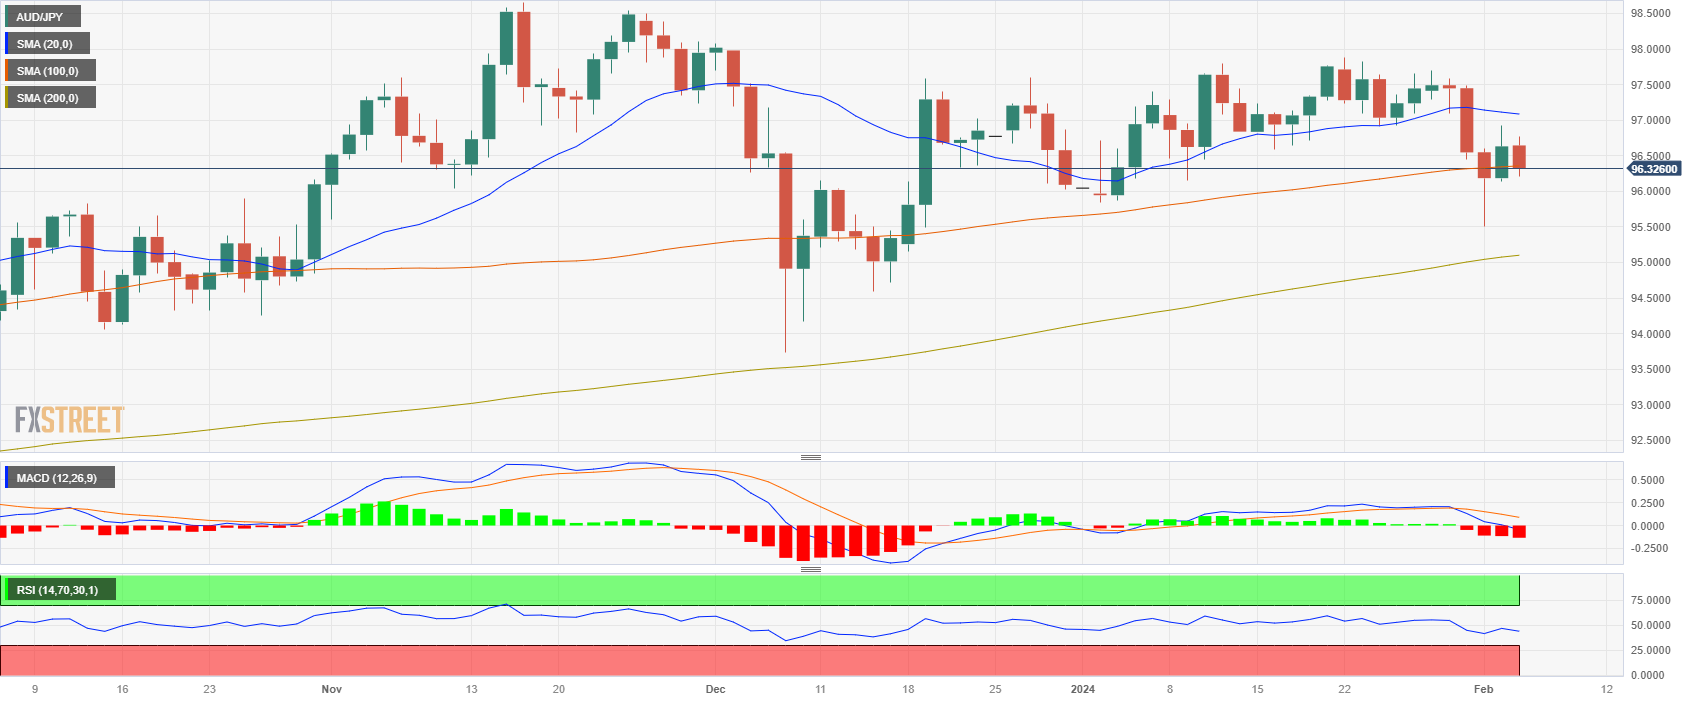
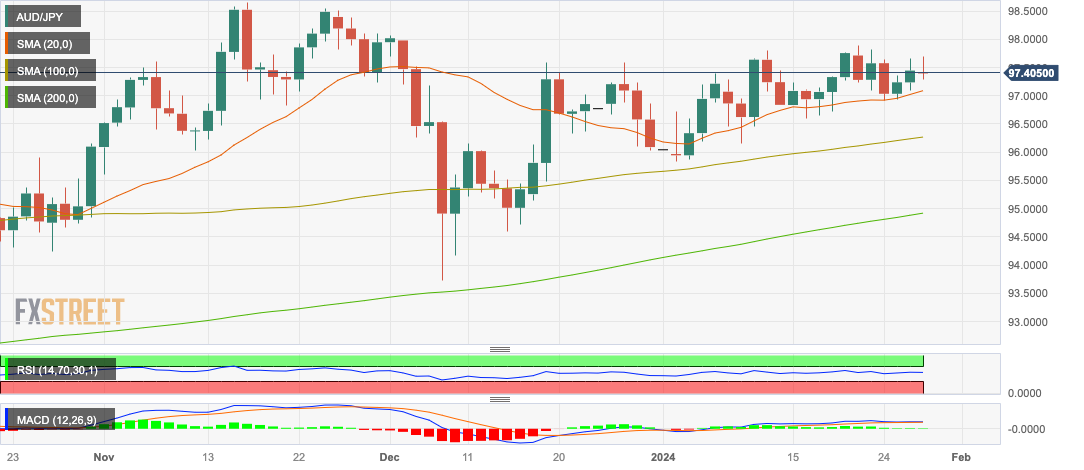
- On the daily chart, the positive slope of the RSI alongside the MACD's decreasing red bars hint at a reduced selling momentum.
- A bullish SMA crossover at the 96.7 level looming with the 20 and 100-day SMAs, hinting at a potential market shift.
In Tuesday's session, the AUD/JPY pair traded mildly higher, hitting a daily high at 96.83 and then stabilizing at 96.40. The latest market movements has been influenced by the diverging monetary policies of the Reserve Bank of Australia (RBA) and Bank of Japan (BoJ) while the Australian’s bank hint of not ruling out further hikes may strengthen the pair. On the technical side, the daily chart suggest that the bulls are holding ground, while the hourly indicators turned flat.
The AUD/JPY pair trades in a complex environment influenced by the monetary policies of the Reserve Bank of Australia (RBA) and the Bank of Japan (BOJ). The RBA recently opted on Tuesday for a hawkish hold, not ruling out further interest rate increases in response to high inflation, while simultaneously reducing growth projections due to a weaker near-term outlook for consumer spending. Meanwhile, Japan reports soft earnings and household spending data, suggesting a continuation of lenient policy settings from the BOJ. A clear divergence in economic conditions and policy directions may fuel further upside for the cross and drive demand to the Aussie. Regarding expectations, the market expects a 50 bp rate cut from the RBA this year, while the BoJ is anticipated to remain on hold.
AUD/JPY levels to watch
On the daily chart, the indicators are displaying a mixed outlook. While the Relative Strength Index (RSI) exhibits an upward trend, it remains in a bearish realm, hinting at potential but not realized bullish activity. The Moving Average Convergence Divergence (MACD) further augments the cautious tone with diminishing red histograms. That said, the position of the cross relative to its Simple Moving Averages (SMAs) offers a ray of optimism. Despite the short-term neutral outlook, a larger view reveals that the pair is abiding above the key 20, 100, and 200-day SMAs. This suggests an overall bull dominancy, with potential room for them to recover lost ground. In addition, traders should eye a potential crossover between the 100 and 20-day SMAs which may fuel further upside.
Shifting focus to the hourly chart horizon, the stage seems more balanced between bulls and bears. Indicators appear to have flattened in a bearish territory, mirroring a stalemate between buyers and sellers. For the rest of the session and heading into Wednesday, the cross may continue to side-ways trade.
AUD/JPY daily chart
-638428455285096332.png)
-
06.02.2024 03:47AUD/JPY jumps to fresh daily peak after RBA decision, lacks follow-through buying
- AUD/JPY gains strong positive traction on Tuesday, though the upside potential seems limited.
- The AUD strengthens after the RBA decided to leave the Official Cash Rate (OCR) unchanged.
- China’s economic woes and geopolitical risk might keep a lid on any further gains for the cross.
The AUD/JPY cross attracts some dip-buying near the 96.25 region during the Asian session on Tuesday and jumps to a fresh daily peak after the Reserve Bank of Australia (RBA) announced its policy decision. Spot prices currently trade around the 96.70 region, though remain confined in a familiar range held over the past three days.
The Australian Dollar (AUD) strengthens a bit after the RBA, as was widely anticipated, decided to keep the Official Cash Rate (OCR) unchanged at the end of the February meeting. In the accompanying policy statement, the RBA noted that wage growth has picked up but is not expected to increase much further and remains consistent with the inflation target. Furthermore, the RBA published new economic forecasts and now sees 2024 GDP growth at 1.8% as compared to the 2% estimated previously. This, in turn, suggests that the RBA's tightening cycle is over and that the next move would be down, which might hold back bulls from placing aggressive bets around the AUD/JPY cross.
Apart from this, persistent worries about slowing economic growth in China might further contribute to keeping a lid on the China-proxy Aussie. Moreover, the risk of a further escalation of geopolitical tensions in the Middle East might continue to benefit the Japanese Yen's (JPY) relative safe-haven status and contribute to capping the AUD/JPY cross. The downside, however, seems cushioned in the wake of comments from China's sovereign wealth fund, saying that they will increase the investment of China stock ETFs and are determined to safeguard the stable operation of the market. Hence, acceptance below the 100-day SMA is needed to confirm a bearish breakdown.
Technical levels to watch
-
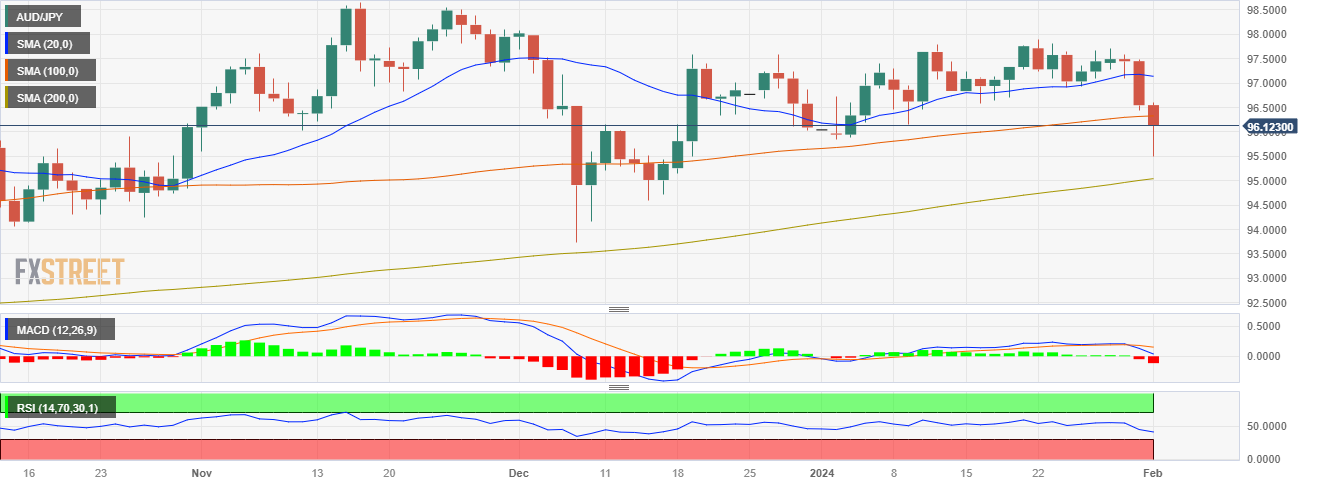
05.02.2024 19:38AUD/JPY price analysis: Bulls hold the line and defend the 100-day SMA
- The AUD/JPY is currently trading at 96.32, recording a loss of 0.30%.
- According to daily chart indicators, negative RSI trajectory and ascending red MACD histogram hint bearish momentum.
- Hourly chart indicators imply bearish pressure has eased with a rebound in bulls evident in positive RSI slope and flat MACD bars.
In Monday's session, the AUD/JPY pair lost ground, with a low of 96.32 following a previous high of 96.80 earlier in the day. On the fundamental side, markets await the Reserve Bank of Australia meeting on Tuesday where investors will look for clues for forward guidance which could set the pace of the cross for the week. The technical outlook for the pair remains neutral to bearish on the daily chart, although recent activity shows the bulls regaining some ground on the hourly chart.
AUD/JPY levels to watch
According to the daily chart, it is showing a neutral to bearish outlook. The negative territory and declining slope of the Relative Strength Index (RSI) indicates a bearish momentum. Simultaneously, the Moving Average Convergence Divergence (MACD) histogram showcases increasing sake of red bars which signals the short-term downward pressure. Nevertheless, despite the shorter-term momentum suggesting bearish sentiment, when looking at the Simple Moving Averages (SMAs), the pair is evidently below the 20-day SMA but bulls are presenting battle at the 100-day SMA and is still above the 200-day average. This indicates that in the larger picture, bulls maintain a stronghold.
Moving onto the shorter-term outlook given by the hourly chart, it presents a slightly different picture. On this timeframe, despite the bears taking a step back and allowing for some recovery, the bullish force is merely reflected as a retaliation rather than a comeback. The Relative Strength Index (RSI) although in negative territory, boasts a positive slope indicative of some bullish pushback. The Moving Average Convergence Divergence (MACD) echoes this sentiment with flat red bars. However, the buying momentum is not sufficient to negate the dominant selling sentiment, but it does put forth a pause in the bearish outlook of the session.
-
05.02.2024 05:13AUD/JPY inches lower to near 96.60 as safe-haven Yen improves on Middle East tension
- AUD/JPY snaps its recent gains as the safe-haven Japanese Yen improves on escalated geopolitical tension.
- White House national security adviser Jake Sullivan warned that US airstrikes were just the beginning.
- Australian Dollar faces challenges as the S&P/ASX 200 Index retreats from last week's record high ahead of RBA’s interest rate decision.
AUD/JPY retraces its recent gains amid speculation of an imminent shift in the Bank of Japan's (BoJ) policy stance. Additionally, escalated geopolitical tension in the Middle East contributes to increased demand for the safe-haven Japanese Yen (JPY), acting as a headwind for the AUD/JPY cross. As a result, the cross edges lowered to around 96.60 during the Asian session on Monday.
The United States (US) and the United Kingdom (UK) conducted new air strikes on the Iran-backed Houthi militant group in Yemen on Saturday. This action was taken in response to a drone strike that resulted in the death of three US service members in Jordan. Adding to the tensions, White House national security adviser Jake Sullivan warned on Sunday that US airstrikes on Iranian-backed militias were just the beginning. Sullivan also expects the possibility of strikes on Iranian soil.
The Australian Dollar (AUD) is under selling pressure as the benchmark S&P/ASX 200 Index retreats from last week's record high. The decline is particularly pronounced in the miners and energy sectors, which is putting additional downward pressure on the AUD/JPY cross
On Monday, Australia’s Trade Balance (MoM) for January indicated a reduction, with the figure at 10,959M compared to the revised figure of 11,764M in December. Additionally, the Judo Bank Composite Purchasing Managers Index (PMI) improved to 49 in January from 48.1 prior. The Services PMI also saw an improvement, rising to 49.1 from the previous figure of 47.9.
The Reserve Bank of Australia (RBA) is scheduled to announce its interest rate decision on Tuesday. Markets expect RBA to maintain the cash rate at its current level of 4.35%. Investors will pay close attention to RBA Governor Michele Bullock's speech on the monetary policy outlook, as it could provide additional insights into the central bank's stance and considerations for future policy actions.
-
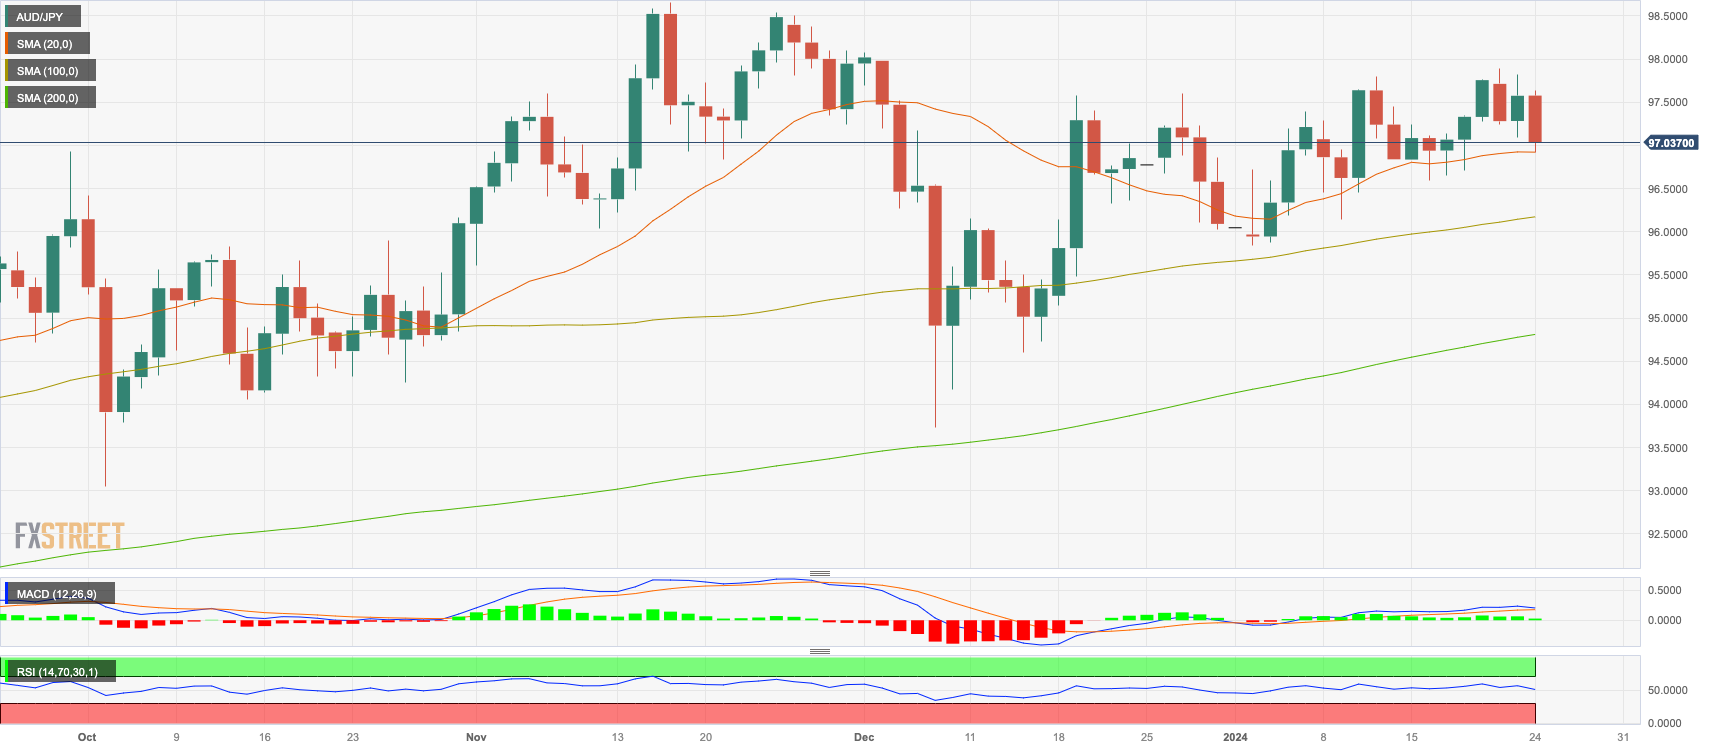
02.02.2024 19:28AUD/JPY Price Analysis: Recovers from multi-week lows, bears take a breather
- The AUD/JPY registers gains at 96.60 mark, with a positive 0.40% score on the board.
- Daily indicators flattened in negative territory.
- On the weekly chart chart, bearish momentum is building.
In Friday's session, the AUD/JPY was seen rising to 96.60, recording gains of 0.40% but will still close a 0.70% weekly loss. While bears have dominated in the last sessions, pushing the pair down to its lowest level since mid-December, they seem to be taking a breather which allowed room for the upside. However, on the weekly outlook, the bearish sentiment is still evident, indicating more downside potential as the cross tallies a second consecutive weekly loss.
On the daily chart, despite the bears making some headway and the pair's trading position situated below the 20-day Simple Moving Averages (SMAs), the bulls retain control in the wider frame.. With regards to the Moving Average Convergence Divergence (MACD), the flat red bars indicate a period of consolidation, which could be seen as bears taking a breather as well as the positive slope in negative territory of the Relative Strength Index (RSI).
On the weekly chart, the momentum appears to tilt towards the bears. With the RSI falling in the positive territory and the MACD displaying red bars, it suggests that the selling momentum may be building up. Since mid-January, the cross declined by nearly 1%, and tallies a two-week losing streak.
AUD/JPY daily chart
-638424988703588170.png)
-
02.02.2024 11:59AUD/JPY edges higher to near 96.80 after rebounding from two-month lows, US NFP eyed
- AUD/JPY recovers from a two-month low at 95.50 recorded on Thursday.
- A Reuters Poll expects RBA to maintain its current interest rate of 4.35% in the February meeting.
- The previous week’s foreign investment might have supported the Japanese Yen.
AUD/JPY continues to gain ground, recovering from the two-month low at 95.50 observed in the previous session. The cross trades higher around 96.80 during the European session on Friday. The Australian Dollar (AUD) has found support from an improved Australian money market, contributing to the strength of the AUD/JPY cross.
Furthermore, the better-than-expected Producer Price Index (PPI) data from Australia underpinned the Aussie Dollar, subsequently underpinning the AUD/JPY cross. The Australian Bureau of Statistics has released the PPI (YoY) for the fourth quarter, reporting an improvement with a growth rate of 4.1%, surpassing the previous growth of 3.8%.
On Thursday, a Reuters Poll showed an expectation that the Reserve Bank of Australia (RBA) could maintain the current interest rate of 4.35% in its upcoming February meeting. Furthermore, former RBA board member Warwick McKibbin suggested that the Australian cash rate may remain around 4.5% for an extended period.
The Australian Dollar has faced challenges, as bond traders have increased their expectations of early interest rate cuts by the Reserve Bank of Australia (RBA) following an unexpectedly weak quarterly inflation report. Futures markets are fully pricing in 50 basis points reductions in 2024, with the first adjustment anticipated in August.
The Bank of Japan's (BoJ) hawkish stance has provided support for the Japanese Yen (JPY). Additionally, the escalated geopolitical tensions in the Middle East might have driven the investors towards the safe-haven Japanese Yen, consequently capping the advances of the AUD/JPY cross.
The Japanese Yen might have gained support from the influx of foreign investment. For the week ending January 26, Foreign Bond Investment in Japan recorded inflows of ¥382.9 billion, a significant turnaround from the previous week's outflows of ¥43.5 billion. Additionally, Foreign Investment in Japanese Stocks rebounded during the same week, rising to ¥720.3 billion compared to the previous week's ¥287 billion.
-
01.02.2024 19:41AUD/JPY Price Analysis: Slips below the 100-day SMA, outlook turns negative
- The AUD/JPY is experiencing a downward shift at 96.18, seeing a 0.23% loss.
- Indicators on the daily chart show a negative outlook as the cross now trades below the 20 and 100-day SMA.
- Four-hour chart indicators are consolidating after hitting oversold conditions.
On Thursday's session, the AUD/JPY experienced a downturn, hovering at 96.18 after hitting a its lowest level since mid December near 95.50. The daily chart conveys a bearish hue with the sellers gaining substantial ground. Meanwhile, the four-hour chart indicators seem to have enter in a consolidation phase, following a dip into oversold territories.
In the daily chart perspective, the leading indicators signal an inclined selling momentum. The Relative Strength Index (RSI) is charting a downward trajectory indicating bearish strength, especially within a negative zone. This is echoed by the Moving Average Convergence Divergence (MACD) which prints a surge in red bars, indicating increasing bearish pressure. Furthermore, the cross fell below the 100-day Simple Moving Average (SMA), a strong resistance which strengthens the case for the sellers .
Inspecting the shorter-term dynamics from the four-hour chart, it appears the bearish tendency seems to be leveling off. Indicators have moved to a stable phase after previously registering oversold conditions. The RSI in particular, maintains a flat formation in a negative territory, indicating a momentary pause in downward momentum. Additionally, the MACD also show flat red bars indicating growth in short-term selling pressure, though at a decreasing rate.
AUD/JPY daily chart
AUD/JPY levels to watch
-
01.02.2024 04:41AUD/JPY drops to four-week low, bears look to seize control below 100-day SMA
- AUD/JPY drifts lower for the third straight day and seems vulnerable to sliding further.
- Softer domestic inflation lifts August RBA rate cut bets and undermines the Aussie.
- The BoJ’s hawkish tilt, along with geopolitics, benefits the JPY and exerts pressure.
The AUD/JPY cross remains under some selling pressure for the third straight day on Thursday and drops to a nearly one-month low, during the Asian session. Spot prices currently trade around the 96.20-96.15 area, with bears now looking to extend the downward trajectory further below the 100-day Simple Moving Average (SMA).
The Australian Dollar (AUD) continues to be undermined by softer domestic consumer inflation figures released on Wednesday, which reaffirmed expectations that the Reserve Bank of Australia's (RBA) tightening cycle is over. In contrast, the Bank of Japan (BoJ) last week signalled that conditions for phasing out huge stimulus and pulling short-term rates out of negative territory were falling into place. This, along with the risk of a major escalation of geopolitical tensions in the Middle East, turns out to be a key factor behind the safe-haven Japanese Yen's (JPY) relative outperformance and exerts downward pressure on the AUD/JPY cross.
Bulls, meanwhile, seem rather unimpressed by a private-sector survey, which showed that China's factory activity expanded at a steady pace for the third straight month in January. In fact, China's Caixin Manufacturing PMI remains unchanged at 50.8 in January as compared to market expectations for a downtick to 50.6. This, however, does little to benefit the China-proxy Aussie. Apart from this, weakness below the 100-day SMA suggests that the path of least resistance for the AUD/JPY cross is to the downside. Hence, a subsequent decline back towards retesting the YTD trough, around the 95.85 region, now looks like a distinct possibility.
Technical levels to watch
-
31.01.2024 18:45AUD/JPY Price Analysis: Bears gain ground and conquer the 20-day SMA
- AUD/JPY making a decisive downshift with a 0.95% drop, currently stationed at 96.50.
- As the bears push the cross below the 20-day SMA, the outlook turned negative for the cross.
- Despite recent bearish activities, pair remains above both 100 & 200-day SMAs, signalling an overall bullish trend.
In Wednesday's trading session, the AUD/JPY fell to 96.50 after a strong 0.95% decline. The daily chart outlook for the pair appears neutral to bearish, indicative of bears gaining ground. Reinforcing this sentiment, the four-hour chart also leaned towards the bearish side with indicators near the oversold zone.
The daily Relative Strength Index (RSI) shows a downward inclination yet remaining in the positive region, indicating slight selling pressure as well as the rising red bars of the Moving Average Convergence Divergence (MACD). Furthermore, the bears have made an apparent show of power, pushing the cross price below its 20-day Simple Moving Averages (SMA). However, the AUD/JPY remains firm on higher ground, as demonstrated by its position above both the 100 and 200-day SMAs. This solidifies the notion that despite recent bearish challenges, the overall buying force still commands the roost.
Switching to a shorter time frame, the four-hour outlook seems to be also favoring a bearish narrative for the moment. Technical indicators appear oversold, reflecting a growing bearish bias among traders. Simultaneously, the Relative Strength Index (RSI) is on the cusp of the oversold threshold, while the Moving Average Convergence Divergence (MACD) exhibits rising red bars, another pointer to the growing clout of bears in the short-term.
AUD/JPY daily chart
-638423234426074039.png)
AUD/JPY levels to watch
-
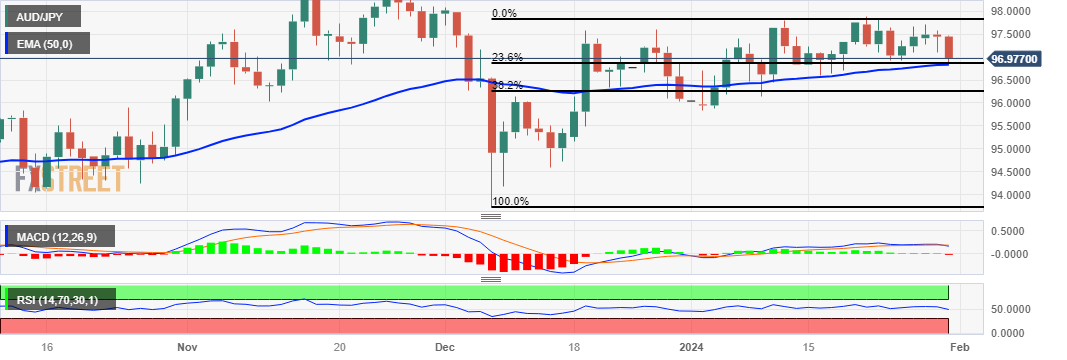
31.01.2024 05:57AUD/JPY Price Analysis: Extends losses to near 97.00 before the support at 23.6% Fibonacci
- AUD/JPY could move downward toward the 23.6% Fibonacci retracement at 96.85.
- The lagging indicator MACD suggests a tepid momentum for the cross.
- A collapse below the 50-day EMA could lead the cross to approach the support zone near the 38.2% Fibonacci retracement at the 96.26 level.
AUD/JPY moves in a downward direction for the second successive day, trading lower around 97.00 during the Asian session on Wednesday. The Australian Dollar (AUD) faces a challenge after the softer consumer inflation data released earlier in the day.
The immediate support appears at 23.6% Fibonacci retracement at 96.85 lined up with the 50-day Exponential Moving Average (EMA) at 96.83. A firm break below the 50-day EMA could put downward pressure on the AUD/JPY cross to approach the major support at the 96.50 level followed by the 38.2% Fibonacci retracement at the 96.26 level.
The technical analysis of the AUD/JPY cross involves examining various indicators. The 14-day Relative Strength Index (RSI), a lagging indicator, is below the 50 level, suggesting a selling pressure and a bearish momentum for the pair.
On the other hand, the Moving Average Convergence Divergence (MACD) for the pair shows tepid momentum in the market. The MACD line is positioned above the centerline but below the signal line. Traders could await confirmation from the MACD indicator before determining the direction of the AUD/JPY cross.
On the upside, the AUD/JPY cross could find the key barrier at 97.50 followed by the weekly high at 97.69. A breakthrough above the latter could prompt the upward sentiment and lead the pair to test the monthly high at 97.88 and the psychological resistance at 98.00 level.
AUD/JPY: Daily Chart
-
30.01.2024 19:52AUD/JPY Price Analysis: Bulls defend the 20-day SMA, bears are around the corner
- AUD/JPY currently facing minor losses, standing strong at 97.45 after hitting a low of 96.85.
- The cross faced losses following the release of weak Australian Retail Sales figures from December.
- Bulls display resilience but the bears are slowly building momentum.
In Tuesday's session, the AUD/JPY pair was observed at the 97.45 level, recording mild losses but recovering from a low of 96.85 as the Aussie weakened following the release of soft Retail Sales figures. The broader outlook on the daily chart showcased bullish dominance, with the bulls determinedly holding their ground. Meanwhile, the four-hour chart indicated a rapid recovery by the buyers, reaffirming the prevalent bullish sentiment.
Weak December Retail Sales underscore sluggish Australian economic momentum, but markets still only discount a 10% chance of a 25 bps rate cut from the Reserve Bank of Australia (RBA) in February. Meanwhile, mixed labor market figures in Japan including falling unemployment rate and job-to-applicant ratio, gives little impetus for Bank of Japan (BoJ) to rush in pivoting its monetary policy, with market expectations suggesting a June liftoff.
AUD/JPY levels to watch
The indicators on the daily chart are indicating a subtle power of the bulls over the bears. The Relative Strength Index (RSI) is displaying neutrality, situated comfortably in a positive zone. The Moving Average Convergence Divergence (MACD) mirrors this sentiment, with green bars that remain static, neither rising nor falling. That being said, the market sentiment leans slightly in favor of the bulls due to the crosses's position against the Simple Moving Averages (SMAs). Hovering above the 20, 100, and 200-day SMAs, the AUD/JPY displays signs of bullish dominance on a grander scale.
AUD/JPY daily chart
-
29.01.2024 19:31AUD/JPY trades with mild gains, bulls struggle to gain further ground
- The AUD/JPY experiences mild gains, currently standing at 97.40.
- Monetary policy divergences between the RBA and BoJ benefit the AUD.
- Before the RBA meets next week markets will get Retail Sales from December and Q4 CPI.
- The daily chart indicators sends mixed signals with, positive RSI a neutral MACD which suggests stagnant momentum.
On Monday's session, the AUD/JPY was seen trading at 97.40, shedding off mild gains after peaking at a high of 97.75. The overall view on the daily chart suggests a neutral to bullish trend, however, the bulls are facing obstacles in gaining further ground. Conversely, the four-hour outlook indicates bears have started to reign in, transforming the broader aspect of the technical landscape. In that sense, markets remain cautious awaiting further data to place their bets on the next Reserve Bank of Australia (RBA) decisions.
In that sense, RBA’s next week’s rate decision will be pivotal. Governor Bullock warned recently that inflation may take a little longer to normalize which made markets bet on a more aggressive stance so the messaging from the bank will be key. This week, Australia will release December Retail Sales figures from December, and on Wednesday, Q4 Consumer Price Index report, which may also set the pace of the AUD price dynamics.
AUD/JPY levels to watch
The overall view on the daily chart suggests a neutral to bullish trend, however, the bulls are facing obstacles in gaining further ground. The Relative Strength Index (RSI) is painting a positive picture given its upward tilt in the positive territory, indicating a strong buying momentum persisting in the market. However, the Moving Average Convergence Divergence (MACD) showing flat green bars signifies that the bullish sentiment is still dominant but that it is running out of steam. That being said, the pair’s positioning above all the 20,100, and 200-day Simple Moving Averages (SMAs), suggests a bullish inclination in the broader frame, despite the bulls struggling to gain additional ground recently.
Assessing from the short-term four-hour chart, a slightly contrary momentum is noticed. The bears seem to be gradually gaining some strength, making their presence felt. The four-hour RSI is sliding in the positive territory, indicating a potential shift towards a selling momentum, although it's in early stages. The MACD depicting flat green bars confirms that the bulls momentum is waning. Nevertheless, the subtle shift suggests that the buyers need to be cautious as the shorter time frame may be hinting towards a possible change in momentum.
AUD/JPY daily chart
-
26.01.2024 19:13AUD/JPY Price Analysis: Bulls hold the fort despite closing a losing week
- The AUD/JPY stands strong at around 97.45, flaunting a gain of 0.25%.
- Despite the upwards movements, the cross will still close a 0.20% weekly loss.
- An optimistic scenario is reflected in larger time frames with the pair trading above the 20,100,200-day SMAs.
On Friday's session, the AUD/JPY was trading at 97.45, up by 0.25%. The daily chart shows a neutral to bullish sentiment, with bulls keenly holding their ground while the four-hour outlook mirrors the daily one, with a predominant bullish presence.
The indications on the daily chart reflect a sideway move with a slight bullish inclination. A surge is suggested by the Relative Strength Index (RSI) with a positive slope and lies in positive space, indicating that the buying strength still holds the upper hand. Yet, the Moving Average Convergence Divergence (MACD) showing static green bars suggests a lack of momentum for further bullish advancement. However, positioning above the 20, 100, and 200-day Simple Moving Averages (SMAs) solidifies the evidence that bulls dominate in the long-run realm, even with the weekly retracement.
The four-hour chart, it echoes a similar sentiment. The Relative Strength Index (RSI), still in positive territory and on an upward bend hints at the continued presence of bullish momentum. In the meanwhile, the Moving Average Convergence Divergence (MACD) laying flat with red bars could point to a short-term pullback or consolidation period. Nonetheless, the bulls' persistence indicates that the uptrend may continue in the following trading sessions, assuming that buying pressure remains.
AUD/JPY levels to watch
AUD/JPY daily chart

-
25.01.2024 19:31AUD/JPY Price Analysis: Bulls in command despite short-term lag, bears consolidate losses
- The AUD/JPY is recording gains, standing firmly above major SMAs overall but exhibits short-term bearish sentiment.
- Key indicators like RSI and MACD on daily chart imply ambiguity but lean towards the bullish side.
- The four-hour chart reflects continued bearish momentum, but with bears taking a break from Wednesday’s losses.
In Thursday's session, the AUD/JPY was spotted at 97.20, benefitting from 0.25% gains. Following a sharp 0.60% decline the previous day, sellers maintain their presence though seem to be on pause, rendering the daily chart outlook as neutral to bullish. Yet, the four-hour chart reveals persisting bearish momentum, that there may be further downside on the horizon.
In light of the technical indicators on the daily chart, the overall tone for the currency pair is in favor of the buyers. The Relative Strength Index (RSI) show a positive bias with an upward trajectory within a bullish territory. Meanwhile, the Moving Average Convergence Divergence (MACD) sporting green bars indicate a flat bullish momentum. Moreover, the pair's position above the 20,100,200-day Simple Moving Averages (SMAs) underscores the domination of bullish traders in the broader scheme. However, it's noteworthy that despite displaying this somewhat optimistic landscape, bears seem to be taking a breather after losing more than 0.60% on Wednesday.
Shifting focus to the shorter-time frame, the momentum appears to be siding with the sellers. This negative momentum is clearly visible in the four-hour chart, which demonstrates a downward slope of the Relative Strength Index (RSI)–a sign of increased selling pressure. Despite the Moving Average Convergence Divergence (MACD) showing flat green bars which generally indicates bullish momentum, in this context parallel with a declining RSI, it seems to be more indicative of a temporarily stalled bearish momentum. In summary, the current technical landscape suggests bears are still persistently at play in the short-term, likely to resume their activity shortly.
AUD/JPY technical levels
AUD/JPY daily chart
-638418078374256106.png)
-
24.01.2024 19:20AUD/JPY Price Analysis: Bears advances after S&P PMIs, BoJ decision
- AUD/JPY trades at 97.12 with 0.40% losses.
- Daily chart indicators reveal sellers hold the momentum, in the immediate short term.
- Australian S&P PMIs were weak in January while the Japanese indexes were positive.
On Wednesday's session, the AUD/JPY finds itself trading near the 97.12 mark, registering a 0.45% decline. The currency pair's daily chart portrays a neutral to bearish outlook, with bears slowly gaining control. Meanwhile, signs of a negative stance are more pronounced as we glance at the four-hour chart. In that sense, the sellers recently gained ground on the back of the Bank of Japan’s hints on a potential pivot and positive economic figures from Japan.
In that sense, the Australian economy, as indicated by the preliminary S&P January PMIs, seems to be on a sluggish note, as the composite PMI has been below 50 for four consecutive months. On the other hand, the Japanese economy appears to be resilient with firm January PMIs across both manufacturing and services, in addition to robust December trade data. Moreover, the JPY seems to be finding demand as the expectations for the BoJ have shifted towards a potential rate increase around mid-year, as on Tuesday’s decision, Governor Ueda hinted that inflation seems to be aligning with the bank’s goal.
AUD/JPY daily chart
The indicators on the daily chart are currently portraying a diverse scenario. With the Relative Strength Index (RSI) in positive territory yet on a downward slope, there is an indication of weakening bullish momentum. Furthermore, diminishing green bars in the Moving Average Convergence Divergence (MACD) histogram reinforce this interpretation. However, the positioning above the essential Simple Moving Averages (SMAs) of 20, 100, and 200-day averages, acknowledge the dominant control of buyers over the extended trend.
A negative outlook is more pronounced on the four-hour charts. Here, the declining slope of the RSI reveals a strong bearish undercurrent, already in negative territory aligning with the falling green bars of the MACD.
AUD/JPY daily chart
-
23.01.2024 07:05AUD/JPY Price Analysis: Loses ground below the mid-97.00s following BOJ's Ueda comments
- AUD/JPY loses traction to 97.30 following the BoJ’s Ueda comments.
- The cross keeps the bullish vibe above the key EMA.
- The immediate resistance level will emerge at 97.76; the initial support level for AUD/JPY is seen at 97.24.
The AUD/JPY cross loses its recovery momentum during the early European session on Tuesday. The Japanese Yen (JPY) attracts some buyers following the Bank of Japan (BoJ) Governor Kazuo Ueda's speech. AUD/JPY currently trades near 97.30, up 0.01% on the day.
After the BoJ decided to maintain the policy settings and forward guidance unchanged at the January policy meeting, BoJ Governor Kazuo Ueda stated that the likelihood of achieving the 2% inflation target is rising gradually. He further added that the central bank must continue to monitor financial and foreign exchange market moves and their impact on prices and the economy.
Technically, the bullish outlook of AUD/JPY remains intact as the cross holds above the 50- and 100-period Exponential Moving Averages (EMA) with an upward slope on the four-hour chart. The upward momentum is supported by the Relative Strength Index (RSI) which stands above the 50-midline, indicating further upside looks favorable.
The immediate resistance level will emerge near a high of January 19 at 97.76. Any follow-through buying above the latter will see a rally to the upper boundary of the Bollinger Band at 97.90. Further north, the next hurdle is seen at a high of November 28 at 98.38, followed by a high of November 24 at 98.50.
On the flip side, the initial support level for AUD/JPY is seen at the 50-period EMA at 97.24. The key contention level for the cross is located in the 97.00–97.05 region, representing the confluence of the 100-period EMA and the limit of the Bollinger Band. The additional downside filter to watch is a low of January 18 at 96.83, en route to a low of January 16 at 96.60.AUD/JPY four-hour chart
-638415902868757781.png)
-
22.01.2024 19:58AUD/JPY Price Analysis: Bearish-engulfing candle emerges, sellers eye 97.00
- AUD/JPY's daily chart hints at a downtrend; Tenkan-Sen at 97.16 is key for bulls.
- Breaking below 97.00 could see AUD/JPY test supports at 96.73, 96.31, 96.14, then 96.00.
- Staying above 97.00, AUD/JPY eyes 97.88, 98.00, with further resistances at 98.58, 99.00.
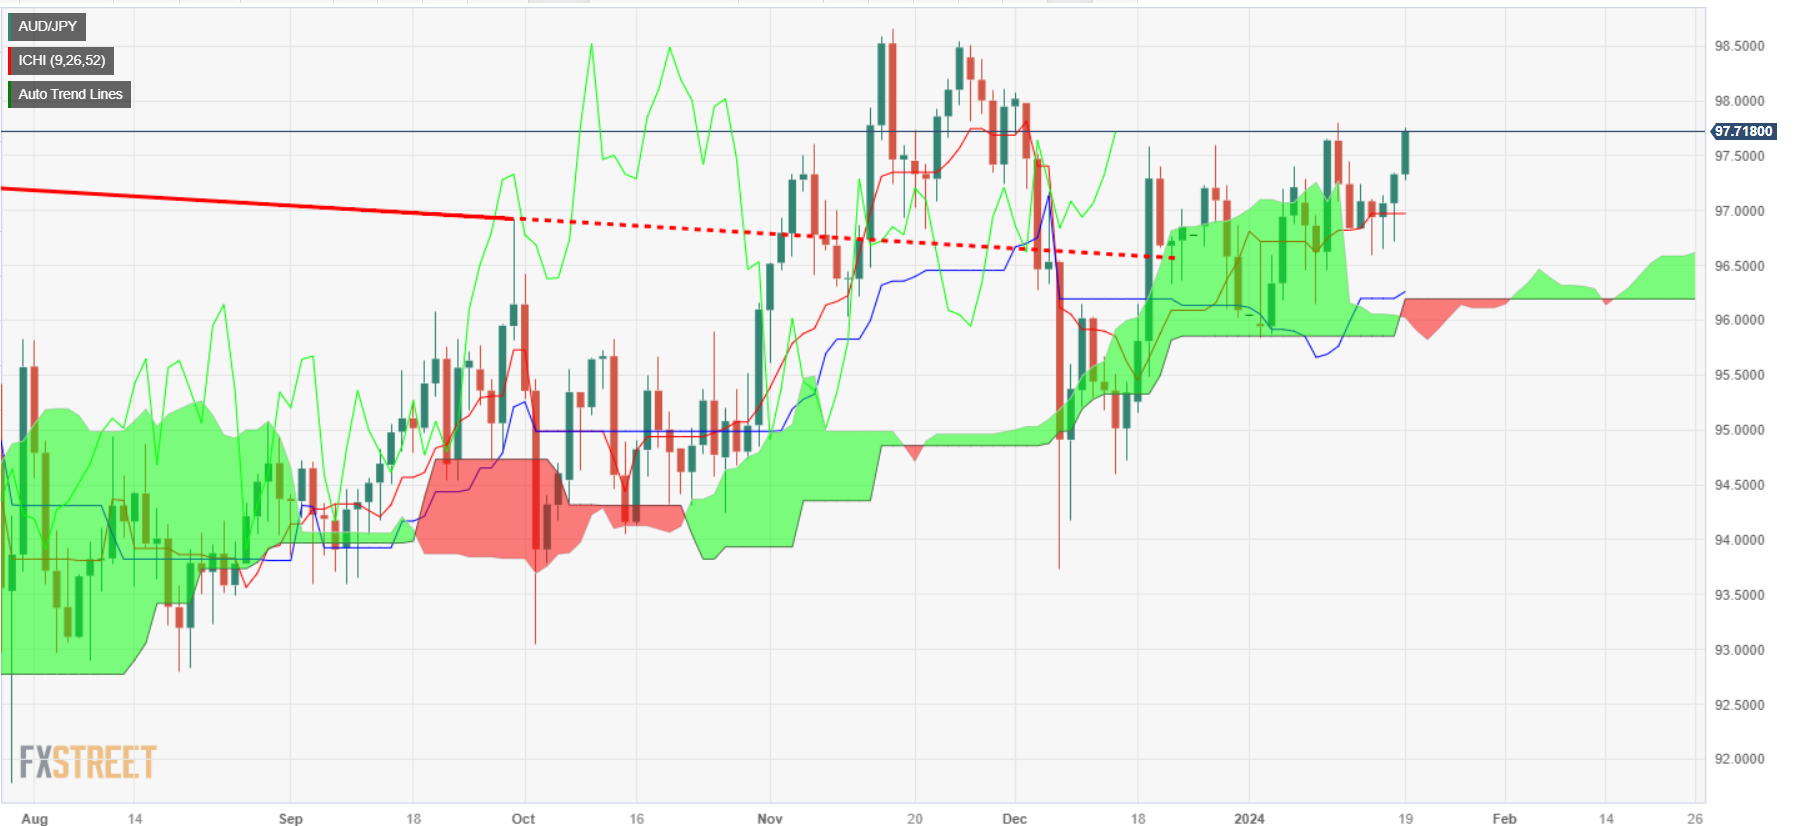
The AUD/JPY reverses its course late in the North American session amid an upbeat market mood, which usually underpins risk-perceived currencies like the Aussie Dollar’s (AUD). Nevertheless, the Bank of Japan’s monetary policy decision, looming, keeps the Japanese Yen (JPY) in the driver’s seat, as the AUD/JPY exchanges hands at 97.28, down by 0.42%.
A ‘bearish-engulfing’ cancel chart pattern is emerging in the daily chart, suggesting the AUD/JPY might register a leg-down in the near term but it will find buyers at the Tenkan-Sen at 97.16, the first line of defense for bulls. If sellers take that level and push prices below the 97.00 figure, that will exacerbate further losses. The next support would be the Senkou Span A at 96.73, the Kijun-Sen at 96.31, and the Senkou Span B at 96.14. After that, sellers will encounter the 96.00 figure.
Conversely if AUD/JPY buyers keep the exchange rate from falling below the 97.00 figure, further upside is seen at 97.88, the January 22 high, ahead of the 98.00 mark. A breach of the latter will expose the November 15 high at 98.58, followed by the 99.00 figure.
AUD/JPY Price Action – Daily Chart
AUD/JPY Technical Levels
-
19.01.2024 19:44AUD/JPY Price Analysis: Surges to six-day high amid risk-on sentiment
- AUD/JPY rises late in the session, supported by a risk-on sentiment fueled by Wall Street's advance.
- Buyers in control as the pair surpasses 97.00, aiming for a daily close above 98.00 for further gains.
- Despite the ascent, pullback risks persist; sellers may target levels below 97.00 for bearish momentum.
AUD/JPY edges higher late in Friday’s North American session, sponsored by a risk-on impulse, as the advance in Wall Street could appreciate it. Therefore, safe-haven peers are pressured while US Treasury yields retrace, a tailwind for riskier assets. At the time of writing, the AUD/JPY exchanged hands at 97.79, printing a new six-day high.
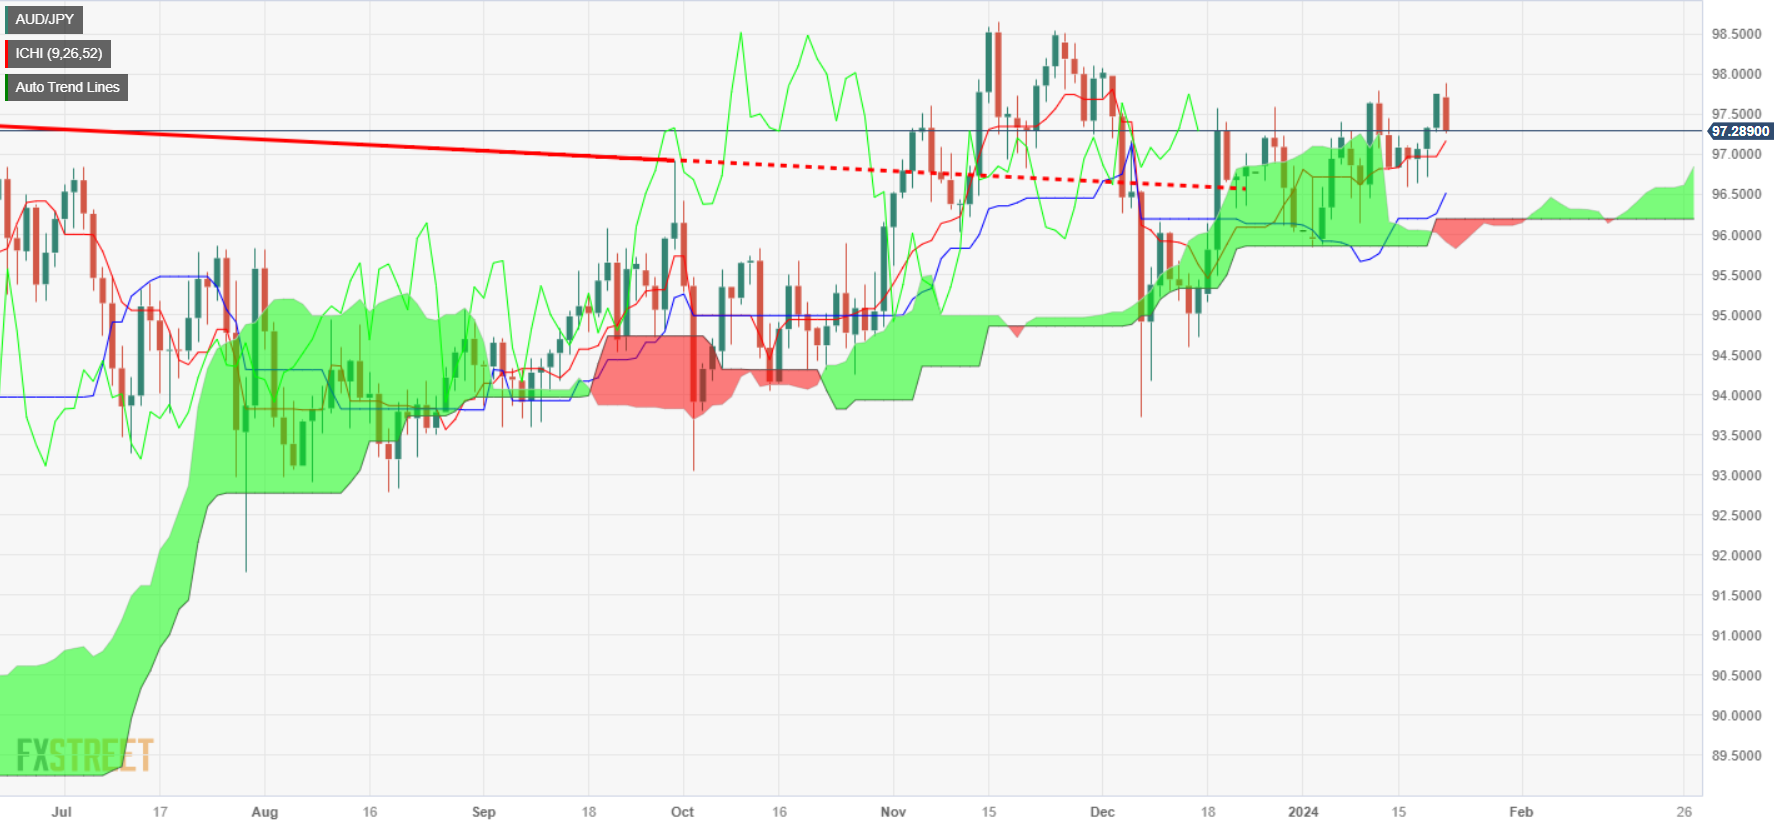
The pair began the week at around the lows of the week, below the Tenkan-Sen, but the AUD/JPY exchange rate was already above the Ichimoku Cloud (Kumo), suggesting that buyers were in charge. Consequently, they reclaimed 97.00 and, on Friday, extended its gains. Still, pullback risks remain, as buyers need a daily close above the 98.00 figure so they can remain hopeful of testing last year’s high of 98.58. Once those levels are surpassed, the next stop would be the 99.00 figure.
For a bearish case, sellers need to drive prices below 97.00, through the Tenkan Sen at 96.97, toward the January 16 low of 96.58. A breach of the latter will expose the Kijun-Sen at 96.18, ahead of the Senkou Span B and A, each at 96.14 and 96.01.
AUD/JPY Price Action – Daily Chart
AUD/JPY Key Technical Levels
-
18.01.2024 20:11AUD/JPY Price Analysis: Climbs above 97.00 on risk appetite improvement, buyers eye 98.00
- AUD/JPY climbs to 97.27, fueled by positive risk appetite, despite Australia's weak jobs report.
- Bullish technical outlook as pair surpasses Ichimoku Cloud, aiming for 97.79 resistance.
- Downside risks for AUD/JPY below 97.00, with supports at 96.64, 96.58, and critical 96.00 level.
The Aussie Dollar (AUD) extended its gains against the Japanese Yen (JPY) for the second straight day as risk appetite improved, although soft jobs data from Australia might deter the Reserve Bank of Australia (RBA) from tightening monetary policy. At the time of writing, the AUD/JPY trades at 97.27, up 0.25%, on the day.
Therefore, from a technical standpoint, the AUD/JPY is upward biased once it has broken above the Ichimoku Cloud (Kumo), which has cleared the path to challenge the next cycle high seen at 97.79, the January 11 high. Once cleared, buyers could test the 98.00 figure, ahead of the November 24 high at 98.54.
On the other hand, if bears drag prices below the 97.00 figure, that could open the door for further losses. The first support would be the January 17 low of 96.64, followed by the January 16 low of 96.58. The next support would be the 96.00 figure.
AUD/JPY Price Action – Daily Chart
AUD/JPY Key Technical Levels


© 2000-2024. All rights reserved.
This site is managed by Teletrade D.J. LLC 2351 LLC 2022 (Euro House, Richmond Hill Road, Kingstown, VC0100, St. Vincent and the Grenadines).
The information on this website is for informational purposes only and does not constitute any investment advice.
The company does not serve or provide services to customers who are residents of the US, Canada, Iran, The Democratic People's Republic of Korea, Yemen and FATF blacklisted countries.
Making transactions on financial markets with marginal financial instruments opens up wide possibilities and allows investors who are willing to take risks to earn high profits, carrying a potentially high risk of losses at the same time. Therefore you should responsibly approach the issue of choosing the appropriate investment strategy, taking the available resources into account, before starting trading.
Use of the information: full or partial use of materials from this website must always be referenced to TeleTrade as the source of information. Use of the materials on the Internet must be accompanied by a hyperlink to teletrade.org. Automatic import of materials and information from this website is prohibited.
Please contact our PR department if you have any questions or need assistance at pr@teletrade.global.
transfers