- Analytics
- News and Tools
- Market News
CFD Markets News and Forecasts — 15-02-2018
(raw materials / closing price /% change)
Oil 61.42 +1.35%
Gold 1,356.30 -0.13%
(index / closing price / change items /% change)
Nikkei +310.81 21464.98 +1.47%
TOPIX +16.55 1719.27 +0.97%
Euro Stoxx 50 +19.80 3389.63 +0.59%
FTSE 100 +20.84 7234.81 +0.29%
DAX +7.01 12346.17 +0.06%
CAC 40 +57.26 5222.52 +1.11%
DJIA +306.88 25200.37 +1.23%
S&P 500 +32.57 2731.20 +1.21%
NASDAQ +112.82 7256.43 +1.58%
S&P/TSX +79.39 15407.66 +0.52%
(pare/closed(GMT +2)/change, %)
EUR/USD $1,2506 +0,45%
GBP/USD $1,4099 +0,72%
USD/CHF Chf0,92187 -0,79%
USD/JPY Y106,14 -0,82%
EUR/JPY Y132,75 -0,36%
GBP/JPY Y149,647 -0,09%
AUD/USD $0,7945 +0,26%
NZD/USD $0,7407 +0,58%
USD/CAD C$1,24803 -0,08%
00:00 China Bank holiday
00:30 Australia New Motor Vehicle Sales (YoY) January 6.7%
00:30 Australia New Motor Vehicle Sales (MoM) January 4.5%
09:30 United Kingdom Retail Sales (YoY) January 1.4% 0.9%
09:30 United Kingdom Retail Sales (MoM) January -1.5% 1.5%
13:30 Canada Foreign Securities Purchases December 19.56
13:30 Canada Manufacturing Shipments (MoM) December 3.4% -0.1%
13:30 U.S. Building Permits January 1.300 1.3
13:30 U.S. Housing Starts January 1.192 1.215
13:30 U.S. Import Price Index January 0.1% 0.5%
15:00 U.S. Reuters/Michigan Consumer Sentiment Index (Preliminary) February 95.7 95.5
18:00 U.S. Baker Hughes Oil Rig Count February 791
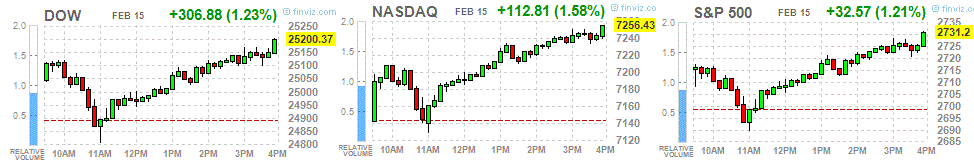
Major US stock indexes finished trading in positive territory, as the rise in price of shares in the technology sector and the utilities sector compensated for the losses in the shares of the base materials sector.
A certain influence on the dynamics of trading was also provided by the US data. The Ministry of Labor reported that US producer prices rose in January, which was the last indicator of an increase in inflationary pressures in the economy. The producer price index, a measure of prices charged by companies for their goods and services, increased by 0.4% in seasonally adjusted terms in January, compared with a month earlier. This was in line with the expectations of economists. In annual terms, producer prices rose by 2.7%. Producer prices were unchanged in December, showed revised data. Until this month, prices have been growing steadily in the second half of 2017. With the exception of food and energy categories, prices rose 0.4% in January. With the exception of the unstable category of trade services, prices also increased by 0.4%, which is the highest growth since April 2017. The growth was expected to be 0.2% for both major measures. A separate report from the Ministry of Labor. showed that the number of Americans applying for new unemployment benefits rose last week, but remained close to historical lows. Initial applications for unemployment benefits, an indicator of layoffs across the United States, increased by 7,000 to 230,000 for the week ending February 10. This was in line with the expectations of economists. Weekly applications for unemployment benefits were held below 300,000 for almost three years, the longest period since 1970, when the US population was much smaller than today. Data on applications for unemployment benefits can be unstable from week to week. The four-week moving average, a more stable measure, increased by 3,500 to 228,500 last week. The number of repeated applications for unemployment benefits increased by 15,000 to 1,942,000 in the week to February 3.
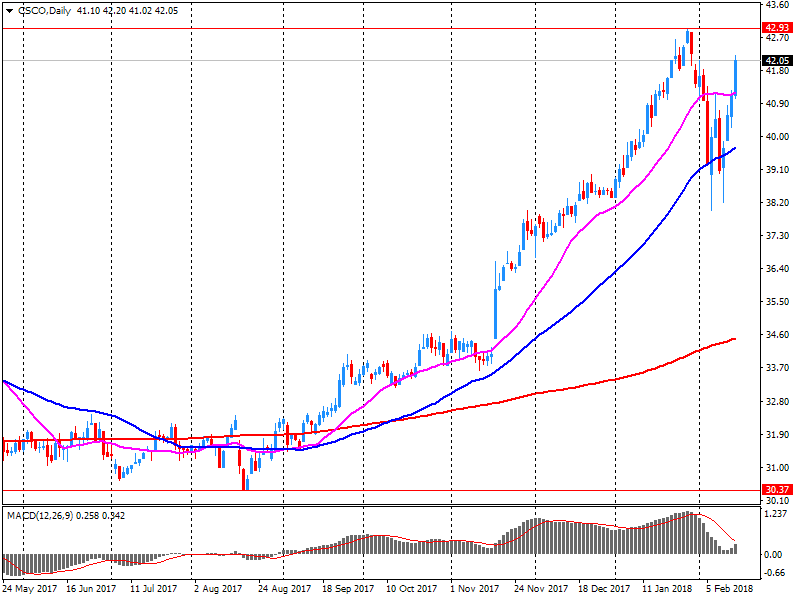
Most components of the DOW index finished trading in positive territory (26 out of 30). Leader of the growth were shares of Cisco Systems, Inc. (CSCO, + 4.73%). Outsider were shares UnitedHealth Group Incorporated (UNH, -1.33%).
Almost all sectors of S & P recorded a rise. The utilities sector grew most (+ 1.7%). Decrease showed only the sector of basic materials (-0.1%).
At closing:
Dow + 1.23% 25,200.37 +306.88
Nasdaq + 1.58% 7,256.43 +112.82
S & P + 1.21% 2.731.20 +32.57
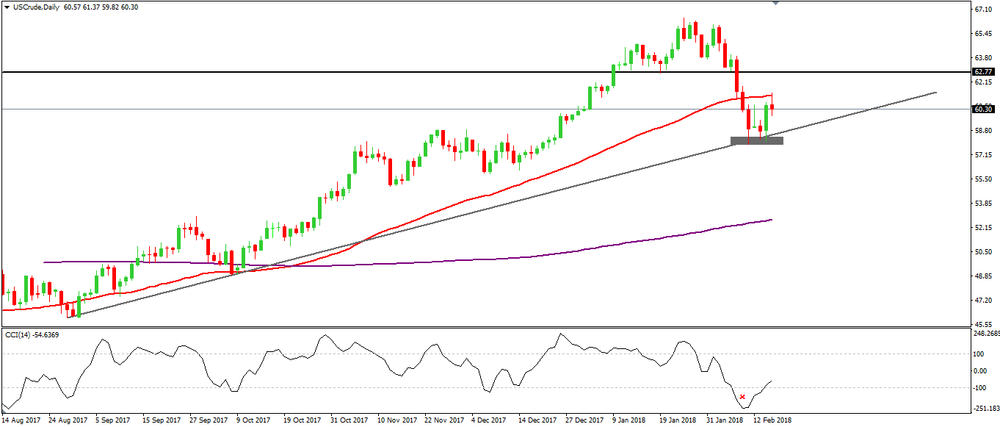
On daily time frame chart, we can see that the price is giving signals of rejections of more downside movements.
If we look to CCI indicator we can see that the price is "oversold" and when it breaks the EMA 50 we might have an opportunity to go long again on Crude oil
U.S. stock-index futures rose on Thursday shrugged off concerns that the Fed would quicken its pace of monetary tightening following hotter-than-expected January CPI reading.
Global Stocks:
Nikkei 21,464.98 +310.81 +1.47%
Hang Seng 31,115.43 +599.83 +1.97%
Shanghai -
S&P/ASX 5,909.00 +67.80 +1.16%
FTSE 7,239.70 +25.73 +0.36%
CAC 5,237.08 +71.82 +1.39%
DAX 12,412.12 +72.96 +0.59%
Crude $60.42 (-0.30%)
Gold $1,355.20 (-0.21%)
Industrial production edged down 0.1 percent in January following four consecutive monthly increases. Manufacturing production was unchanged in January. Mining output fell 1.0 percent, with all of its major component industries recording declines, while the index for utilities moved up 0.6 percent. At 107.2 percent of its 2012 average, total industrial production was 3.7 percent higher in January than it was a year earlier.
Capacity utilization for the industrial sector fell 0.2 percentage point in January to 77.5 percent, a rate that is 2.3 percentage points below its long-run (1972-2017) average.
Employment in Canada increased by 10,700 jobs from December to January according to the January ADP Canada National Employment Report.
"Hiring in Canada is off to a good start for 2018," said Ahu Yildirmaz, vice president and co-head of the ADP Research Institute. "Although we saw losses in education and finance, there were strong gains in construction and leisure and hospitality. Construction job growth is likely driven by the record number of housing units currently under construction. The leisure and hospitality industry is growing to meet the needs of consumers and international tourists."
In the week ending February 10, the advance figure for seasonally adjusted initial claims was 230,000, an increase of 7,000 from the previous week's revised level. The previous week's level was revised up by 2,000 from 221,000 to 223,000. The 4-week moving average was 228,500, an increase of 3,500 from the previous week's revised average. The previous week's average was revised up by 500 from 224,500 to 225,000.
The Producer Price Index for final demand increased 0.4 percent in January, seasonally adjusted, the U.S. Bureau of Labor Statistics reported today. Final demand prices were unchanged in December and moved up 0.4 percent in November. On an unadjusted basis, the final demand index rose 2.7 percent for the 12 months ended in January.
In January, the rise in the index for final demand is attributable to a 0.3-percent increase in prices for final demand services and a 0.7-percent advance in the index for final demand goods.
The index for final demand less foods, energy, and trade services rose 0.4 percent in January, the largest advance since increasing 0.5 percent in April 2017. For the 12 months ended in January, prices for final demand less foods, energy, and trade services moved up 2.5 percent, the largest rise since 12-month percent change data were available in August 2014.
(company / ticker / price / change ($/%) / volume)
| 3M Co | MMM | 232.3 | 1.66(0.72%) | 3642 |
| ALCOA INC. | AA | 48.99 | 0.45(0.93%) | 2876 |
| ALTRIA GROUP INC. | MO | 65.33 | 0.15(0.23%) | 646 |
| Amazon.com Inc., NASDAQ | AMZN | 1,463.78 | 12.73(0.88%) | 119475 |
| American Express Co | AXP | 96.96 | 0.73(0.76%) | 1746 |
| AMERICAN INTERNATIONAL GROUP | AIG | 59.75 | 0.34(0.57%) | 844 |
| Apple Inc. | AAPL | 169.5 | 2.13(1.27%) | 524760 |
| AT&T Inc | T | 36.52 | 0.11(0.30%) | 24004 |
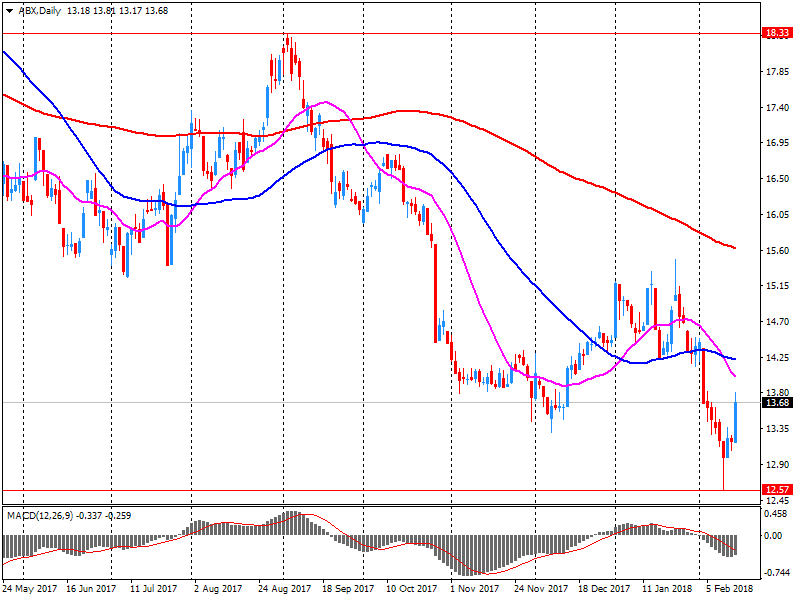
| Barrick Gold Corporation, NYSE | ABX | 13.7 | 0.05(0.37%) | 15272 |
| Boeing Co | BA | 348.1 | 3.25(0.94%) | 24220 |
| Caterpillar Inc | CAT | 159.32 | 1.26(0.80%) | 8984 |
| Chevron Corp | CVX | 112.91 | 0.40(0.36%) | 1620 |
| Cisco Systems Inc | CSCO | 45.23 | 3.14(7.46%) | 591433 |
| Citigroup Inc., NYSE | C | 77.25 | 0.54(0.70%) | 24048 |
| Deere & Company, NYSE | DE | 165 | 1.72(1.05%) | 3388 |
| Exxon Mobil Corp | XOM | 76.76 | 0.30(0.39%) | 7502 |
| Facebook, Inc. | FB | 180.5 | 0.98(0.55%) | 183151 |
| Ford Motor Co. | F | 10.8 | 0.06(0.56%) | 24137 |
| Freeport-McMoRan Copper & Gold Inc., NYSE | FCX | 19.24 | 0.12(0.63%) | 40281 |
| General Electric Co | GE | 14.99 | 0.09(0.60%) | 122165 |
| General Motors Company, NYSE | GM | 42 | 0.19(0.45%) | 1864 |
| Goldman Sachs | GS | 264.85 | 2.27(0.86%) | 7017 |
| Google Inc. | GOOG | 1,076.89 | 7.19(0.67%) | 15641 |
| Hewlett-Packard Co. | HPQ | 21.58 | 0.29(1.36%) | 1130 |
| Home Depot Inc | HD | 185.7 | 1.01(0.55%) | 6133 |
| HONEYWELL INTERNATIONAL INC. | HON | 151.8 | 1.42(0.94%) | 1619 |
| Intel Corp | INTC | 45.73 | 0.35(0.77%) | 73335 |
| International Business Machines Co... | IBM | 155.5 | 0.74(0.48%) | 22607 |
| Johnson & Johnson | JNJ | 130.45 | 0.78(0.60%) | 3723 |
| JPMorgan Chase and Co | JPM | 116 | 0.97(0.84%) | 21860 |
| McDonald's Corp | MCD | 160.79 | 0.80(0.50%) | 3842 |
| Merck & Co Inc | MRK | 55.37 | 0.47(0.86%) | 1046 |
| Microsoft Corp | MSFT | 91.23 | 0.42(0.46%) | 38361 |
| Nike | NKE | 68.07 | 0.11(0.16%) | 1710 |
| Pfizer Inc | PFE | 35.4 | 0.21(0.60%) | 22460 |
| Procter & Gamble Co | PG | 81.16 | 0.48(0.59%) | 5049 |
| Starbucks Corporation, NASDAQ | SBUX | 56.31 | 0.32(0.57%) | 1291 |
| Tesla Motors, Inc., NASDAQ | TSLA | 324.1 | 1.79(0.56%) | 19605 |
| The Coca-Cola Co | KO | 44.36 | 0.26(0.59%) | 8080 |
| Travelers Companies Inc | TRV | 141.68 | 1.08(0.77%) | 634 |
| Twitter, Inc., NYSE | TWTR | 33.96 | 0.21(0.62%) | 116041 |
| United Technologies Corp | UTX | 126.62 | 0.62(0.49%) | 2800 |
| UnitedHealth Group Inc | UNH | 230 | 1.22(0.53%) | 1436 |
| Verizon Communications Inc | VZ | 49.65 | 0.14(0.28%) | 4115 |
| Visa | V | 121.25 | 0.63(0.52%) | 6626 |
| Wal-Mart Stores Inc | WMT | 102.3 | 0.60(0.59%) | 14306 |
| Walt Disney Co | DIS | 105.28 | 0.68(0.65%) | 4323 |
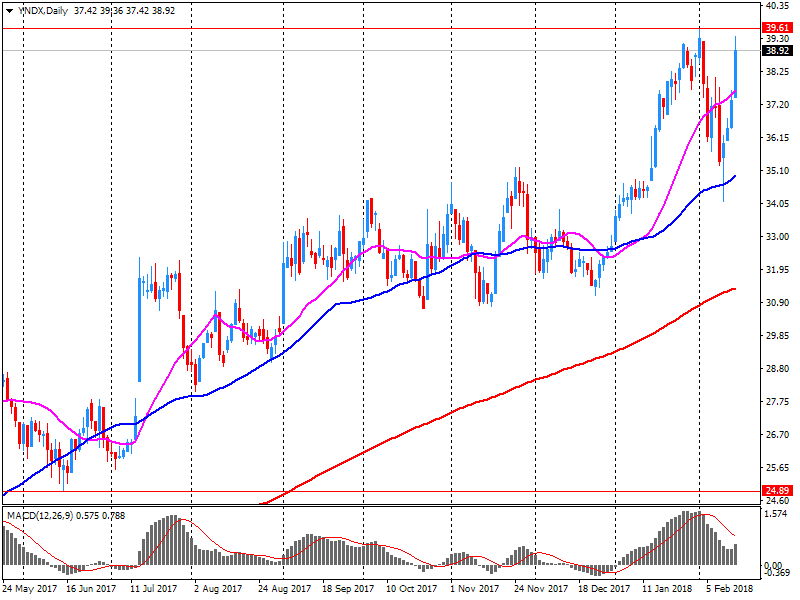
| Yandex N.V., NASDAQ | YNDX | 41.9 | 3.01(7.74%) | 257192 |
General Electric (GE) initiated with Equal Weight at Barclays
3M (MMM) initiated with Underweight at Barclays
United Tech (UTX) initiated with Overweight at Barclays
Сisco Systems (CSCO) target raised to $46 from $40 at Stifel
Yandex N.V. (YNDX) reported Q4 FY 2017 earnings of RUB15.79 per share (versus RUB9.94 in Q4 FY 2016), beating analysts' consensus estimate of RUB14.50.
The company's quarterly revenues amounted to RUB27.860 bln (+26.0% y/y), generally in-line with analysts' consensus estimate of RUB27.576 bln.
YNDX rose to $42.00 (+8.00%) in pre-market trading.
Barrick Gold (ABX) reported Q4 FY 2017 earnings of $0.22 per share (versus $0.22 in Q4 FY 2016), beating analysts' consensus estimate of $0.20.
The company's quarterly revenues amounted to $2.228 bln (-3.9% y/y), generally in-line with analysts' consensus estimate of $2.207 bln.
ABX rose to $13.72 (+0.51%) in pre-market trading.
Cisco Systems (CSCO) reported Q2 FY 2018 earnings of $0.63 per share (versus $0.57 in Q2 FY 2017), beating analysts' consensus estimate of $0.59.
The company's quarterly revenues amounted to $11.887 bln (+2.7% y/y), generally in-line with analysts' consensus estimate of $11.806 bln.
The company also issued upside guidance for Q3, projecting EPS of $0.64-0.66 (versus analysts' consensus estimate of $0.63) at Q3 revenues of ~$12.30-12.54 bln (+3-5% y/y; versus analysts' consensus estimate of $12.13 bln).
Cisco declared a quarterly dividend of $0.33 per common share, up 14% over the previous quarter's dividend, and approved a $25 billion increase to the authorization of the stock repurchase program.
CSCO rose to $45.10 (+7.15%) in pre-market trading.
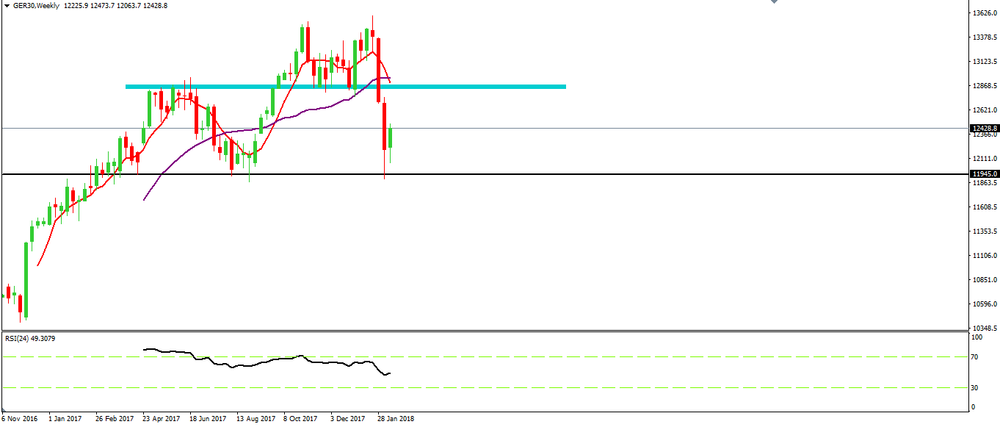
On weekly time frame chart, we can see that the DAX has depreciating for the last two weeks.
At this moment, we can see that the price is showing some signs of rejection new down movements and eventually we might have here a possible new bullish movement.
Also, we can see that there is a chart pattern (head and shoulders) which we cannot confirm yet because of the right shoulder.
Therefore, whether the price confirms the chart pattern or not, we might expect a new bullish movement (recovery by the price) until the blue zone.
The first estimate for euro area (EA19) exports of goods to the rest of the world in December 2017 was €180.7 billion, an increase of 1.0% compared with December 2016 (€179.0 bn). Imports from the rest of the world stood at €155.3 bn, a rise of 2.5% compared with December 2016 (€151.4 bn). As a result, the euro area recorded a €25.4 bn surplus in trade in goods with the rest of the world in December 2017, compared with +€27.6 bn in December 2016. Intra-euro area trade rose to €142.4 bn in December 2017, up by 2.8% compared with December 2016.
In December 2017 seasonally-adjusted data, compared to the previous month, increased both for outgoing flows (+0.6%) and for incoming flows (+3.3%). Exports increased for EU countries (+2.5%) and fell for non EU countries (-1.8%). Imports rose both for EU countries (+4.5%) and non EU countries (+1.6%). Over the last three months, seasonally-adjusted data, compared to the three months earlier, showed an increase for exports (+3.4%) and for imports (+3.3%).
In December 2017, compared with the same month of the previous year, both exports and imports increased (+2.0% and +3.7% respectively). Outgoing flows increased by 2.1% for EU countries and by 1.8% for non EU countries. The growth in purchases is due to the increase for EU area (7.4%) while non EU area decreased by 1.7%. The trade balance in December amounted to +5,253 million Euros (+6,228 million Euros for non EU countries and -974 million Euros for EU countries).
EUR/USD
Resistance levels (open interest**, contracts)
$1.2573 (3749)
$1.2551 (3611)
$1.2518 (4460)
Price at time of writing this review: $1.2487
Support levels (open interest**, contracts):
$1.2403 (483)
$1.2365 (1059)
$1.2340 (2413)
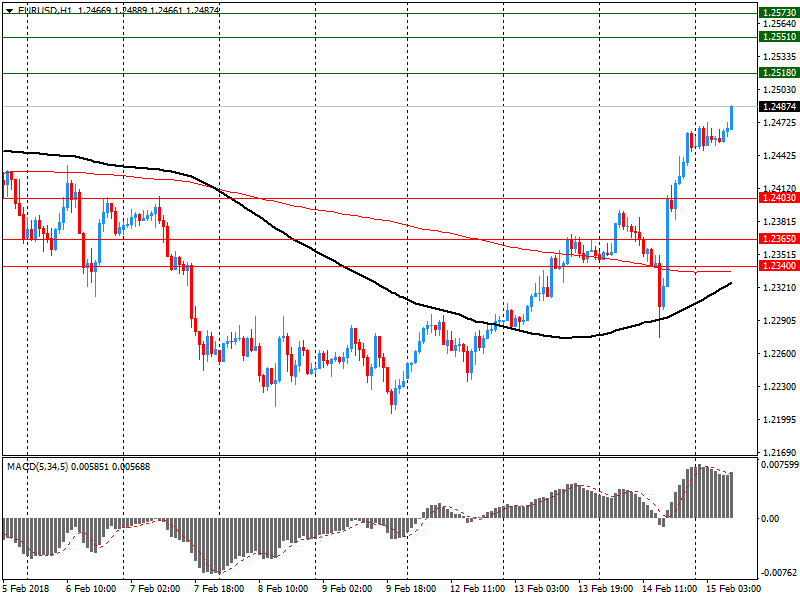
Comments:
- Overall open interest on the CALL options and PUT options with the expiration date March, 9 is 126553 contracts (according to data from February, 14) with the maximum number of contracts with strike price $1,2300 (5716);
GBP/USD
Resistance levels (open interest**, contracts)
$1.4197 (2809)
$1.4142 (1934)
$1.4098 (3706)
Price at time of writing this review: $1.4049
Support levels (open interest**, contracts):
$1.3952 (897)
$1.3906 (1552)
$1.3861 (1802)
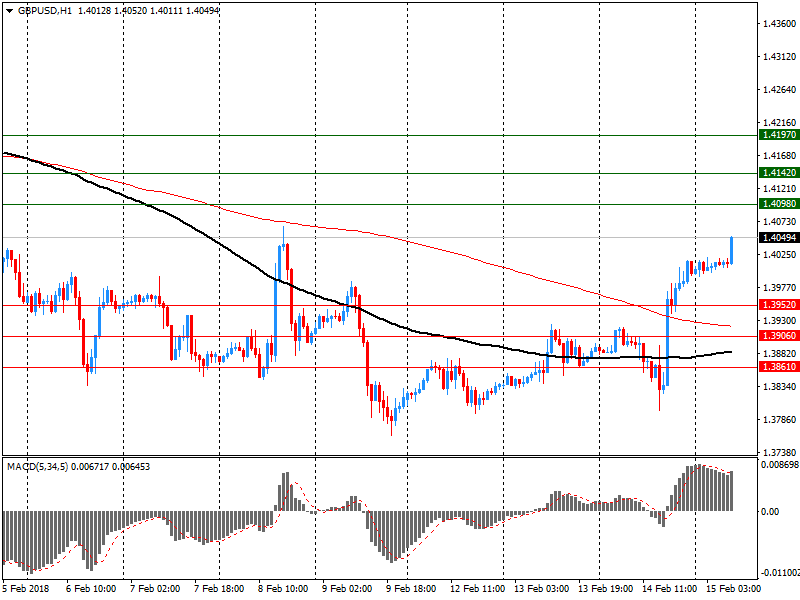
Comments:
- Overall open interest on the CALL options with the expiration date March, 9 is 46621 contracts, with the maximum number of contracts with strike price $1,3900 (3706);
- Overall open interest on the PUT options with the expiration date March, 9 is 44142 contracts, with the maximum number of contracts with strike price $1,3850 (2228);
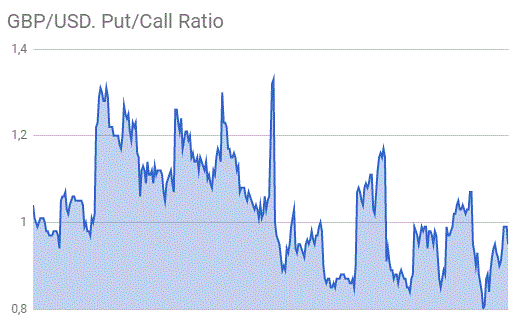
- The ratio of PUT/CALL was 0.95 versus 0.99 from the previous trading day according to data from February, 14
* - The Chicago Mercantile Exchange bulletin (CME) is used for the calculation.
** - Open interest takes into account the total number of option contracts that are open at the moment.
Japan's industrial production grew more than initially estimated in December, latest figures from the Ministry of Economy, Trade and Industry showed Thursday, cited by rttnews.
Industrial production advanced a seasonally adjusted 2.9 percent month-over-month in December, faster than the 2.7 percent rise reported earlier.
In November, production had grown at a stable rate of 0.5 percent.
Shipments also increased 2.9 percent over the month, revised up from a 2.7 percent gain estimated initially.
At the same time, inventories dropped 0.3 percent, just below the 0.4 percent fall seen in the flash data.
On a yearly basis, industrial production growth eased to 2.1 percent in December from 3.0 percent in November.
-
New Zealand's high external debt burden and elevated household debt levels are the key weaknesses for the credit profile
-
New Zealand's real gdp growth is likely to remain solid over the next two years
-
Accommodative monetary policy and fiscal stimulus will bolster growth, which fitch forecasts at 2.8% in 2018 and 3.1% in 2019
-
Does not expect government-initiated review of RBNZ act to materially alter rbnz policy or policymaking credibility
Australia's female labour force participation rate reached an historic high of 60.5 per cent in January 2018, while the overall participation rate of 65.6 per cent in January was the highest since February 2011, according to latest figures released by the Australian Bureau of Statistics (ABS) today.
Program Manager for the ABS Labour and Income Branch Bjorn Jarvis said the trend unemployment rate for January remained steady at 5.5 per cent, where it has hovered for the past seven months.
"Australia's labour force participation rate continues to strengthen, reaching a new high for females in January and a seven-year high overall," Mr Jarvis said.


© 2000-2024. All rights reserved.
This site is managed by Teletrade D.J. LLC 2351 LLC 2022 (Euro House, Richmond Hill Road, Kingstown, VC0100, St. Vincent and the Grenadines).
The information on this website is for informational purposes only and does not constitute any investment advice.
The company does not serve or provide services to customers who are residents of the US, Canada, Iran, The Democratic People's Republic of Korea, Yemen and FATF blacklisted countries.
Making transactions on financial markets with marginal financial instruments opens up wide possibilities and allows investors who are willing to take risks to earn high profits, carrying a potentially high risk of losses at the same time. Therefore you should responsibly approach the issue of choosing the appropriate investment strategy, taking the available resources into account, before starting trading.
Use of the information: full or partial use of materials from this website must always be referenced to TeleTrade as the source of information. Use of the materials on the Internet must be accompanied by a hyperlink to teletrade.org. Automatic import of materials and information from this website is prohibited.
Please contact our PR department if you have any questions or need assistance at pr@teletrade.global.
transfers