- Analytics
- News and Tools
- Quotes
- Chart and quotes for XAGUSD
Quotes and rates for precious metals Silver vs US Dollar (XAGUSD)
| Date | Rate | Change |
|---|
Related news
-
12.03.2024 06:17Silver Price Analysis: XAG/USD is stuck in a tight range around $24.50 ahead of US Inflation
- Silver price consolidates around $24.50 ahead of US Inflation data.
- The US core CPI is expected to decelerate while the headline inflation might remain sticky.
- Silver price needs a fresh trigger for a decisive break above $24.60.
Silver (XAG/USD) traded in a narrow range around $24.50 in Tuesday’s European session. The white metal has struggled to find a direction since Friday’s trading session. The asset is expected to break out of its sideways trend after the release of the United States Consumer Price Index (CPI) data for February, which will be published at 13:30 GMT.
The monthly headline inflation is forecasted to have risen by 0.4% from 0.3% in January. In the same period, the core inflation that strips off volatile food and energy prices is anticipated to have grown at a slower pace of 0.3% against the prior reading of 0.4%. For annual figures, economists expect that the headline CPI remains sticky at 3.1% and the core inflation decelerates to 3.7% from 3.9% in January.
The market expectations for the Federal Reserve (Fed) rate cuts in the June policy meeting will be significantly influenced after the release of the inflation data.
Ahead of the US consumer price inflation data, market sentiment is quite bullish. S&P 500 futures have posted significant gains in the London session, portraying the higher risk appetite of the market participants. 10-year US Treasury yields have dropped to 4.10%. The US Dollar Index (DXY) trades inside Monday’s trading range around 102.80.
Silver technical analysis
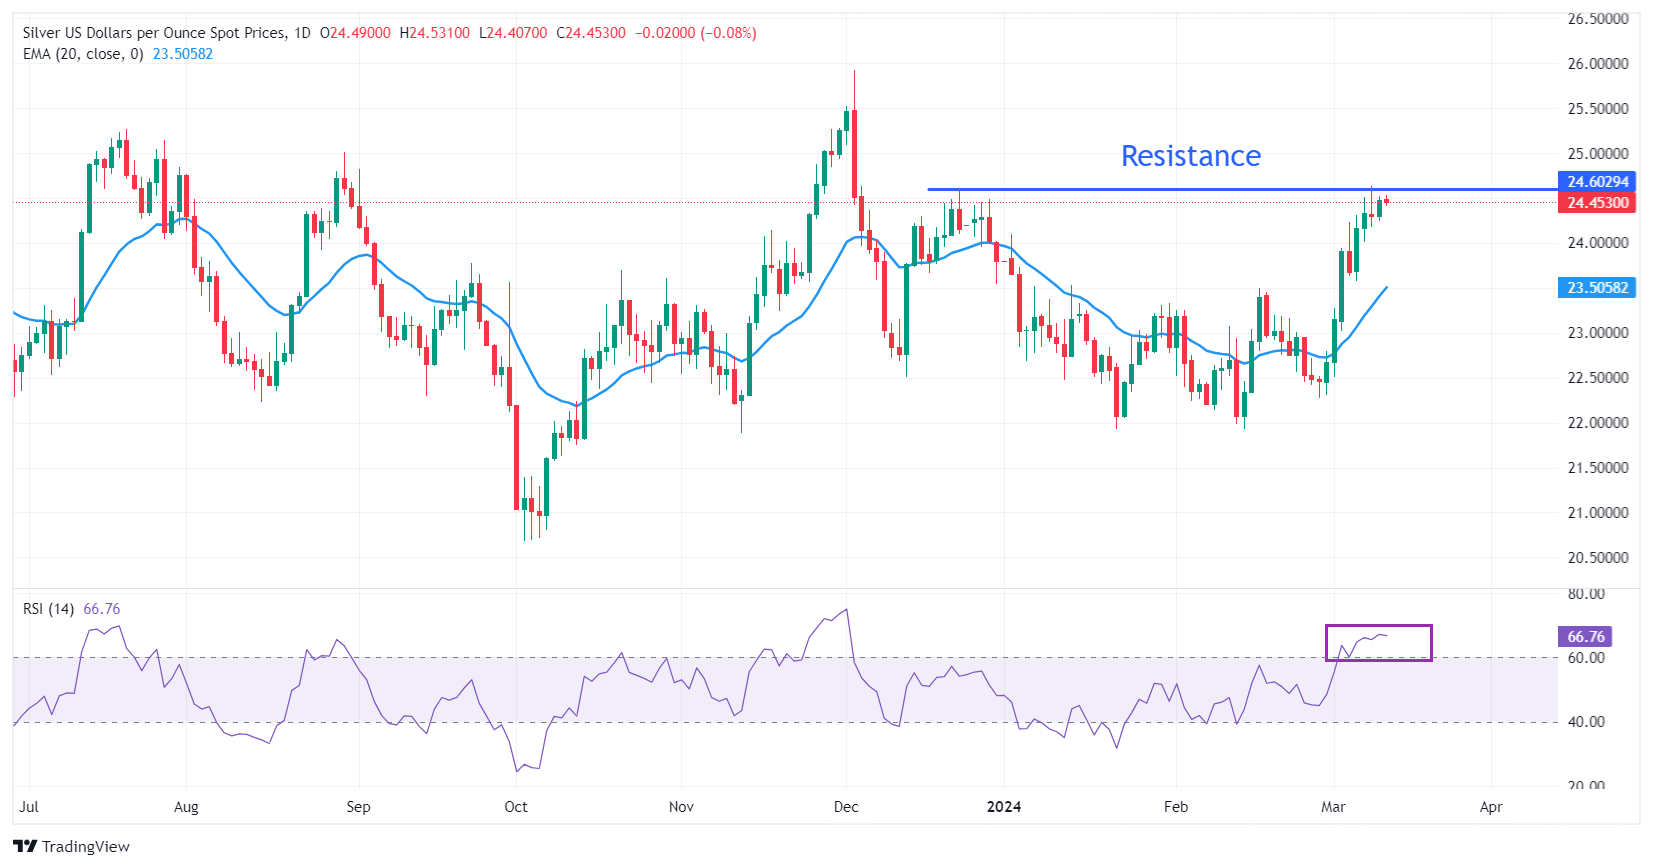
Silver price turn sideways after testing the horizontal resistance plotted from December 22 high at $24.60. The overall trend is bullish, however, a time correction move is expected before a fresh upside move. Advancing 20-day Exponential Moving Average (EMA) near $23.50 indicates that the near-term demand is upbeat.
The 14-period Relative Strength Index (RSI) oscillates in the bullish range of 60.00-80.00, indicating that a bullish momentum is already triggered.
Silver daily chart
-
11.03.2024 20:33Silver Price Analysis: XAG/USD edges high amidst risk-off impulse, shy of $24.50
- Silver notches a 0.60% increase, trading at $24.46, buoyed by a cautious market sentiment.
- Technical analysis hints at potential for breaking the $24.50 barrier, targeting year-highs.
- Downside risks loom if silver dips below $24.18, with critical supports at $24.00 and $23.57 in focus.
Silver climbs modestly as the New York session ends, registering gains of 0.60%, as XAG/USD trades at $24.46 after bottoming at around $24.24. A risk-off impulse pushed the grey’s metal price upwards amidst high US Treasury bond yields. Nevertheless, it remains below last week’s high of $24.50.
XAG/USD Price Analysis: Technical outlook
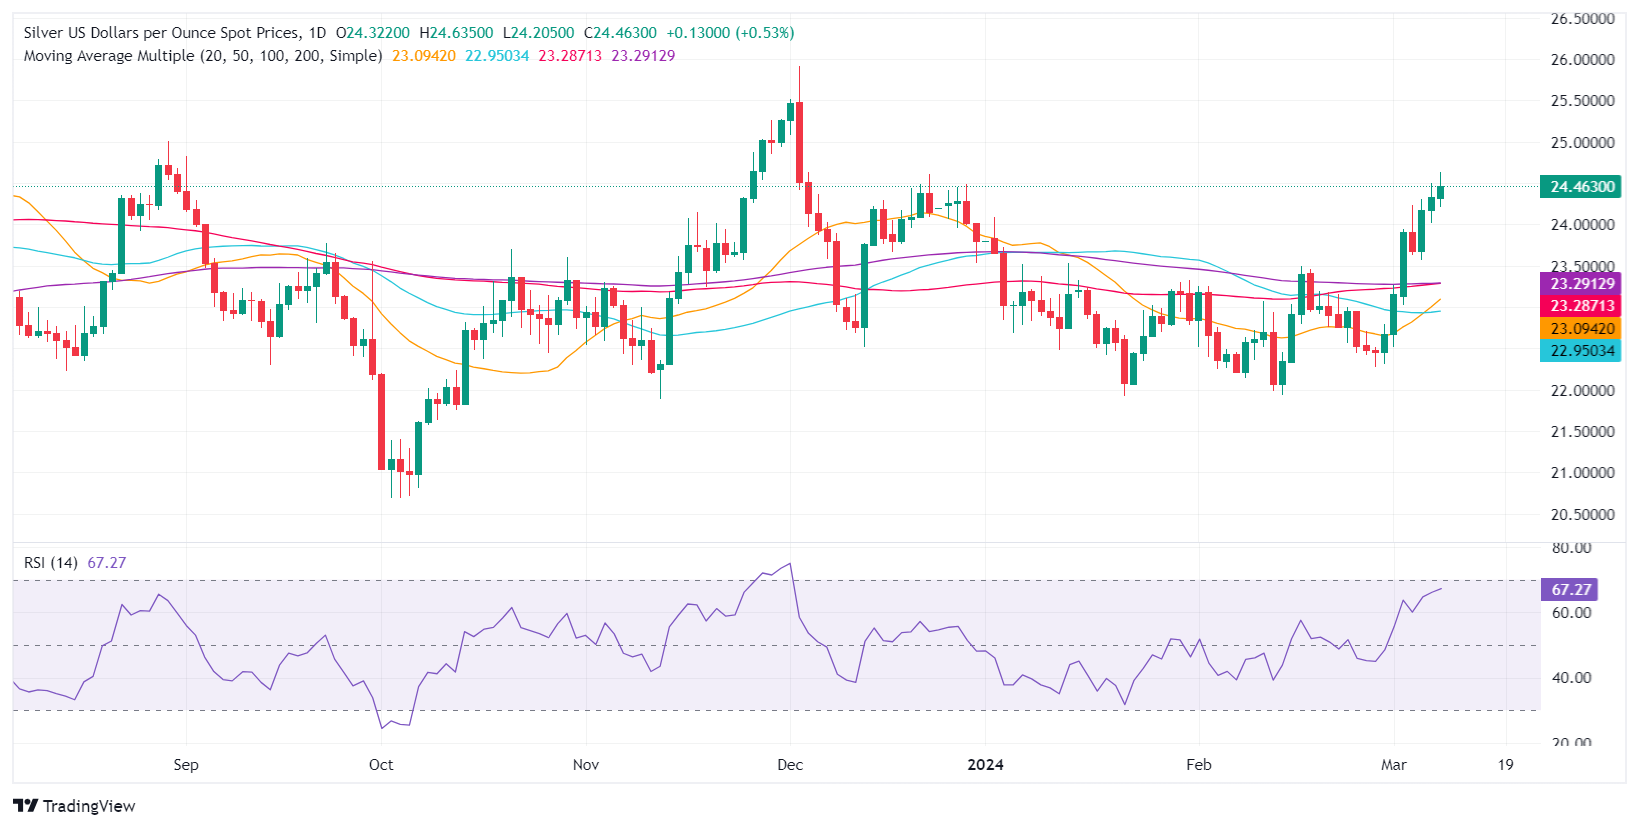
After hitting a low in the $24.20s range, Silver’s jumped toward the $24.40 area, though shy of cracking the $24.50 psychological figure. Even though Relative Strength Index (RSI) studies suggest further upside, buyers must break that area. Once cleared, up next would be the current year-to-date (YTD) high of $24.63, followed by the August 30 peak at $25.00. A decisive break would expose the December 4 high at $25.91.
In another scenario, if sellers stepped in and dragged XAG/USD’s prices below the March 8 low of $24.18, downside risks emerged at $24.00. The next support would be the March 6 low of $23.57.
XAG/USD Price Action – Daily Chart

-
08.03.2024 17:15Silver Price Analysis: XAG/USD holds near YTD high around $24.50
- Silver inches closer to retesting its year-to-date high of $24.63, after marking a 0.86% increase.
- Technical dynamics suggest potential for further gains if silver surpasses the $24.50 resistance.
- Downside risks loom if silver falls below $24.31, targeting supports at $24.00 and the March 6 low of $23.57.
Silver's price rallies, but it remains below the new year-to-date (YTD) high of $24.63. It reached earlier, post gains of 0.86%, and trades at around $24.50 during the mid-North American session.
XAG/USD Price Analysis: Technical outlook
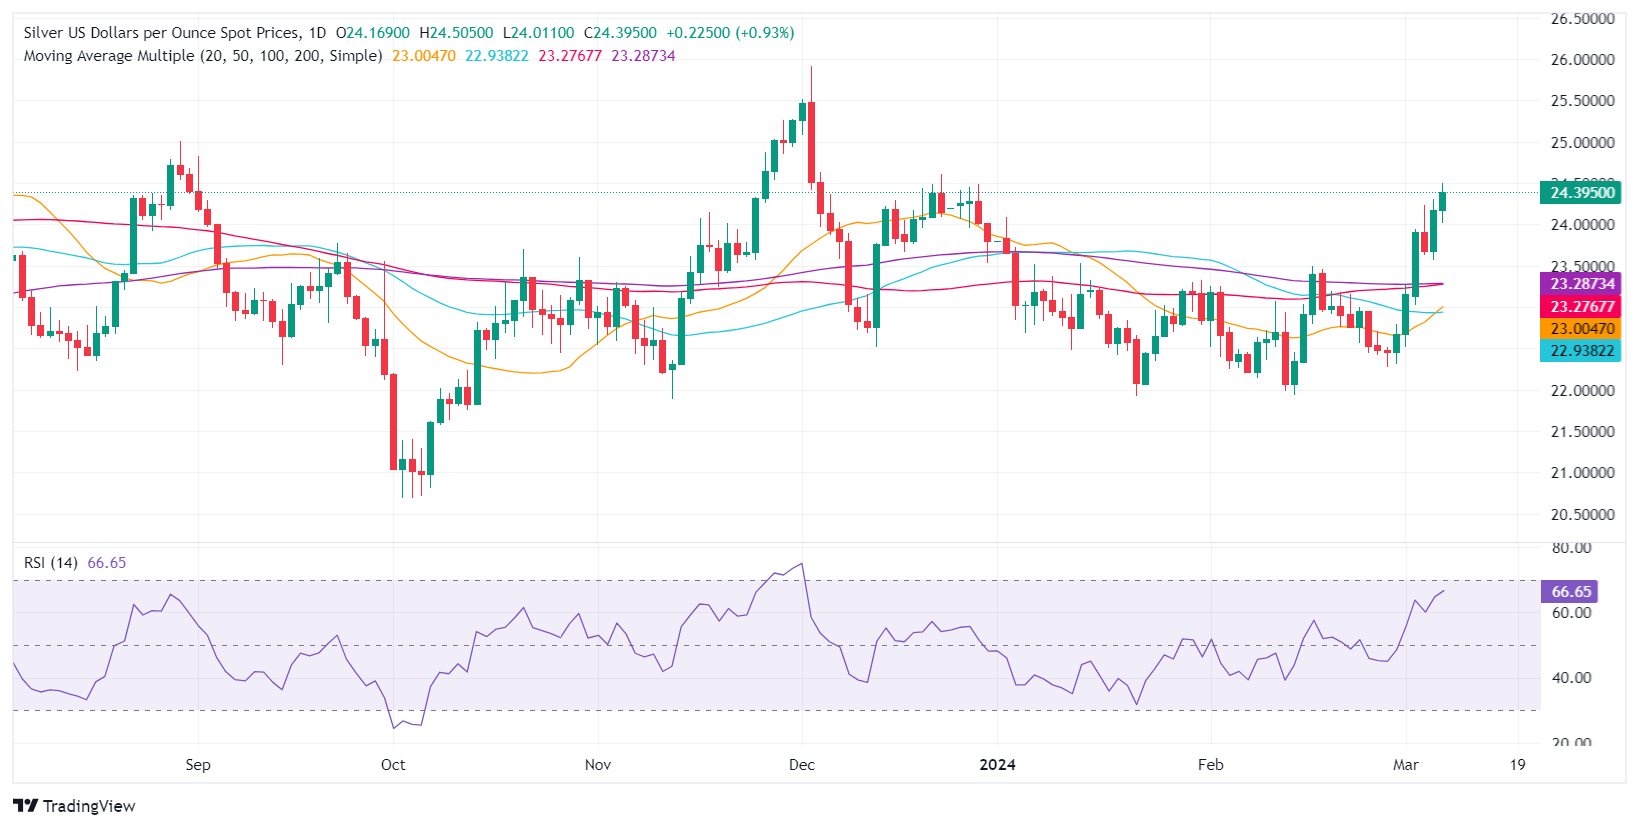
Silver retreated during the day, below the March 7 daily close of $24.31, which could sponsor a leg down if sellers push the prices lower. However, buyers are keeping Silver’s price above the latter, and if they reclaim the $24.50 level, that could push XAG/USD to re-test $24.63, ahead of $25.00.
On the flip side, if sellers drag Silver’s prices below $24.31, XAG/USD could dive to $24.00. A breach of the latter will expose the March 6 low of $23.57, followed by the confluence of the 100 and 200-day moving average (DMA) at $23.27.
XAG/USD Price Action – Daily Chart
-
07.03.2024 17:39Silver Price Analysis: XAG/USD shines above $24.00 fueled by soft US Dollar
- Silver's nearly 1% gain drives it to around $24.40, as market bets on a June Federal Reserve rate cut.
- Technical indicators bullish as silver surpasses 50, 100, and 200-day DMAs, eyeing December highs.
- Despite bullish trend, potential pullback risks exist if silver dips below $24.50, with supports at $24.00 and $23.57.
Silver price advances during Thursday’s session, gains almost 1% and stays above the $24.00 figure as investors expect a rate cut by the Federal Reserve in June. Therefore, XAG/USD exchanges hands at $24.40.
XAG/USD Price Analysis: Technical outlook
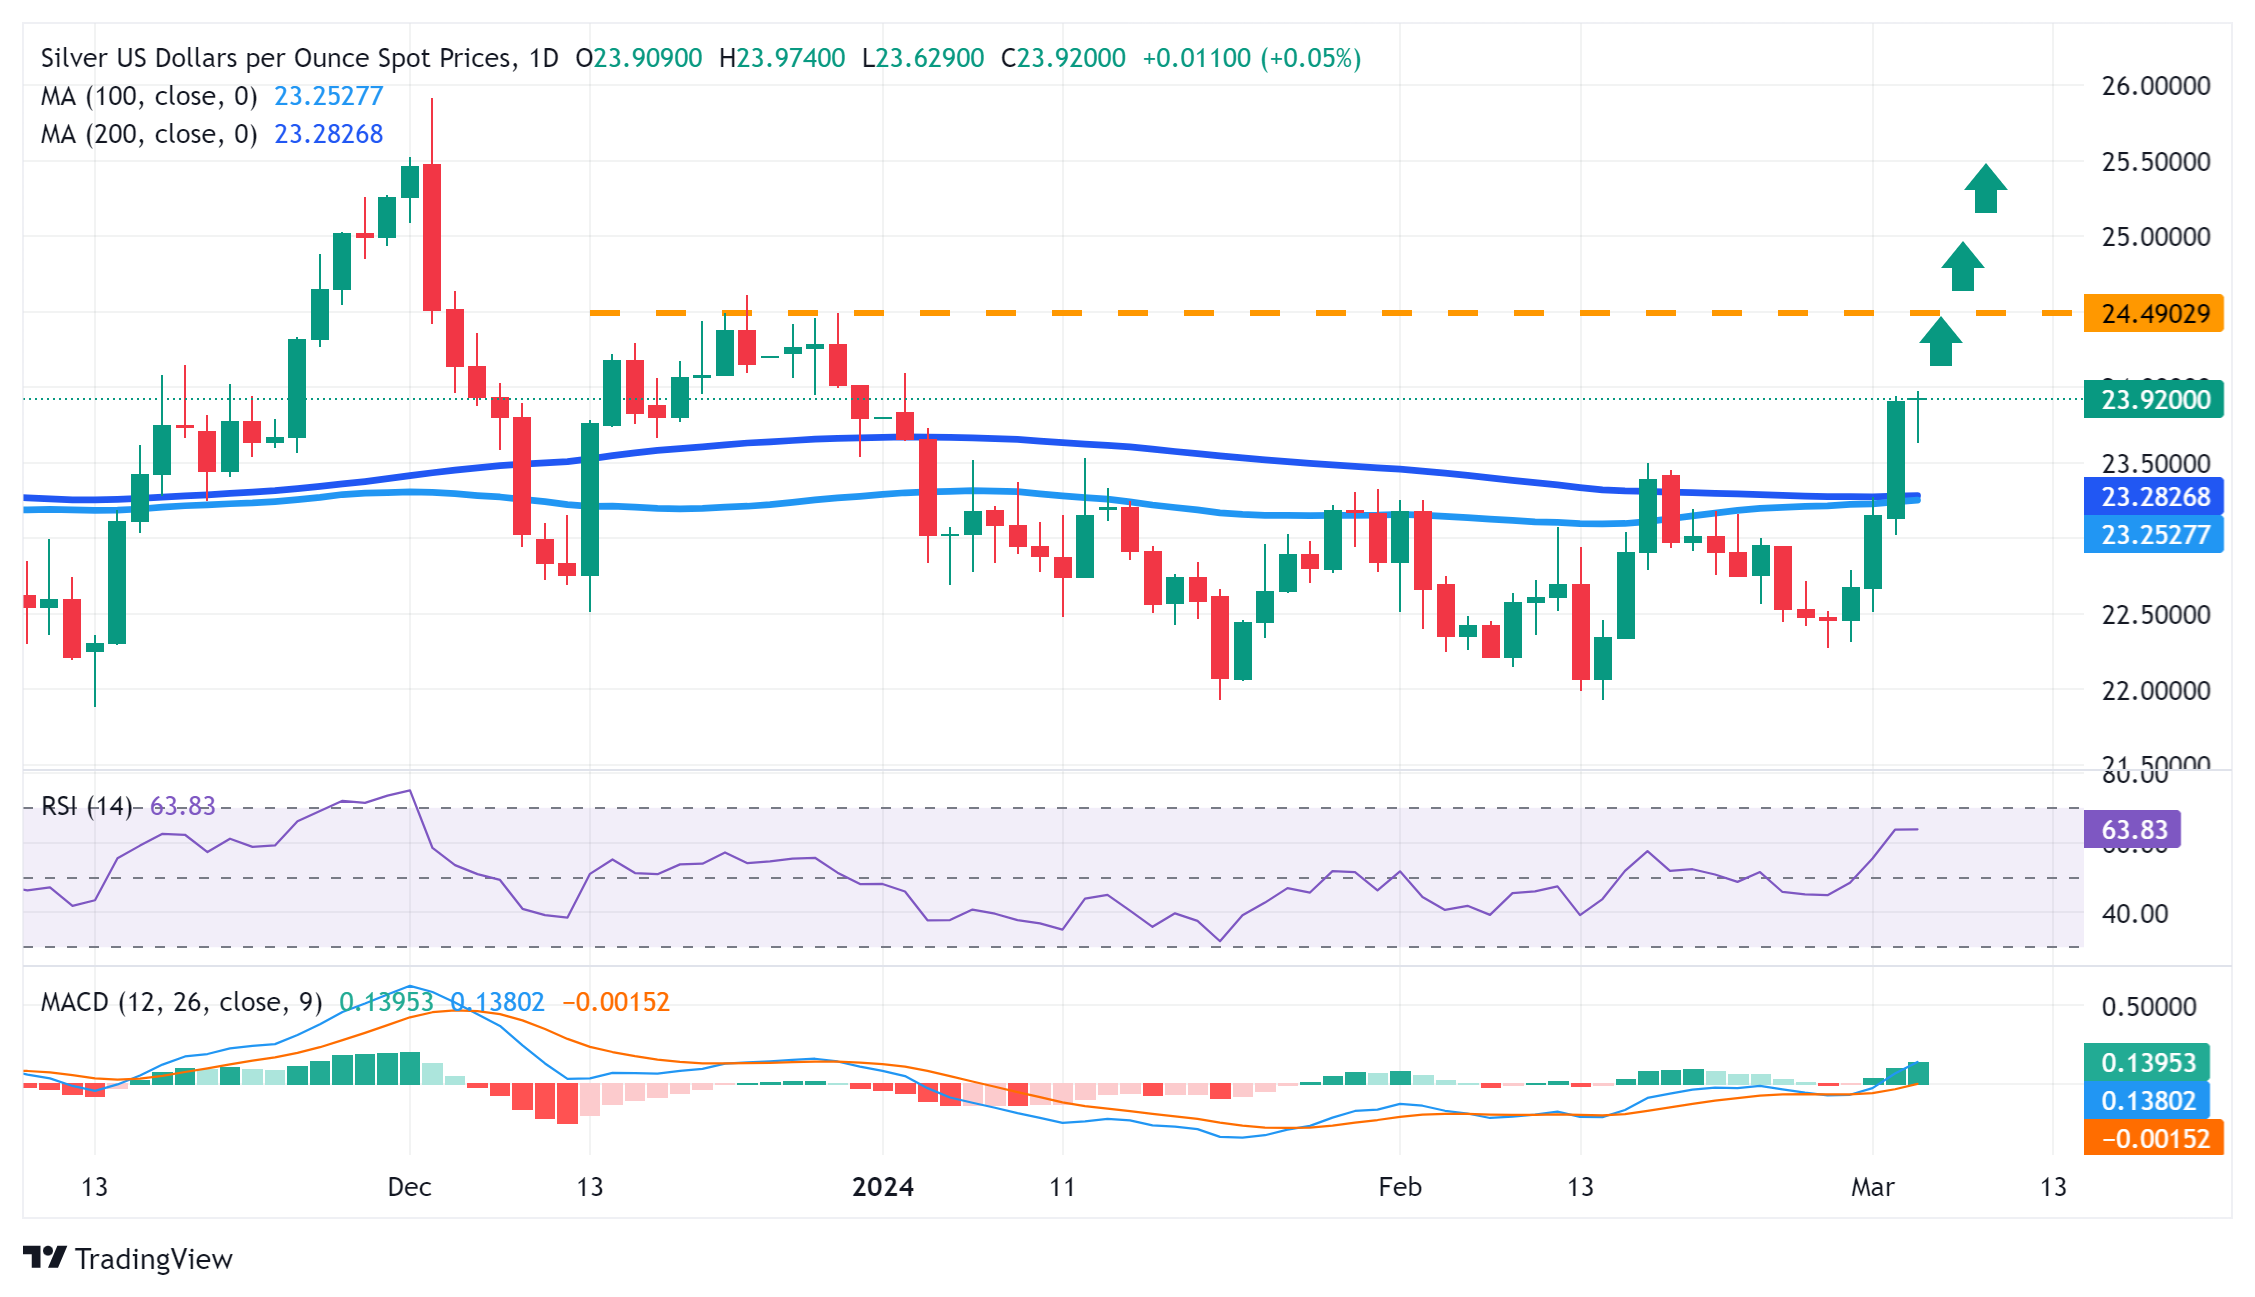
After bottoming at around $22.50, the grey metal extended its gains due to fundamental news. That opened the door to clear key resistance levels seen at the 50, 100, and 200-day moving averages (DMAs). If buyers push prices above the December 28 high of $24.48, look for a leg-up toward the December 22 peak at $24.60, ahead of the $25.00 psychological figure.
On a bearish scenario, the less likely as Relative Strength Index (RSI) studies show bullish momentum, XAG/USD’s daily close below $24.50, could sponsor a pullback. The first support would be the $24.00, followed by the March 6 low of $23.57,
XAG/USD Price Action – Daily Chart
-
05.03.2024 08:38Silver Price Analysis: XAG/USD flirts with YTD peak, bulls await move beyond $24.00 mark
- Silver reverses an intraday dip and moves back closer to the YTD peak on Tuesday.
- The technical setup favours bullish traders and supports prospects for further gains.
- Sustained weakness back below the $23.00 mark will negate the positive outlook.
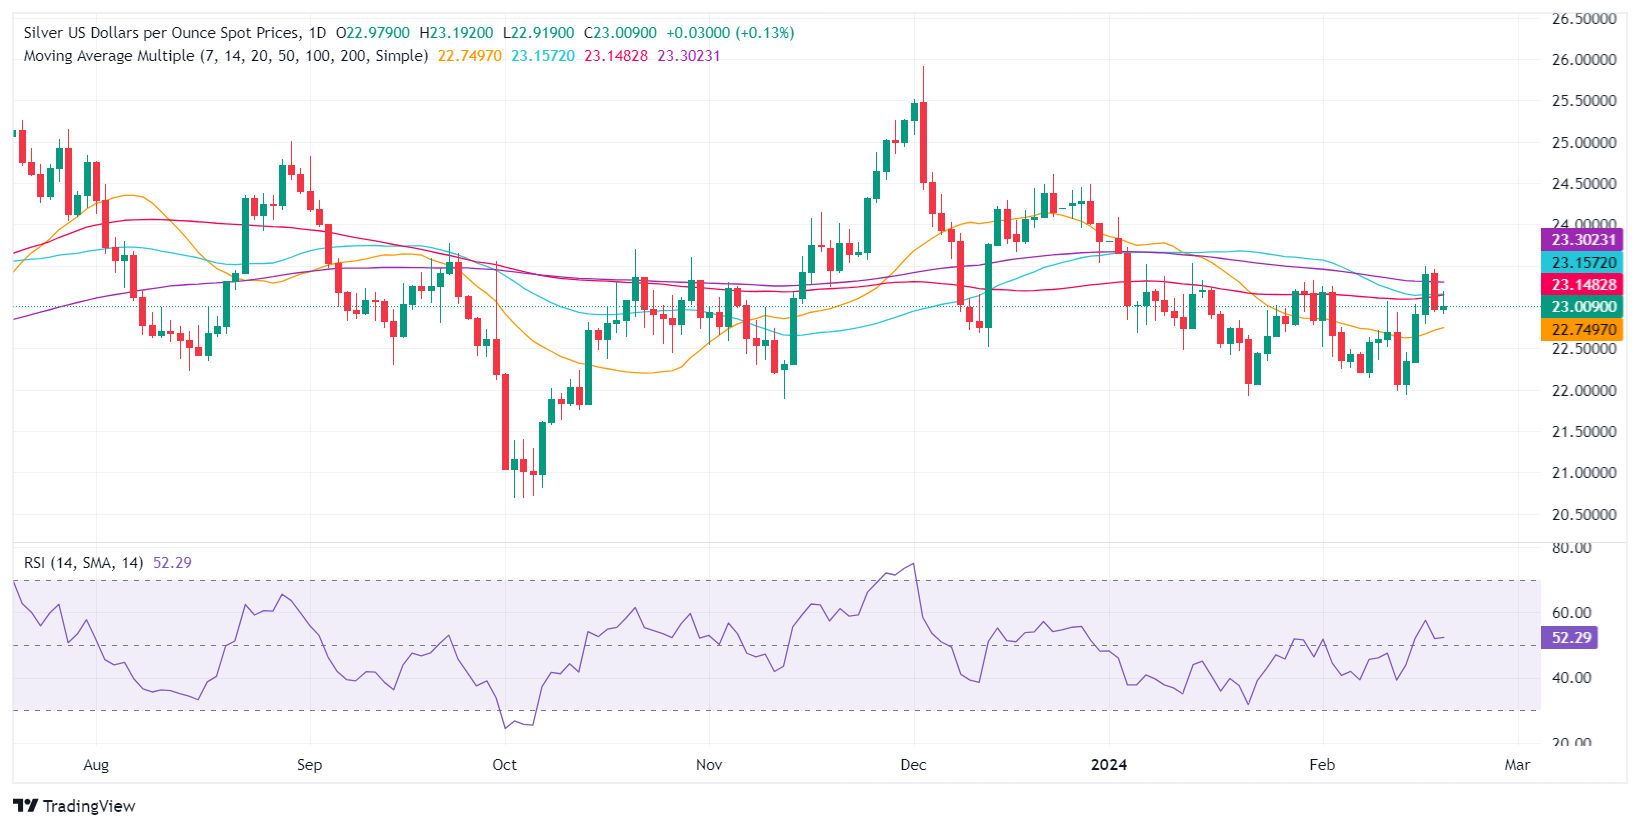
Silver (XAG/USD) attracts some dip-buying near the $23.65-$23.60 region on Tuesday and flirts with the YTD peak during the first half of the European session. The white metal currently trades just below the $24.00 mark and looks to build on the previous day's breakout momentum through the $23.30-$23.35 confluence hurdle.
The latter comprises the 100- and the 200-day Simple Moving Averages (SMA), which should now act as a key pivotal point for the XAG/USD. Any meaningful corrective slide is more likely to get bought into near the said resistance-turned-support and remain limited near the $23.00 round figure. That said, some follow-through selling will suggest that a one-week-old strong rally has run out of steam and pave the way for deeper losses.
The XAG/USD might then accelerate the slide towards the $22.50-$22.45 intermediate support before eventually dropping to sub-$22.00 levels or the two-month trough touched in January and retested in February. The downward trajectory could extend further and drag the white metal further towards the next relevant support near the $21.40-$21.35 region. That said, positive oscillators on the daily chart warrant caution for bearish traders.
On the flip side, momentum beyond the $24.00 mark is likely to confront some resistance near the $24.30-$24.35 region ahead of the $24.50 supply zone. A sustained strength beyond should allow the XAG/USD to reclaim the $25.00 psychological mark and climb further towards the $25.45-$25.50 intermediate hurdle en route to the $26.00 neighbourhood, or the December 2023 swing high.
Silver daily chart
-
01.03.2024 08:57Silver Price Analysis: XAG/USD slides back closer to mid-$22.00s, remains vulnerable
- Silver comes under fresh selling pressure and reverses a part of the overnight gains.
- The technical setup favours bearish traders and supports prospects for further losses.
- A sustained move beyond the $22.20-$22.25 confluence will negate the negative bias.
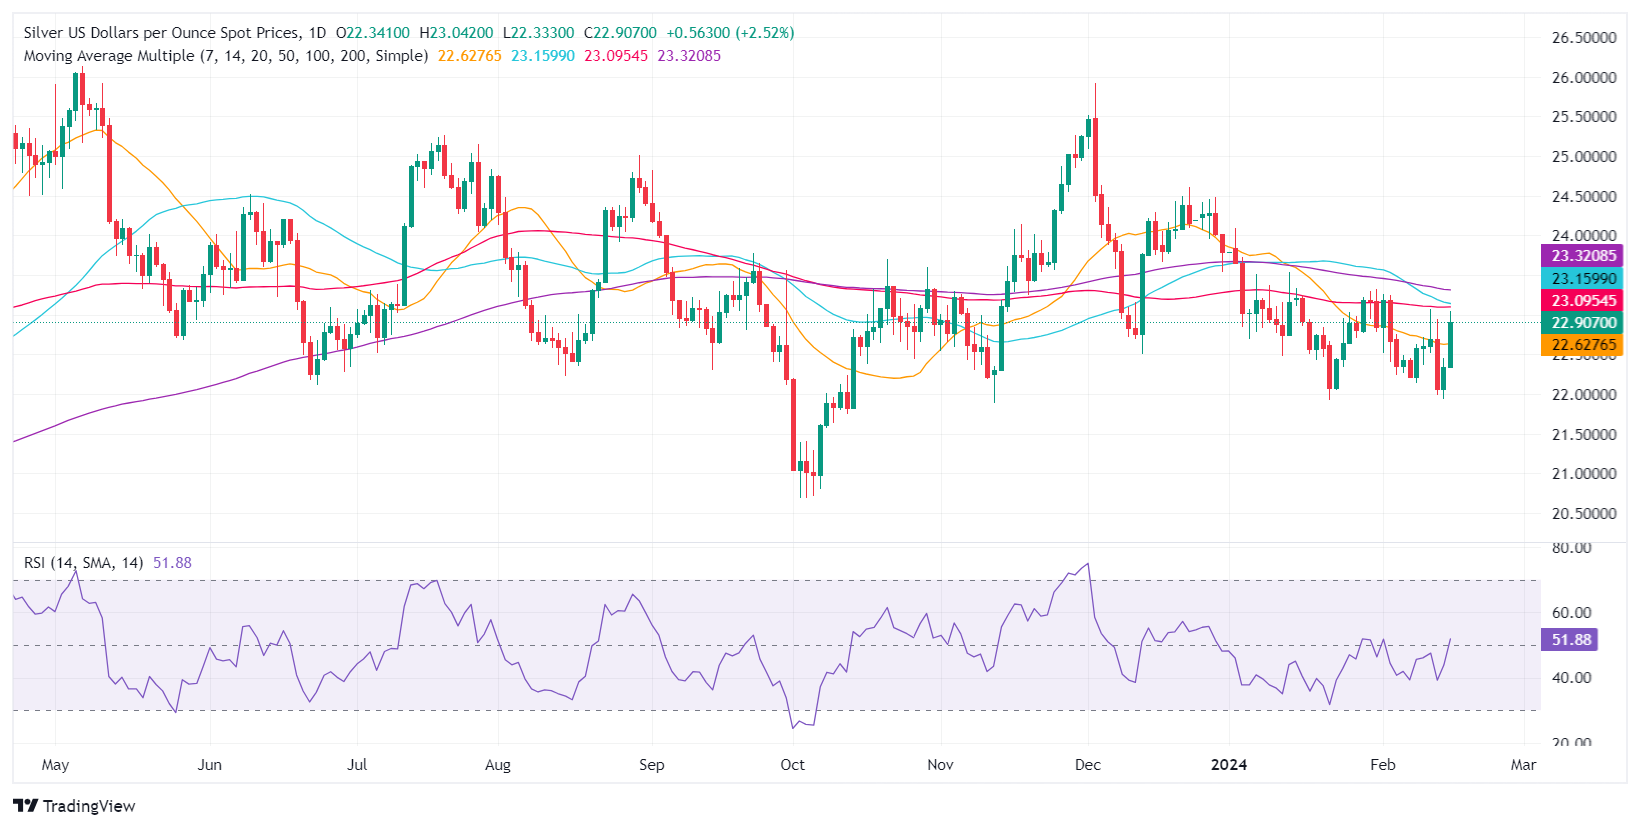
Silver (XAG/USD) meets with some supply following an intraday uptick to the $22.80 region on Friday and erodes a part of the previous day's positive move to a multi-day peak. The intraday descent extends through the early part of the European session and drags the white metal to a fresh daily low, back closer to the mid-$22.00s in the last hour.
Looking at the broader picture, the recent failure to find acceptance above the very important 200-day Simple Moving Average (SMA) and a subsequent downfall favours bearish traders. Moreover, oscillators on the daily chart have just started gaining negative traction and suggest that the path of least resistance for the XAG/USD is to the downside.
Hence, some follow-through descent back towards testing the weekly low, around the $22.30-$22.25 area, en route to the sub-$22.00 level, or the two-month trough touched in January, looks like a distinct possibility. The downward trajectory could extend further and eventually drag the XAG/USD to the next relevant support near the $21.40-$21.35 region.
On the flip side, the daily swing high, around the $22.75-$22.80 zone, might continue to act as an immediate hurdle ahead of the $23.00 round figure. A sustained strength beyond the latter might trigger a short-covering rally, though is likely to attract fresh sellers and remain capped near the $23.20-$22.25 confluence, comprising the 100- and the 200-day SMAs.
This is followed by the monthly swing high, around mid-$23.00s, which if cleared decisively will negate any near-term negative outlook and shift the bias in favour of bullish traders. The XAG/USD might then aim to reclaim the $24.00 round figure and climb further towards the $24.30-$24.35 intermediate hurdle en route to the $24.50 supply zone.
Silver daily chart
-
28.02.2024 09:35Silver Price Analysis: XAG/USD seems vulnerable near $22.30, two-week low
- Silver loses ground for the third straight day and drops to over a two-week low.
- The technical setup favours bears and supports prospects for additional losses.
- A sustained move above the 200-day SMA is needed to negate the negative bias.
Silver (XAG/USD) remains under heavy selling pressure for the third successive day on Wednesday – also marking the fifth day of a negative move in the previous six and drops to over a two-week low during the first half of the European session. The white metal currently trades around the $22.30 region and seems vulnerable to prolonging its recent downfall witnessed over the past two weeks or so.
From a technical perspective, the recent failure to find acceptance above the very important and significant 200-day Simple Moving Average (SMA) and the subsequent decline validate the near-term negative outlook. Moreover, oscillators on the daily chart have just started gaining negative traction and further suggest that the path of least resistance for the XAG/USD remains to the downside.
Hence, some follow-through weakness towards retesting sub-$22.00 levels, or the two-month low touched in January, looks like a distinct possibility. A convincing break below the latter will be seen as a fresh trigger for bearish traders and pave the way for additional losses, dragging the XAG/USD towards the $21.40-$21.35 support zone.
On the flip side, the daily swing high, around the mid-$22.00s, now seems to act as an immediate hurdle ahead of the $22.70-$22.75 region. This is closely followed by the $23.00 round figure, which if cleared decisively might trigger a short-covering rally, though is likely to attract fresh sellers near the 200-day SMA, currently pegged around the $23.30 zone, and remain capped near mid-$23.00, or the monthly peak.
Silver daily chart
-
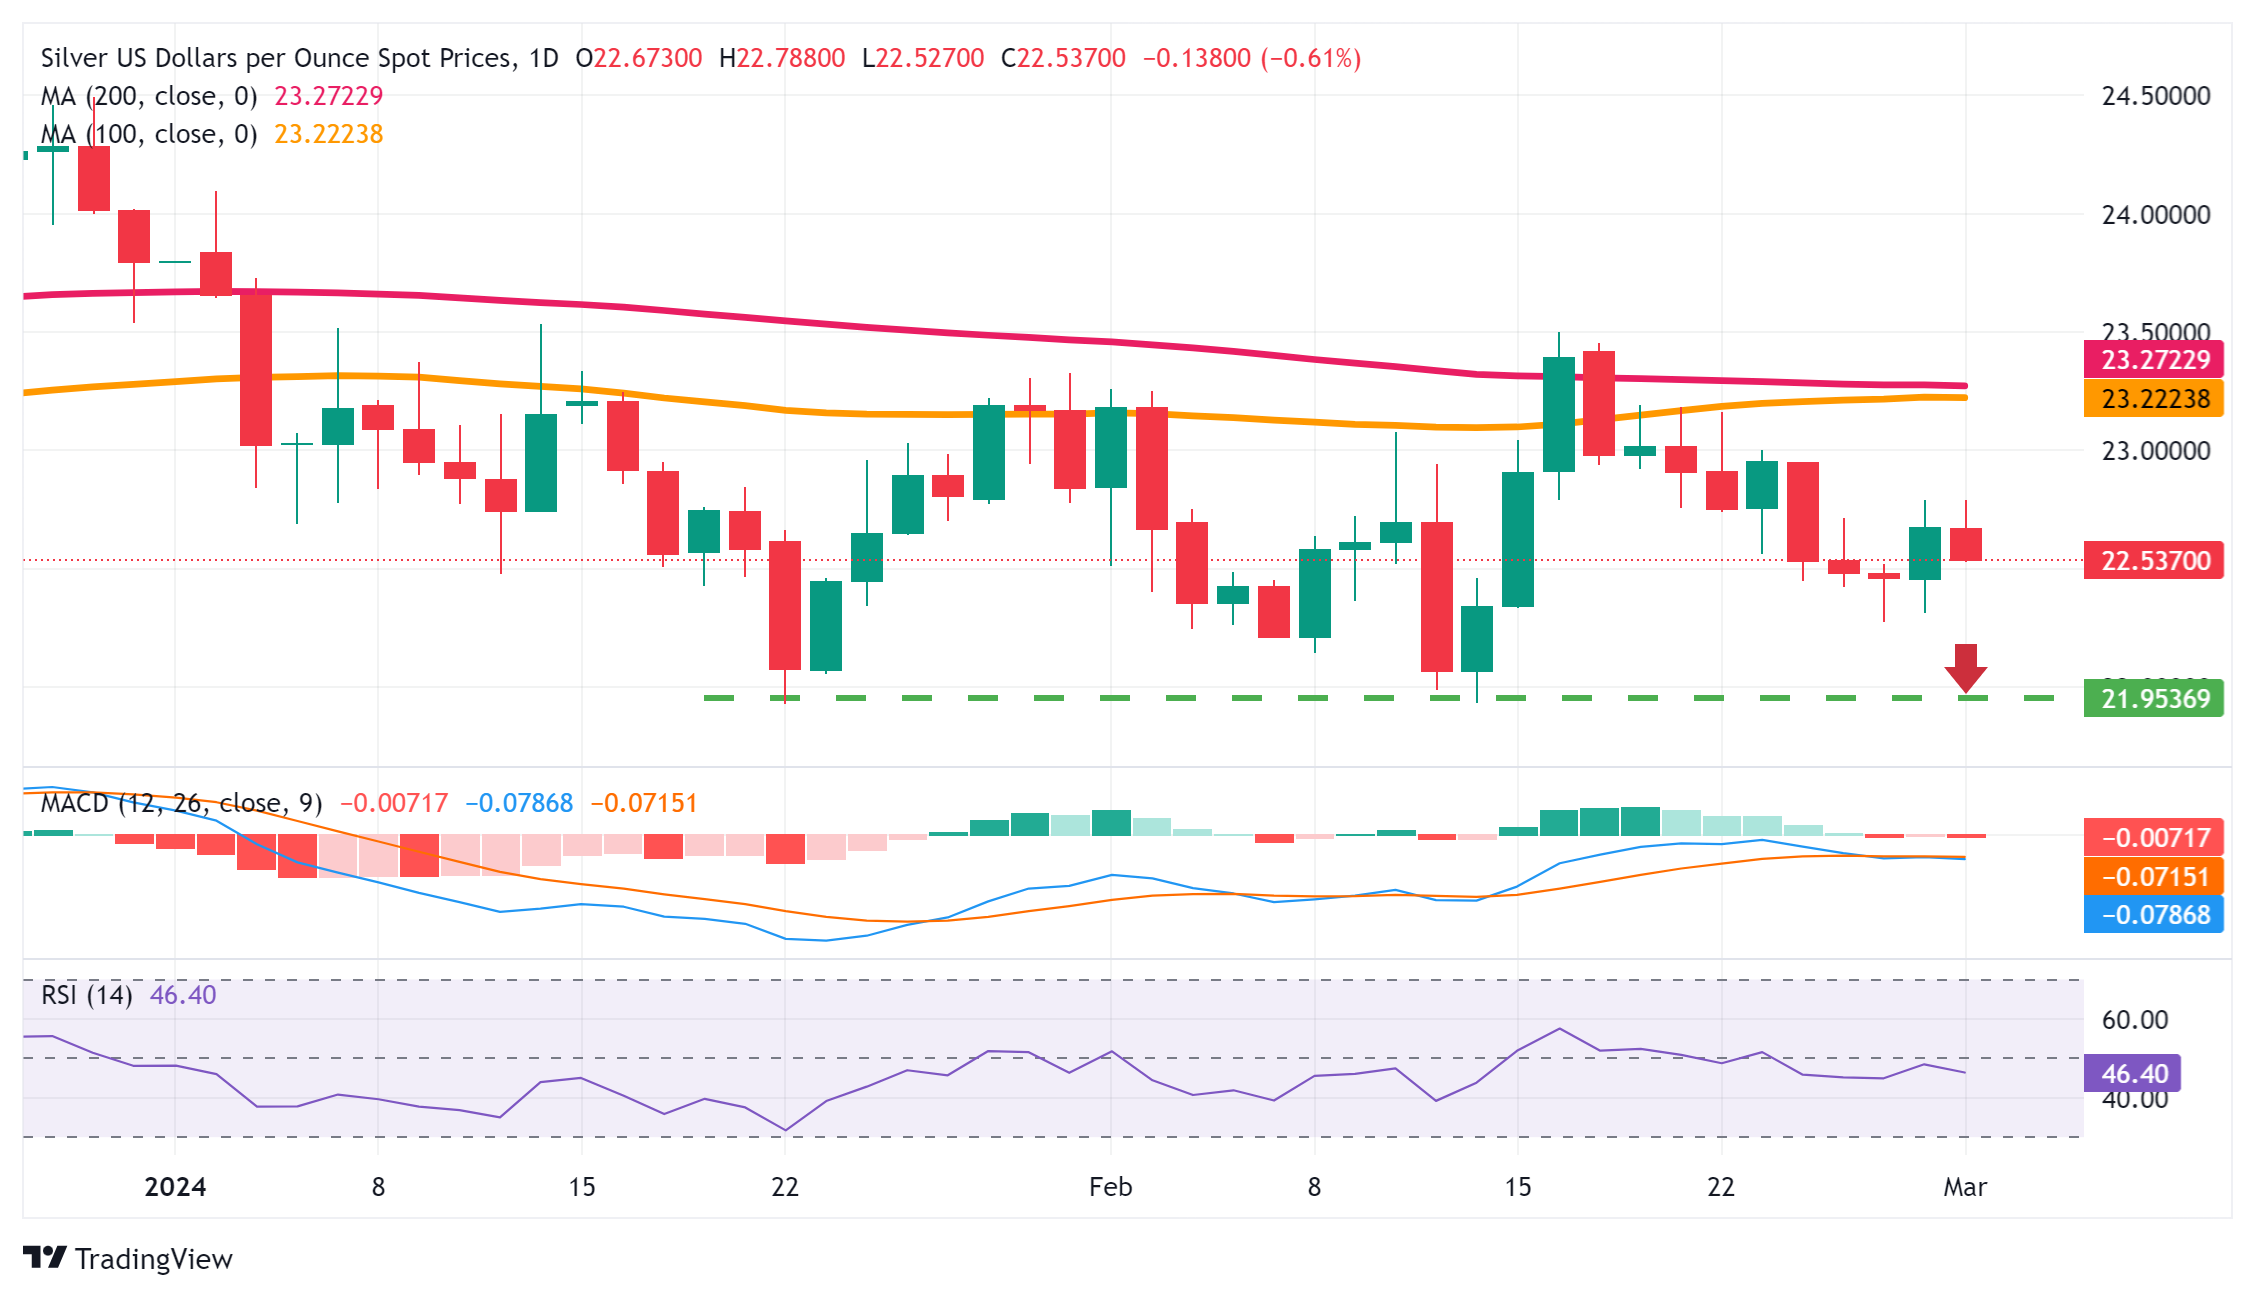
27.02.2024 17:51Silver Price Analysis: XAG/USD hits eight-day low, technicals suggest further declines
- Silver price drops to $22.43, approaching key technical support that may indicate a nearing bottom.
- Technical analysis points to a potential decline toward yearly lows if prices fall decisively below $22, showcasing bearish trends.
- A rebound above $23.00 might steer silver towards challenging the $23.30 resistance level, giving bulls an opportunity for recovery.
Silver price falls to an eight-day low of $22.43, though it appears to have bottomed out at around the $22.40-50 area. The advance of US Treasury bond yields capped the nonyielding metal, with XAG/USD trading at $22.49, down 0.04%.
XAG/USD Price Analysis: Technical outlook
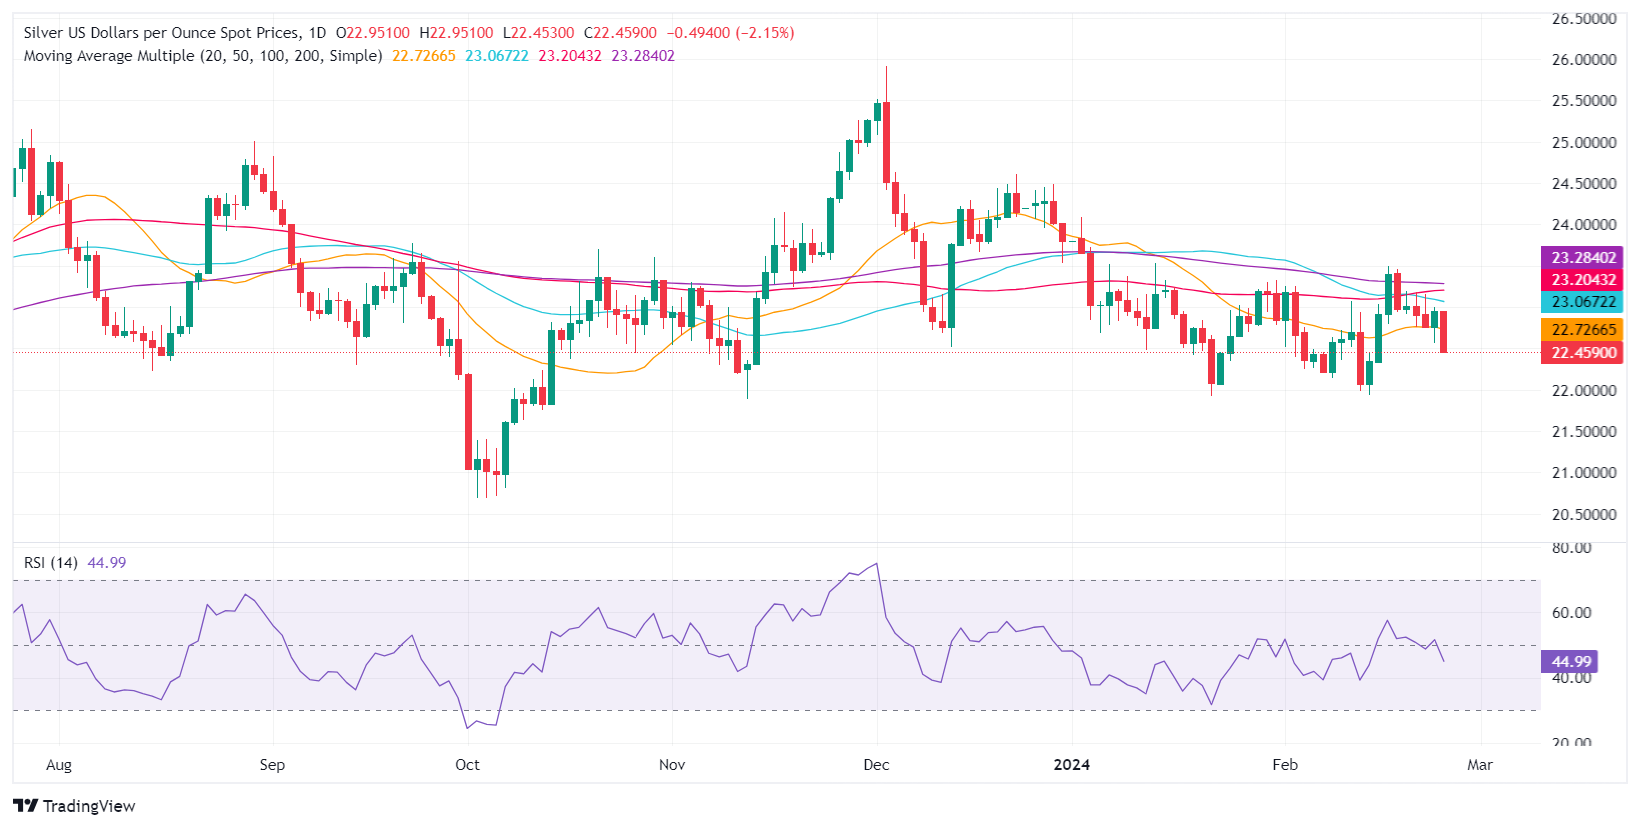
The daily chart portrays that XAG/USD has extended its losses to levels last seen at around mid-February after briefly testing the confluence of the 50, 100, and 200-day moving averages (DMAs) at around the $23.00-$23.30 area. Even though Silver’s price action remains sideways, it’s tilted to the downside, but sellers must step in and drag prices below the $22.00 figure. Once achieved, that would open the door to test the yearly lows of $21.93, the November 13 low of $21.88, and the October 3 low of $20.69.
On the other hand, if XAG/USD buyers lift the spot price above $23.00, look for a re-test of the $23.30 area.
XAG/USD Price Action – Daily Chart
-
27.02.2024 08:38Silver Price Forecast: XAG/USD soars to $22.70 as US Dollar weakens, US core PCE data in focus
- Silver price rises sharply to $22.70 amid weakness in the US Dollar.
- Easing geopolitical tensions have impacted safe-haven appeal.
- Sticky US core PCE price index data may postpone Fed’s plans of quitting hawkish stance.
Silver price (XAG/USD) recovers sharply to near $22.70 as the US Dollar comes under pressure in the London session on Tuesday. The white metal rises as the US Dollar faces a sell-off due to easing geopolitical tensions.
US President Joe Biden is confident of a ceasefire between Israel and Palestine by next week. The US State Department said there has been progress in negotiations for releasing Israeli hostages.
The US Dollar Index, which represents the Greenback’s value against six rival currencies, extends its correction to 103.70.
This week, investors will focus on the United States' core Personal Consumption Expenditure price index (PCE) data for January, which will provide more insights into the timing of the Federal Reserve’s (Fed) rate cuts. Investors anticipate that monthly core PCE rose sharply by 0.4% from 0.2% in December. The annual core PCE data is anticipated to decelerate to 2.8% from the former reading of 2.9%.
The expectations for a rate cut by the Fed will be postponed if the underlying inflation turns out hotter than expectations.
On Monday, Kansas City Federal Reserve Bank President Jeffrey Schmid said inflation remaining above 2%, tight labor market conditions, and a decent demand outlook indicate that there is no need to rush for rate cuts.
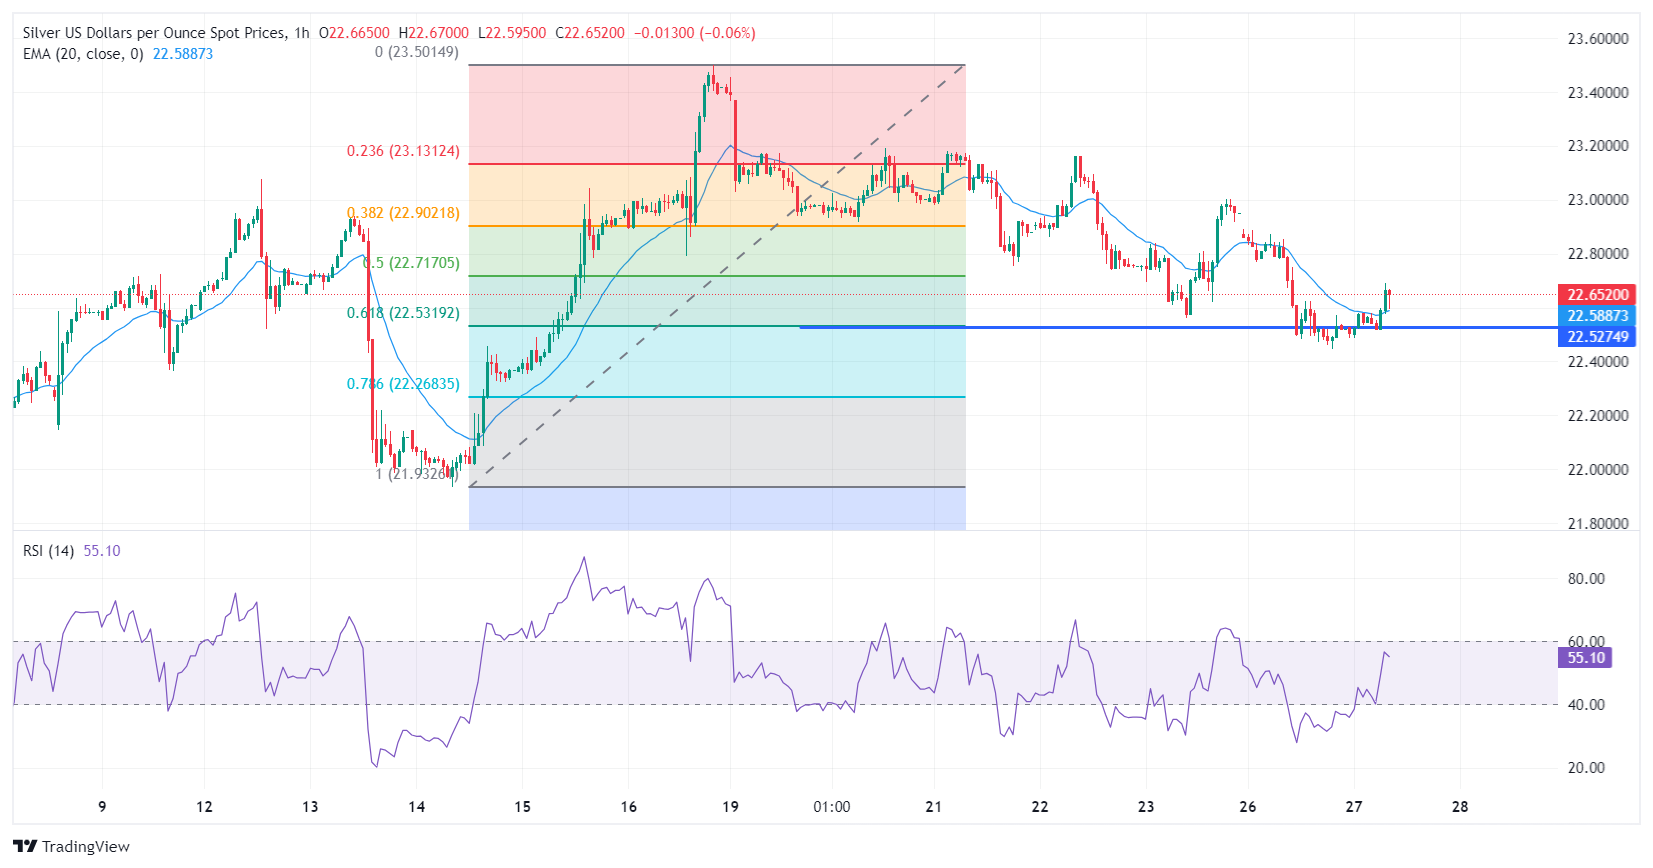
Silver technical analysis
Silver price finds a temporary cushion near the 61.8% Fibonacci retracement (plotted from February 14 low at $21.93 to February 16 high at $23.50) at $22.53 on an hourly scale. The white metal climbs above the 20-period Exponential Moving Average (EMA), which trades around $22.58.
The 14-period Relative Strength Index (RSI) oscillates in the 40.00-60.00 range, indicating consolidation ahead.
Silver hourly chart
-
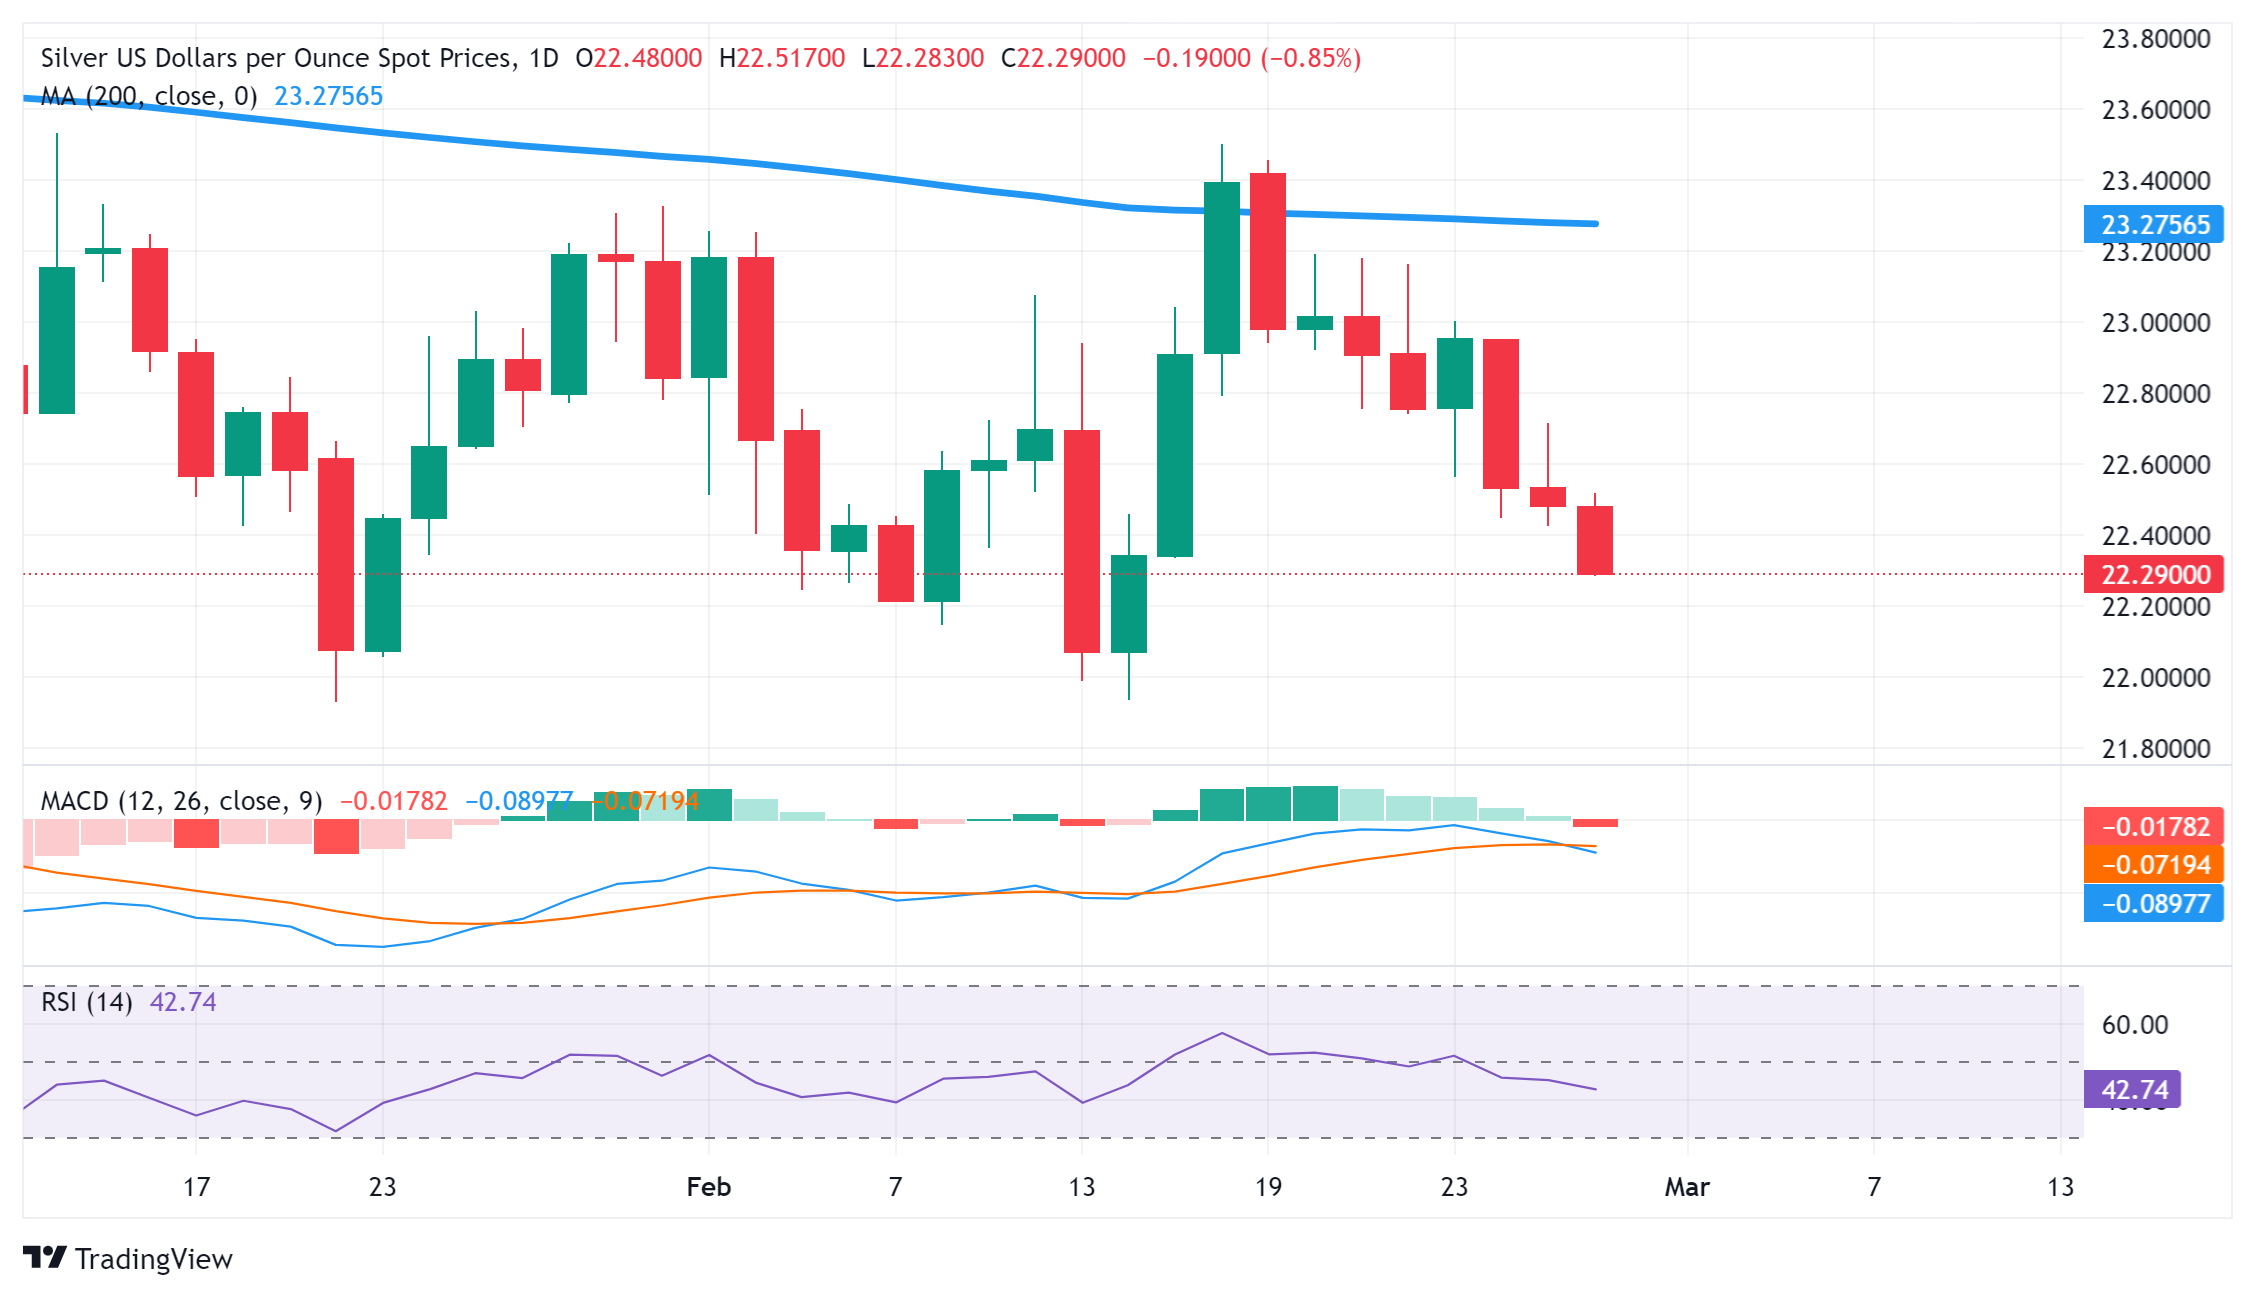
26.02.2024 19:35Silver Price Analysis: XAG/USD tumbles to seven-day low below $23.00, eyes on upcoming US data
- Silver price dives over 2%, as investors react to higher US Treasury bond yields.
- Failure to hold above the 50-day DMA and $23.00 level triggers extended sell-off towards $21.88 support.
- Potential rebound hinges on reclaiming $22.57, with silver possibly oscillating within a tight range near current levels.
- Read more: Gold price falls as US Treasury yields climb amid weak US Dollar
Silver prices plummeted to a seven-day low during the mid-North American session on Monday, as US Treasury bond yields climbed while traders braced for the release of US inflation figures late in the week. At the time of writing, the XAG/USD exchanges hands at $22.47, down more than 2.05%.
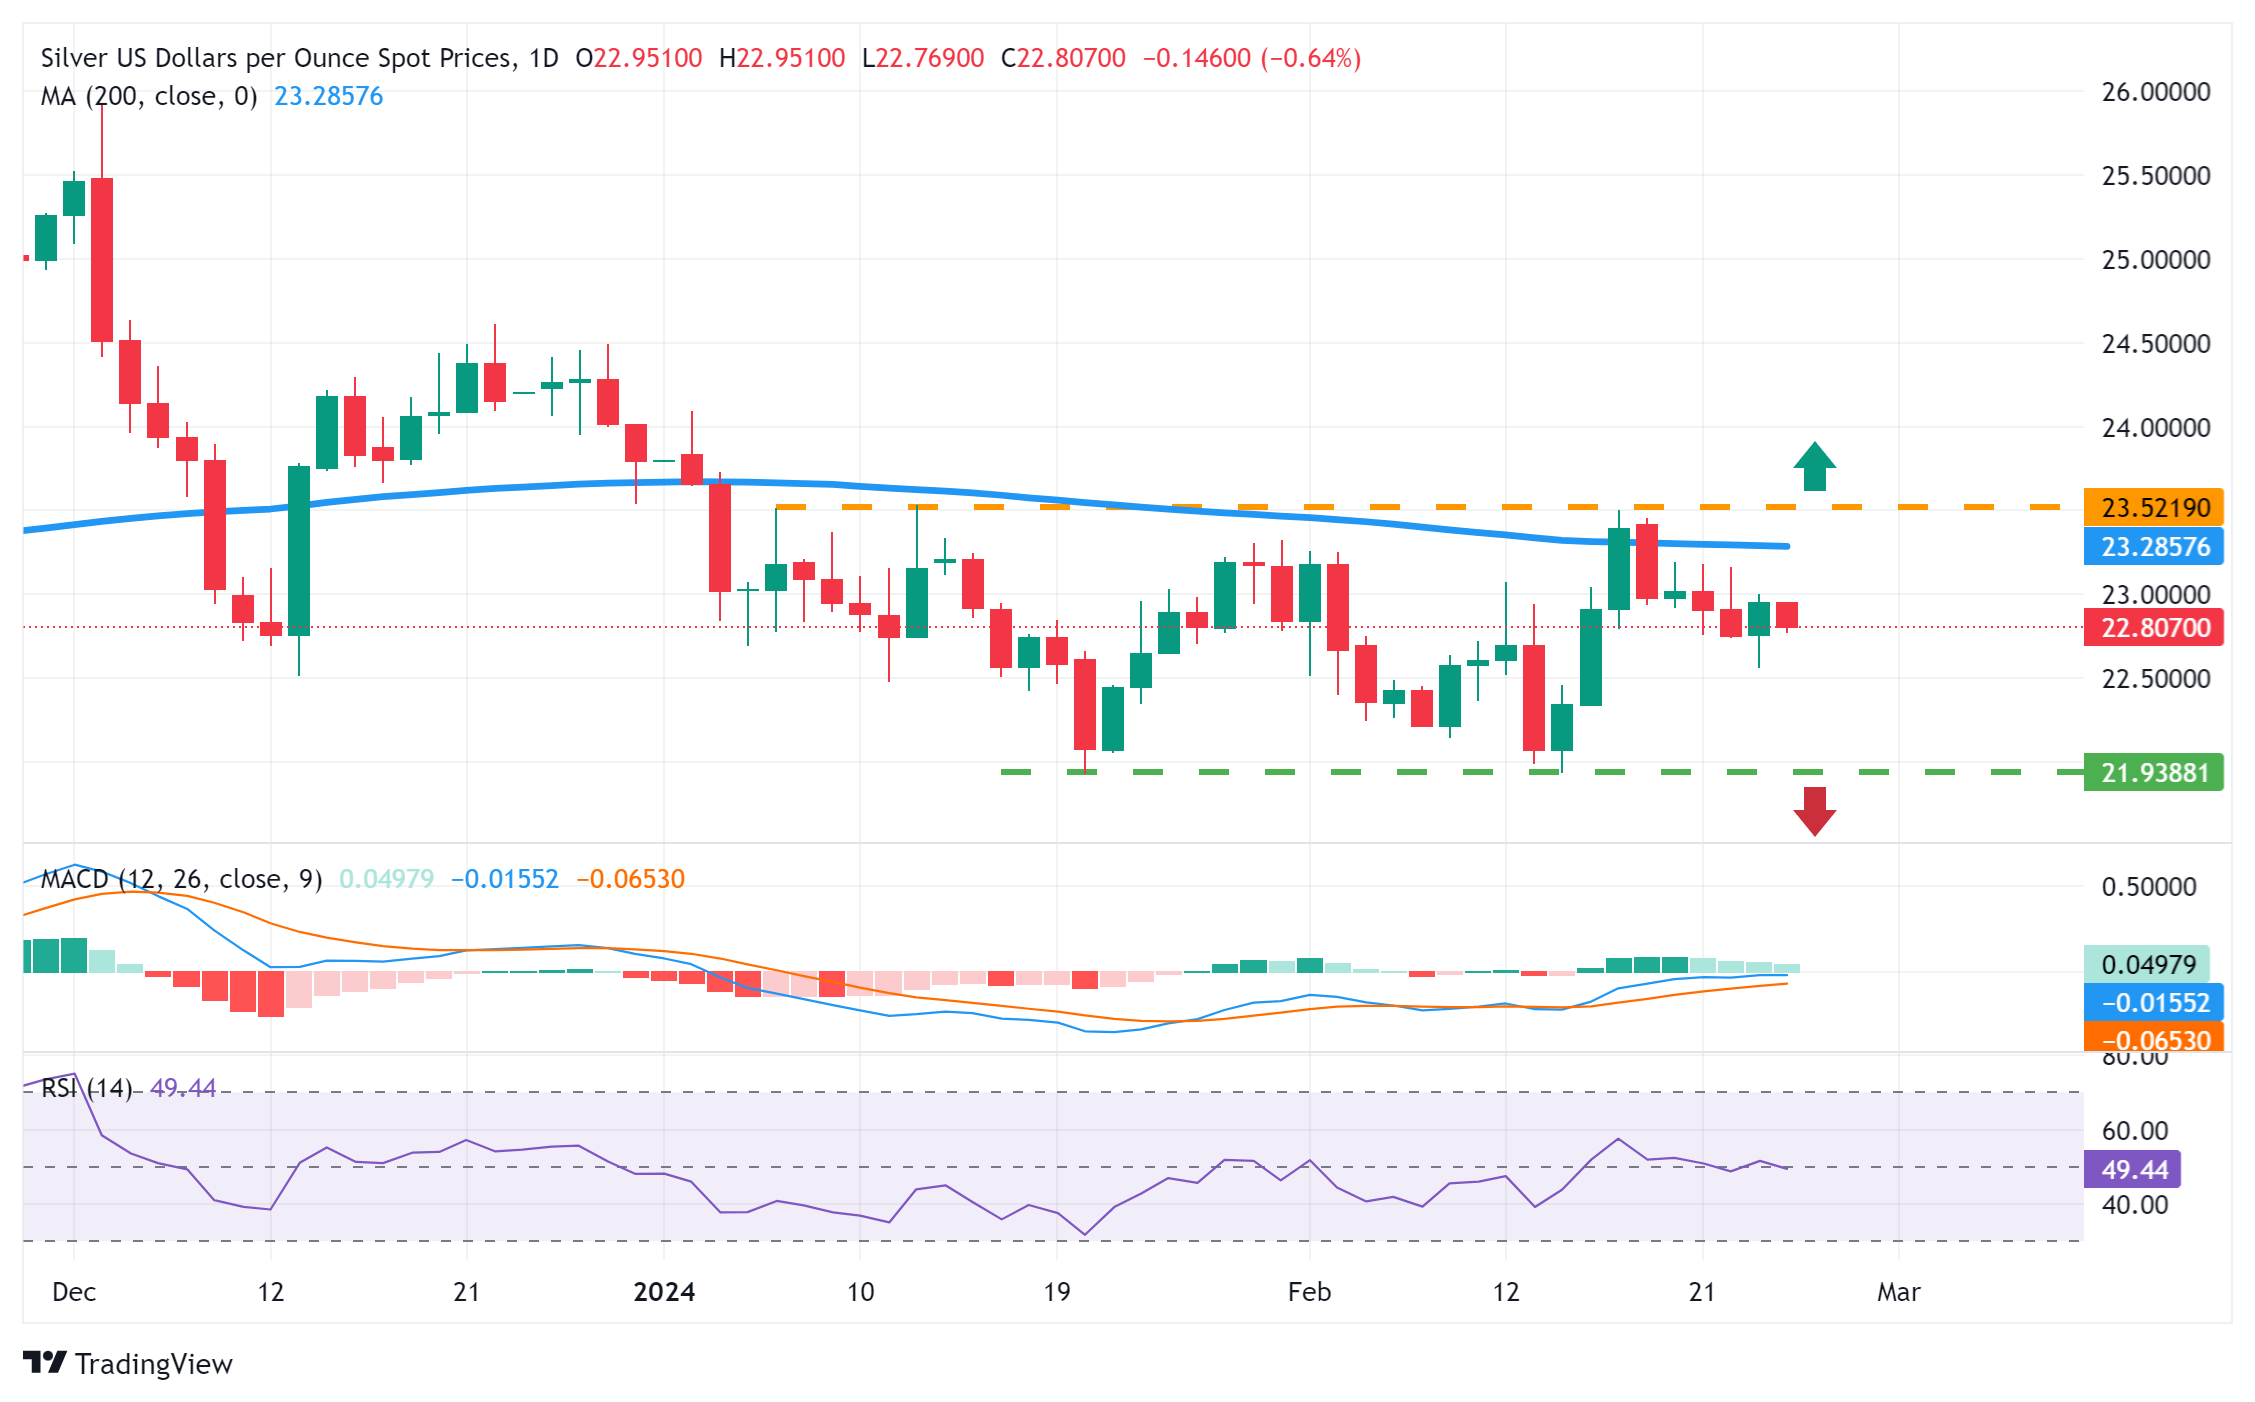
The XAG/USD downtrend has extended as buyers failed to reclaim the 50-day moving average (DMA), which opened the door for a pullback below the psychological $23.00 figure. The downtrend resumed once Silver fell below the February 23 low of $22.57. Yet, a daily close below the latter would cement the bearish bias and open the door for a deeper correction toward the November 13 swing low of $21.88, before extending its losses to the $21.00 figure.
On the other hand, if buyers step in, and XAG/USD posts a daily close above $22.57, look for the grey metal to remain range-bound at around the $22.50-$23.00 area, capped by the DMAs, at around the $23.05-$23.26 range.
XAG/USD Price Analysis – Daily Chart
-
26.02.2024 08:45Silver Price Analysis: XAG/USD trades with modest losses below $23.00, remains vulnerable
- Silver struggles to capitalize on Friday’s goodish bounce from the vicinity of the mid-$22.00s.
- Neutral oscillators on the daily chart warrant some caution before placing directional bets.
- A sustained strength beyond the 200-day SMA will shift the bias in favour of bullish traders.
Silver (XAG/USD) meets with a fresh supply on the first day of a new week and erodes a major part of Friday's recovery gains from over a one-week low. The white metal maintains its offered tone around the $22.85-$22.80 zone through the first half of the European session and seems vulnerable to prolonging its recent downfall witnessed over the past week or so.
From a technical perspective, the recent failure to find acceptance above the very important and significant 200-day Simple Moving Average (SMA) and the subsequent decline validates the near-term negative outlook for the XAG/USD. That said, oscillators on the daily chart are yet to confirm a bearish bias, making it prudent to wait for some follow-through selling before positioning for any further near-term depreciating move.
In the meantime, Friday's swing low, around mid-$22.00s, might continue to protect the immediate downside ahead of the $22.30 horizontal support. The next relevant support is pegged near the $21.90-$21.85 zone, or the two-month low touched in January. A convincing break below the latter will be seen as a fresh trigger for bearish traders and has the potential to drag the XAG/USD towards testing the $21.40-$21.35 support area.
On the flip side, the $23.00 round figure now seems to have emerged as an immediate hurdle, which if cleared might trigger a short-covering rally and lift the XAG/USD to the 200-day SMA, currently near the $23.30 zone. This is followed by the monthly peak, around mid-$23.00. A sustained strength beyond the latter will negate the negative outlook and allow the XAG/USD to aim back to reclaim the $24.00 round figure.
The momentum could extend further towards the $24.50-$24.60 region, above which the white metal could target the $25.00 psychological mark.
Silver daily chart
-
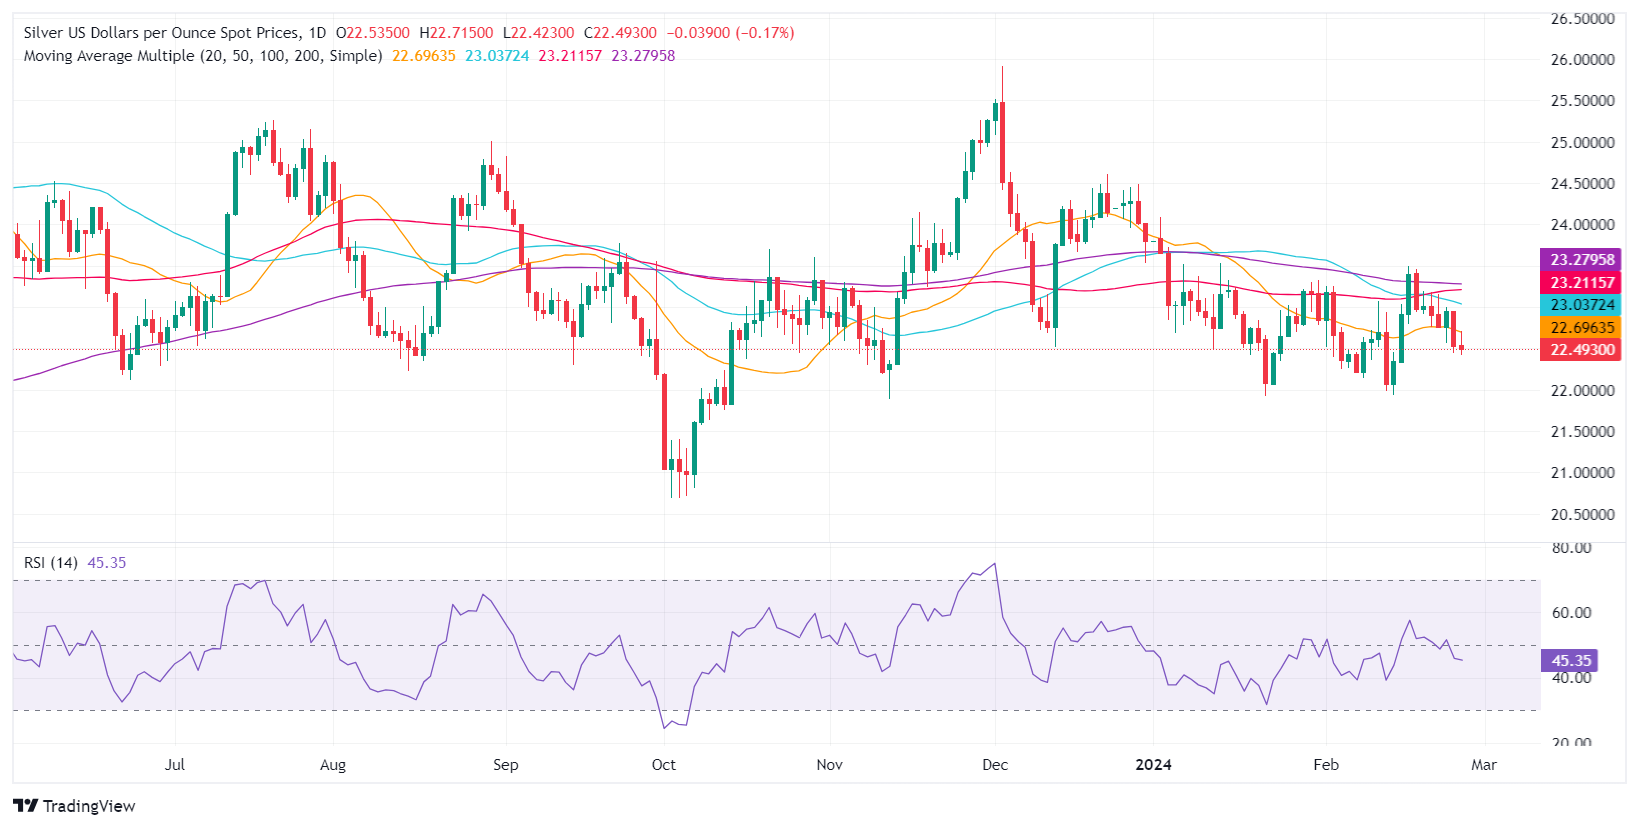
23.02.2024 18:02Silver Price Analysis: XAG/USD rallies amid risk-on mood, low US yields
- Silver jumps to $22.93, buoyed by gains on Wall Street and a decline in US Treasury yields.
- Technical analysis suggests a push above $23.00 needed to shift from bearish to neutral outlook.
- Key resistance ahead at 50-day, 100-day, and 200-day SMAs, with potential targets extending to $24.00.
Silver prices advanced in the mid-North American session on Friday amid an upbeat market mood as depicted by Wall Street’s posting gains. That and a drop in US Treasury yields sponsored a leg-up in the grey metal. At the time of writing, the XAG/USD exchanges hands at $22.93, up by 0.86%.
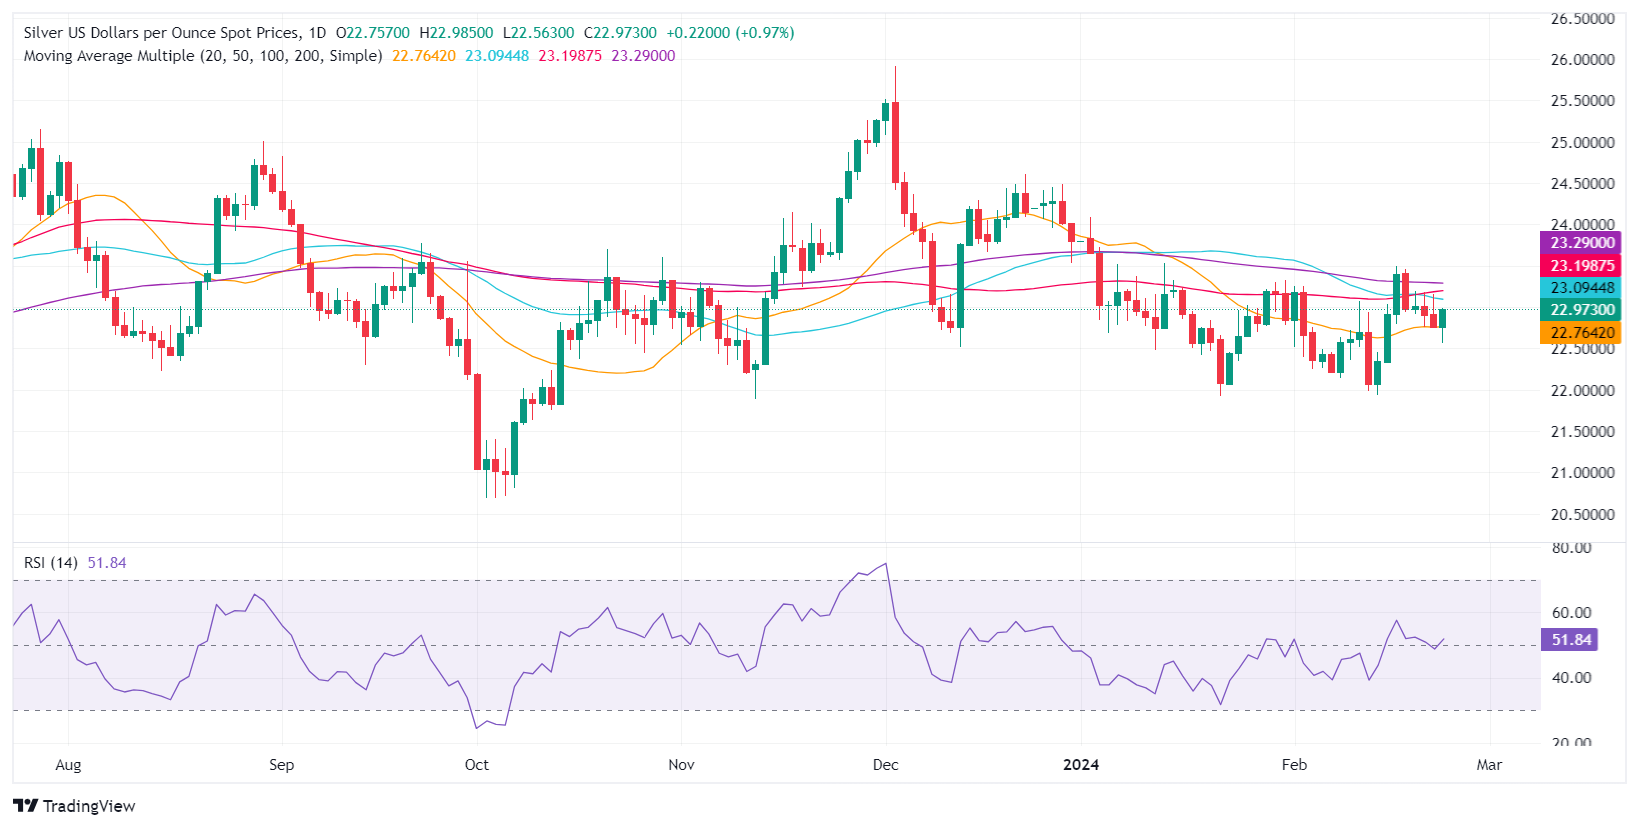
From a technical standpoint, the XAG/USD remains downward biased despite pushing through the $22.90 figure, but it remains shy of shifting neutral. If buyers would like to regain control, they must break stir resistance levels above $23.00. The first level would be the 50-day SMA at $23.08, followed by the 100-day SMA at $23.18. Once those two levels are taken out, the 200-day SMA would appear at $23.27 before rallying toward the next supply level at $24.00.
On the flip side, sellers need to keep XAG/USD’s spot price below $23.00 if they would like to remain in charge. In that event, they could drag Silver toward the February 23 low of $22.57, followed by the February 14 cycle low of $21.94.
XAG/USD Price Action – Daily Chart
-
23.02.2024 09:33Silver Price Analysis: XAG/USD seems vulnerable near one-week low, around mid-$22.00s
- Silver continues losing ground for the third straight day and drops to over a one-week low.
- The technical setup favours bears and supports prospects for a further depreciating move.
- A sustained strength beyond the 200-day SMA is needed to negate the negative outlook.
Silver (XAG/USD) drifts lower for the third successive day on Friday – also marking the fourth day of a negative move in the previous five – and drops to over a one-week low during the first half of the European session. The white metal currently trades around the $22.65-$22.60 region and seems vulnerable to prolong this week's pullback from over a one-month top.
The recent failure to find acceptance above a technically significant 200-day Simple Moving Average (SMA) and the subsequent downfall validates the near-term negative outlook for the XAG/USD. Furthermore, oscillators on the daily chart have just started gaining negative traction and suggest that the path of least resistance for the white metal is to the downside.
From current levels, weakness below the mid-$22.00s has the potential to drag the XAG/USD to the $22.30 horizontal support. Some follow-through selling might expose the two-month low, around the $21.90-$21.85 zone touched in January. Acceptance below the latter will be seen as a fresh trigger for bearish traders and make the XAG/USD vulnerable to test the $21.40-$21.35 area.
On the flip side, the daily swing high, around the $22.85 region, now seems to act as an immediate hurdle ahead of the $23.00 round-figure mark. A sustained strength beyond the latter could lift the XAG/USD to the 200-day SMA, currently near the $23.30 zone. This is followed by the monthly peak, around mid-$23.00s, which if cleared will negate the negative outlook.
The XAG/USD might then aim to reclaim the $24.00 round figure. The momentum could extend further and allow the white metal to climb towards the next relevant hurdle near the $24.50-$24.60 region en route to the $25.00 psychological mark.
Silver daily chart
-
22.02.2024 08:24Silver Price Analysis: XAG/USD sticks to strong gains above $23.00, eyes 100-day SMA
- Silver gains strong positive traction on Thursday and climbs back closer to the 100-day SMA barrier.
- The technical setup favours bullish traders and supports prospects for a further appreciating move.
- A sustained move and acceptance below $22.00 is needed to negate the near-term positive bias.
Silver (XAG/USD) builds on the overnight bounce from the 200-hour Simple Moving Average (SMA) support near the $22.75 area, or the weekly low and gains strong positive traction on Thursday. The momentum remains unabated through the first half of the European session and lifts the white metal to the $23.10-$23.15 region.
From a technical perspective, the XAG/USD is currently placed just below the 100-day SMA, which is closely followed by the very important 200-day SMA hurdle near the $23.30-$23.35 zone and the monthly peak, around mid-$23.00 touched last week. A sustained strength beyond the latter will be seen as a fresh trigger for bullish traders and pave the way for the resumption of last week's strong move up from sub-$22.00 levels.
Given that oscillators on the daily chart have just started gaining positive traction, the XAG/USD might then aim to reclaim the $24.00 round figure. The momentum could extend further and allow the white metal to climb towards the next relevant hurdle near the $24.50-$24.60 region en route to the $25.00 psychological mark.
On the flip side, the overnight swing low, around the $22.75 region, now seems to protect the immediate downside ahead of the mid-$22.00s and the $22.30 horizontal support. Some follow-through selling might expose the $22.00 mark. Acceptance below a two-month low, around the $21.90-$21.85 zone touched in January, will be seen as a fresh trigger for bearish traders and make the XAG/USD vulnerable to test the $21.40-$21.35 support.
The subsequent decline has the potential to drag the XAG/USD further below the $21.00 round-figure mark, towards retesting the October monthly swing low near the $20.70-$20.65 region.
Silver daily chart
Technical levels to watch
-
21.02.2024 08:29Silver Price Forecast: XAG/USD holds onto gains above $23 ahead of FOMC minutes
- Silver price clings to gains ahead of Fed minutes.
- The confidence of Fed policymakers that inflation is in the right direction has dampened the USD Index’s appeal.
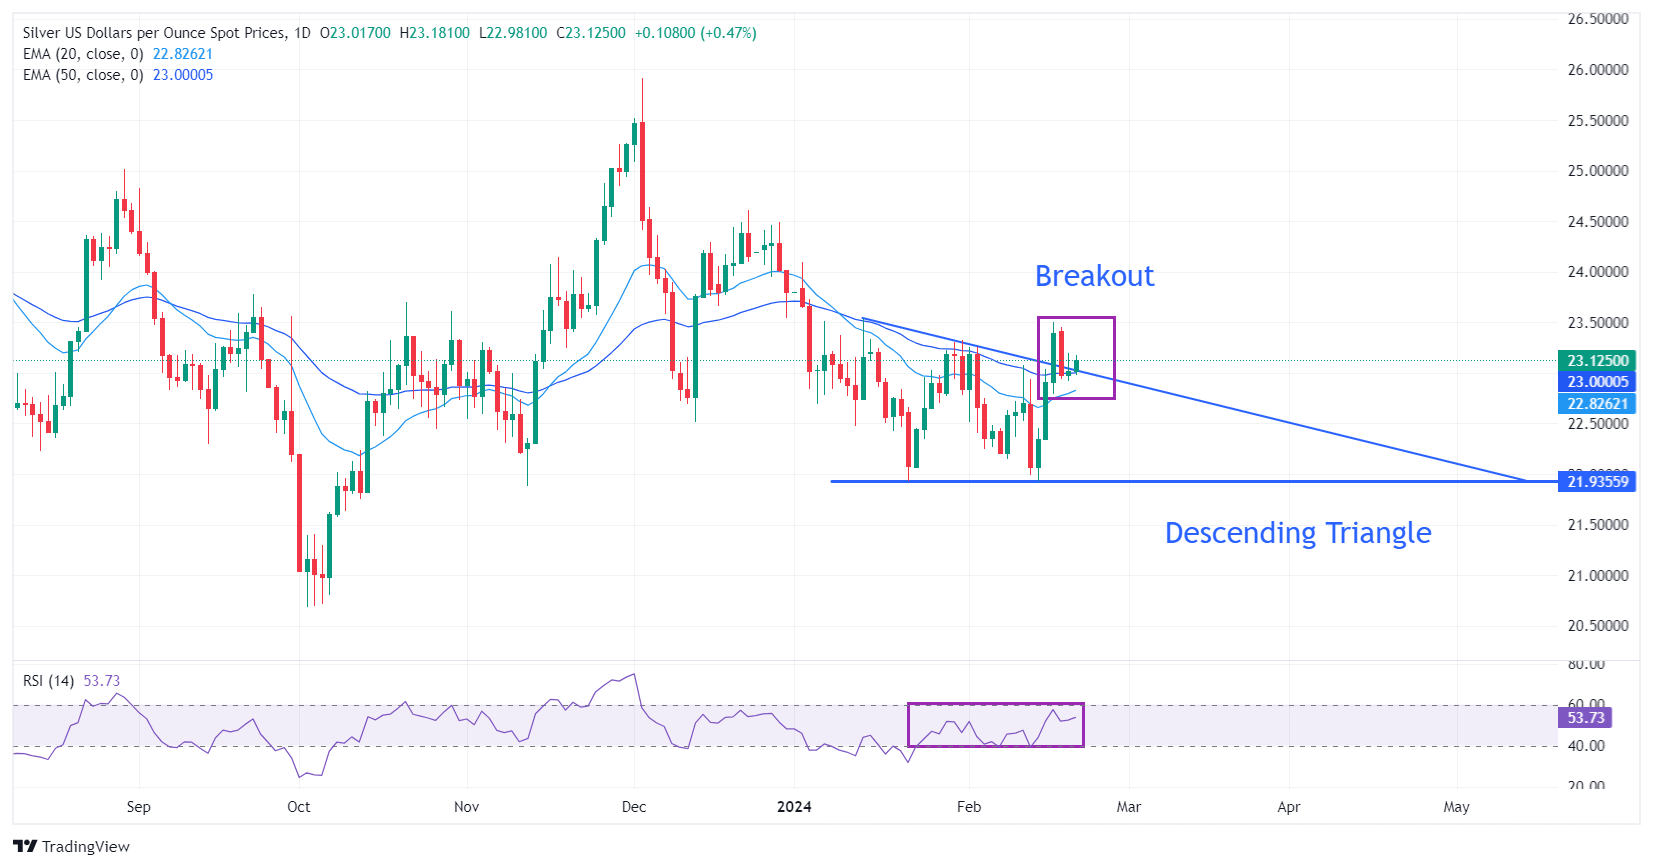
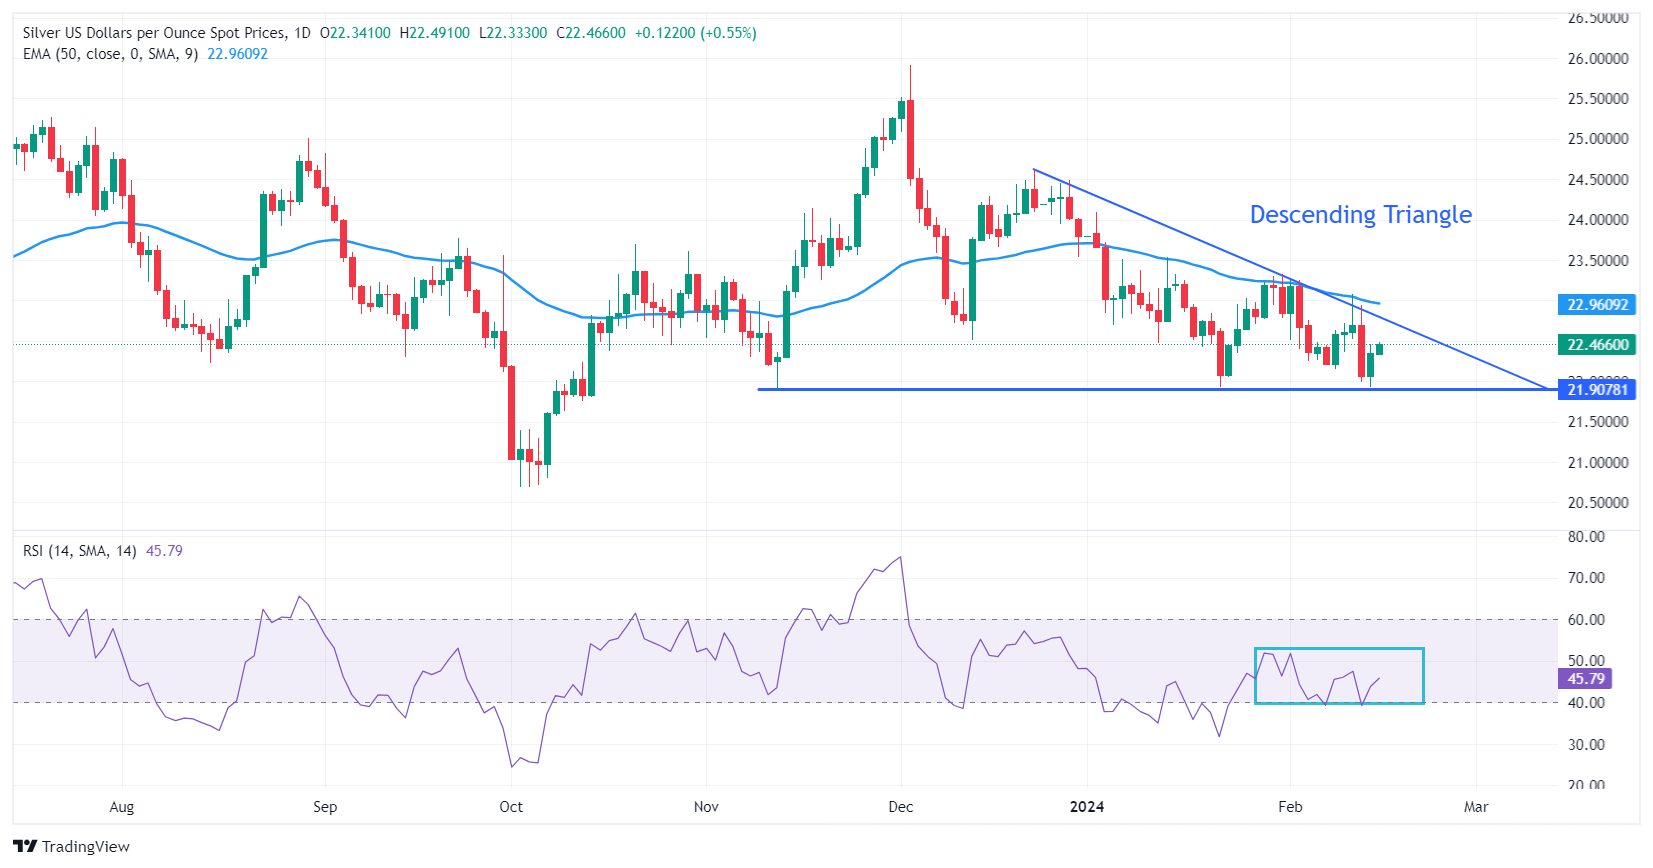
- Silver price is expected to deliver stellar gains amid a Descending Triangle breakout.
Silver price (XAU/USD) turns sideways around $23.15 after a strong recovery in the European session on Wednesday. The white metal clings to solid gains as the US Dollar has shifted to the backfoot AS Federal Reserve (Fed) policymakers are confident that the secular inflationary trend is in the right direction despite a one-time rise in price pressures in January
Mixed action is being observed in risk-perceived assets ahead of the release of the Federal Open Market Committee (FOMC) minutes. While S&P500 futures are under pressure, risk-sensitive currencies have been underpinned against the US Dollar. The US Dollar Index (DXY), which gauges the Greenback’s value against six rival currencies, is slightly above the weekly low of around 103.80.
The FOMC minutes will provide more guidance on interest rates and an in-depth explanation behind the Fed maintaining interest rates unchanged in the range of 5.25%-5.50% for the fourth time in a row.
This week, investors will focus on the preliminary S&P Global Manufacturing and Services PMI for February, which will be published on Thursday. The Manufacturing PMI is forecasted to decrease to 50.5 from 50.7 in January. The Services PMI that represents the service sector, which accounts for two-thirds of the United States economy, is expected to release at 52.0, lower than the prior reading of 52.5.
Silver technical analysis
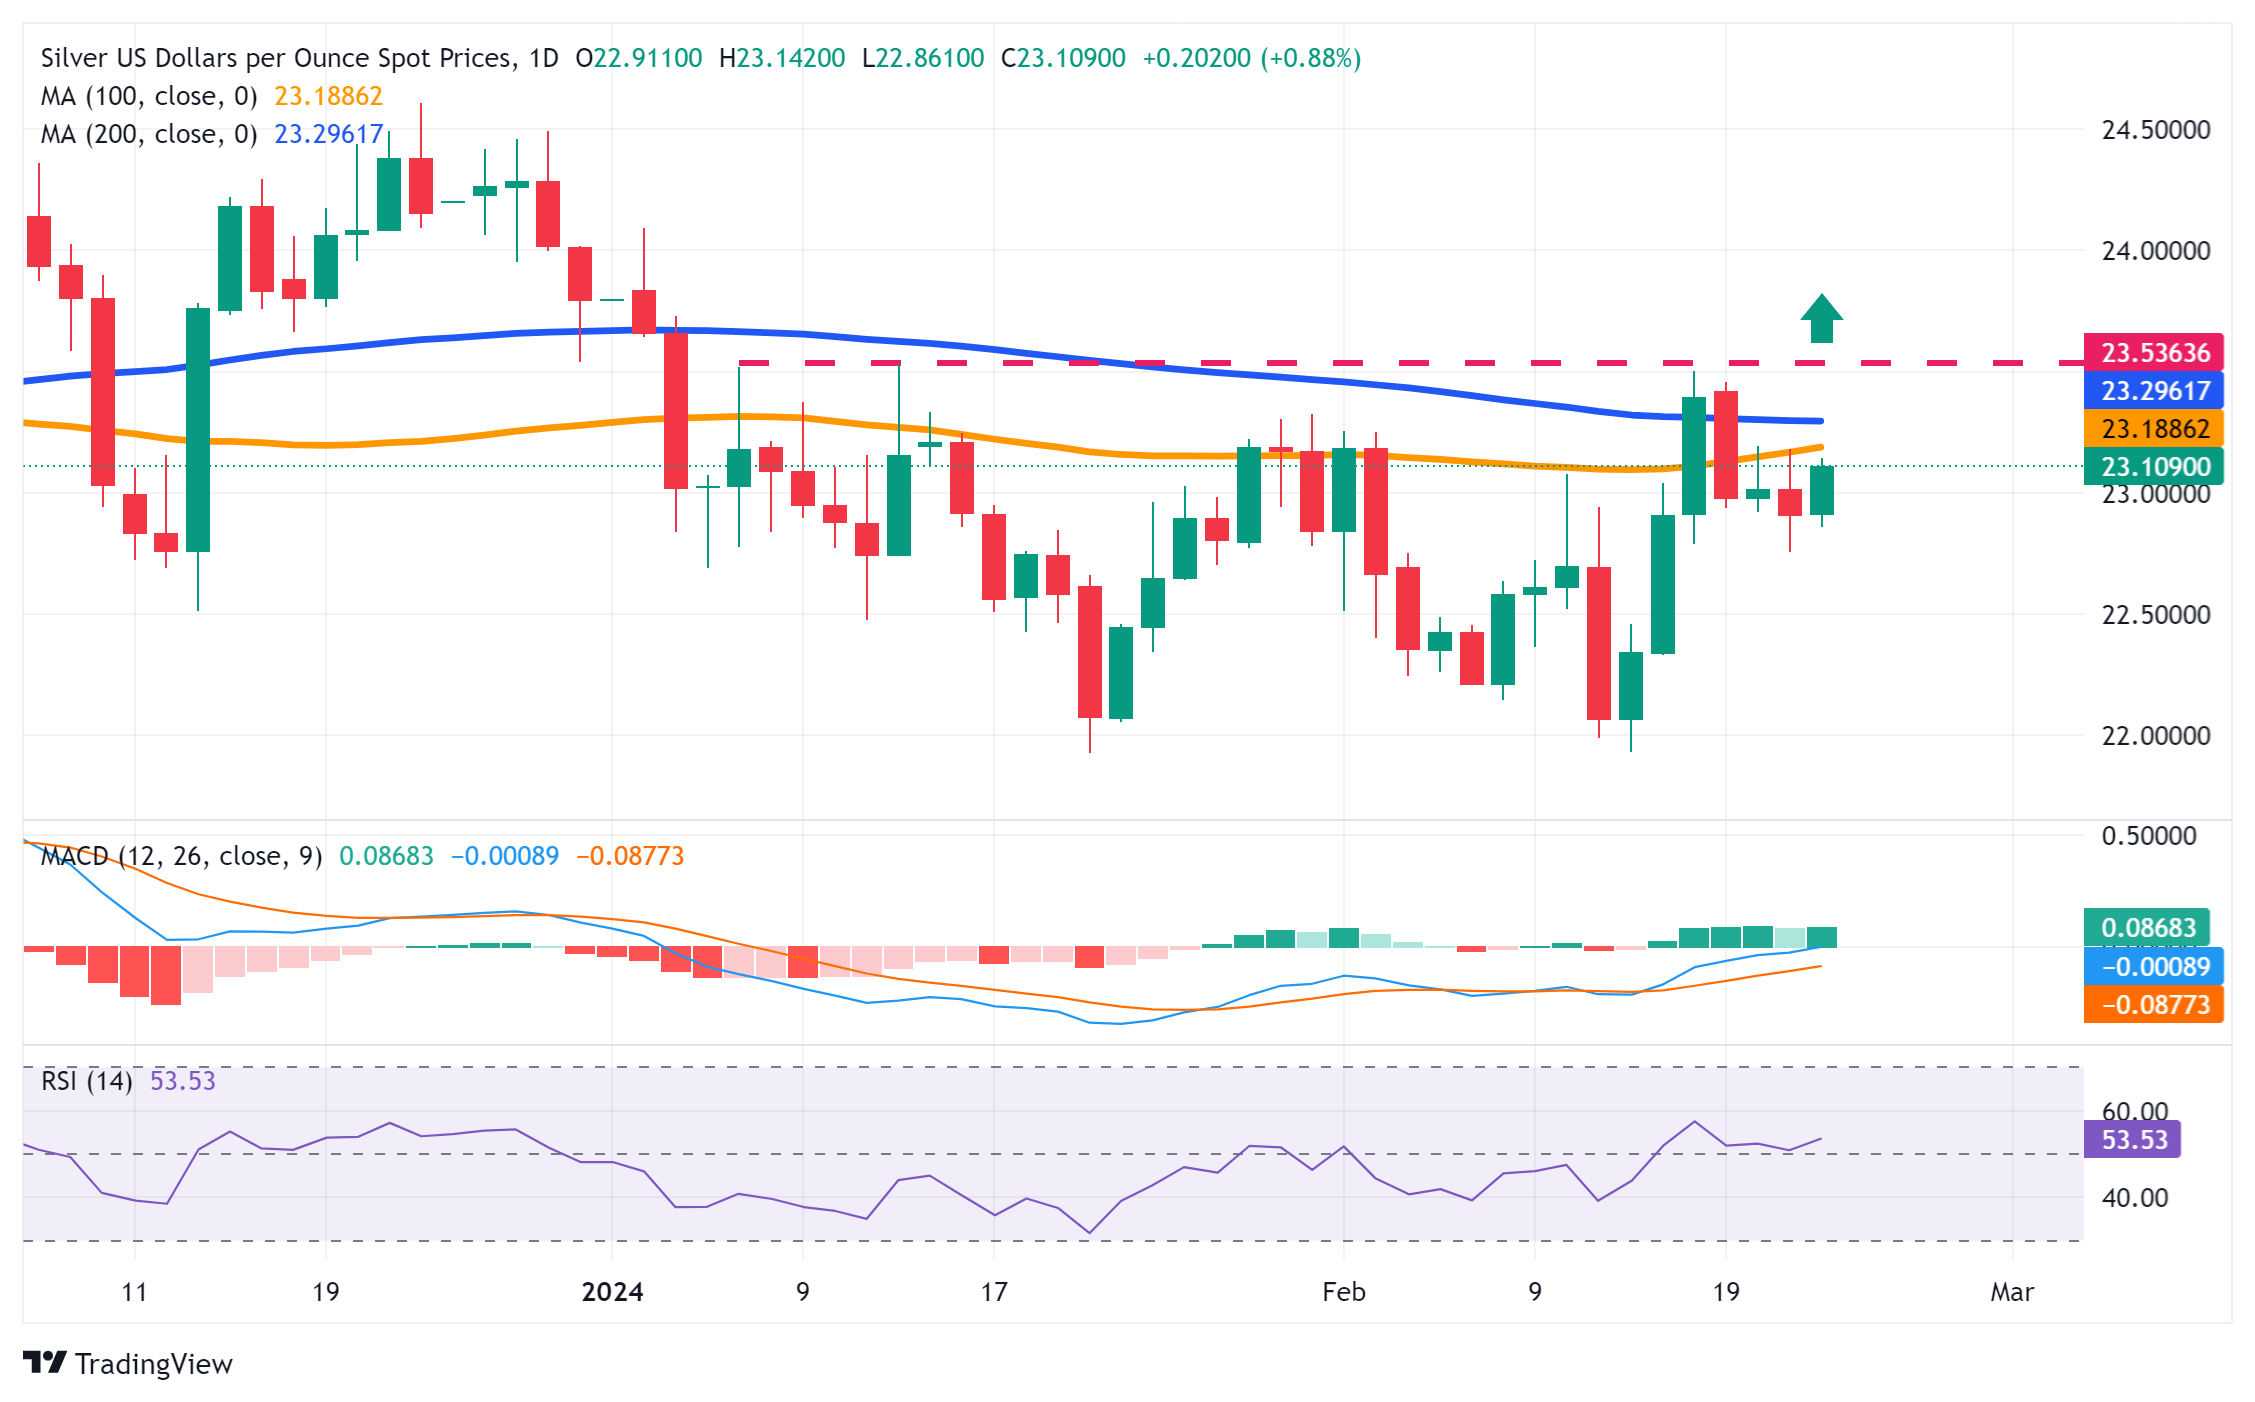
Silver price rebounds after testing the breakout region of the Descending Triangle chart pattern formed on a daily timeframe near $23.00. The near-term outlook for the white metal has turned bullish as it has comfortably settled above the 20 and 50-day Exponential Moving Averages (EMAs), which trade around $22.80 and $23.00, respectively.
The 14-period Relative Strength Index (RSI) approaches the 60.00 hurdle. A decisive break above the same would trigger a bullish momentum.
Silver daily chart
-
20.02.2024 20:51Silver Price Analysis: XAG/USD prints slight gains yet remains below $23.00
- Silver rises slightly to $22.99, supported by lower US Treasury yields and a weaker Dollar, boosting demand for precious metals.
- Facing technical resistance at $23.13-15, with the 200-DMA at $23.28 posing a major obstacle for further gains.
- Downside risk if silver breaches $23, eyeing February's lows; success above immediate resistances critical for upward momentum.
Silver clings to minuscule gains late in the New York session on Tuesday, up 0.04%, and is trading at around $22.99 a troy ounce. Falling US Treasury bond yields and the Greenback are the main catalysts for the rise in precious metals, while technical resistance levels capped the XAG/USD upside.
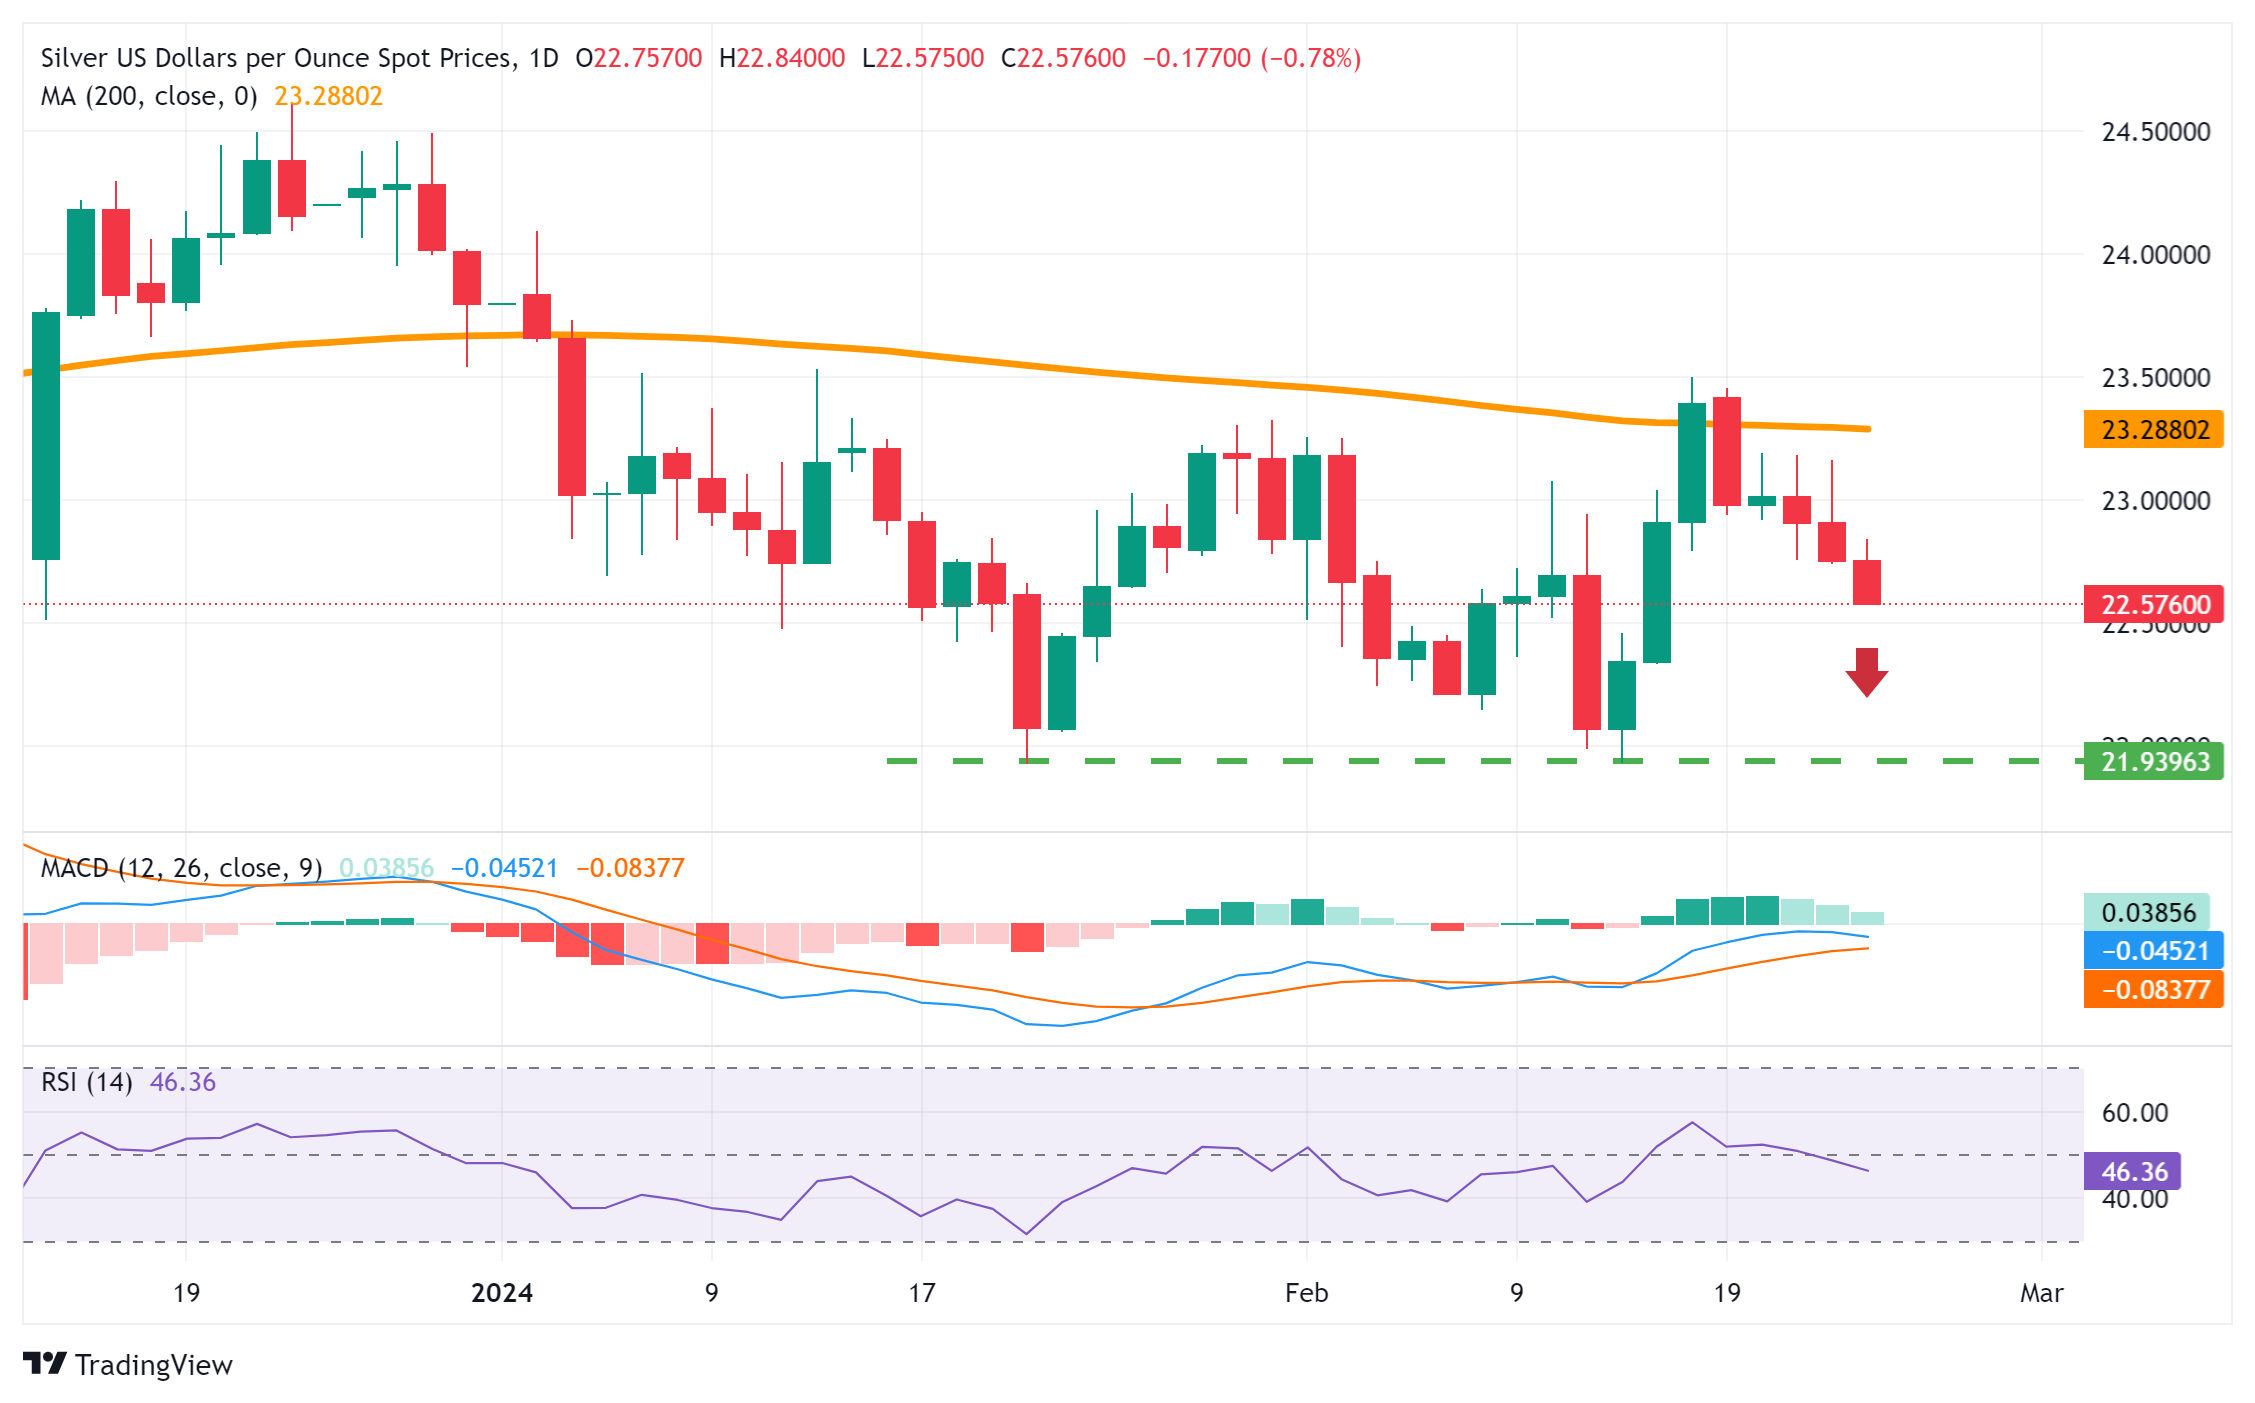
XAG/USD rose briefly toward the confluence of the 50 and 100-day Moving Averages (DMAs) at around $23.13-15 during Tuesday’s session but failed to challenge the 200-DMA at $23.28. As a ‘dark cloud cover’ looms, bears dragged Silver’s price below $23.00, which could open the door to test the February 18 low of $22.80. A breach of the latter will accelerate the downtrend towards the February 15 low of $22.35, followed by the $22.00 figure.
Conversely, if buyers reclaim $23.15, that will open the door for further gains. The first resistance would be the 200-DMA at $23.28, followed by the current year-to-date (YTD) high at $24.09.
XAG/USD Price Action – Daily Chart
-
15.02.2024 20:17Silver Price Analysis: XAG/USD rallies toward $23.00 shy of 100-DMA
- Silver jumps over 2.50%, as lower US bond yields boost appeal.
- Potential 'morning star' formation hints at upside if silver surpasses the $22.94 mark.
- Resistance at $23.08-$23.13 and support at $22.45 and $22.00 critical for next moves.
Silver price surged sharply in Thursday’s session after hitting a daily low of $22.35, as US Treasury bond yields plunged, a tailwind for the grey metal. The XAG/USD trades at $22.92, up by more than 2.50%, with traders eyeing a break of stir resistance.
XAG/USD Price Analysis: Technical outlook
XAG/USD remains neutral to downward bias because it remains below the 100, 50, and 200-day moving averages (DMAs). Nevertheless, a daily close above the February 13 high of $22.94 would form a ‘morning star,’ opening the door for further upside. If buyers reclaim the $23.00 figure, that will open the door to challenge the confluence of the 100 and 50-DMA at around $23.08-$23.13. A breach of the latter, the next stop would be the 200-DMA at $23.29.
Conversely, if the non-yielding metal remains below $23.00, the first support emerges at the February 14 high at $22.45. Once cleared, the next support would be the $22.00 figure, followed by the February 14 at $21.94.
XAG/USD Price Action – Daily Chart
-
15.02.2024 06:21Silver Price Forecast: XAG/USD stabilizes above $22 on subdued USD Index, US Retail Sales eyed
- Silver price seems steady above $22 while US Dollar corrects.
- Fed Goolsbee said one-time persistent inflation is insufficient to temper long-term downtrend.
- The US Retail Sales data will guide the Silver price.
Silver price (XAG/USD) manages to shift its auction above the crucial resistance of $22 in the early European session on Thursday as investors digest that rate cuts by the won’t be announced Federal Reserve (Fed) atleast before June. The expectations of a rate cut by the Fed in the May monetary policy meeting have cooled down significantly on the persistent inflation outlook.
S&P500 futures has generated nominal gains in the late Asian session, portraying a marginal improvement in the risk appetite of the market participants. The US Dollar Index (DXY) has corrected gradually to 104.70 from three-month near 105.00. 10-year US Treasury yields have dropped to 4.24%.
On Wednesday, Chicago Fed Bank President Austan Goolsbee said one bad inflation data could not impact the broader trend, which is that price pressures are coming down to the 2% target. When asked about the timing of rate cuts, Goolsbee said the central doesn’t need to wait to reduce inflation to the 2% target to begin reducing the benchmark rates.
In today’s session, investors will focus on the United States Retail Sales data for January, which will be published at 13:30 GMT. The monthly Retail Sales are anticipated to have contracted by 0.1% after expanding 0.6% in December.
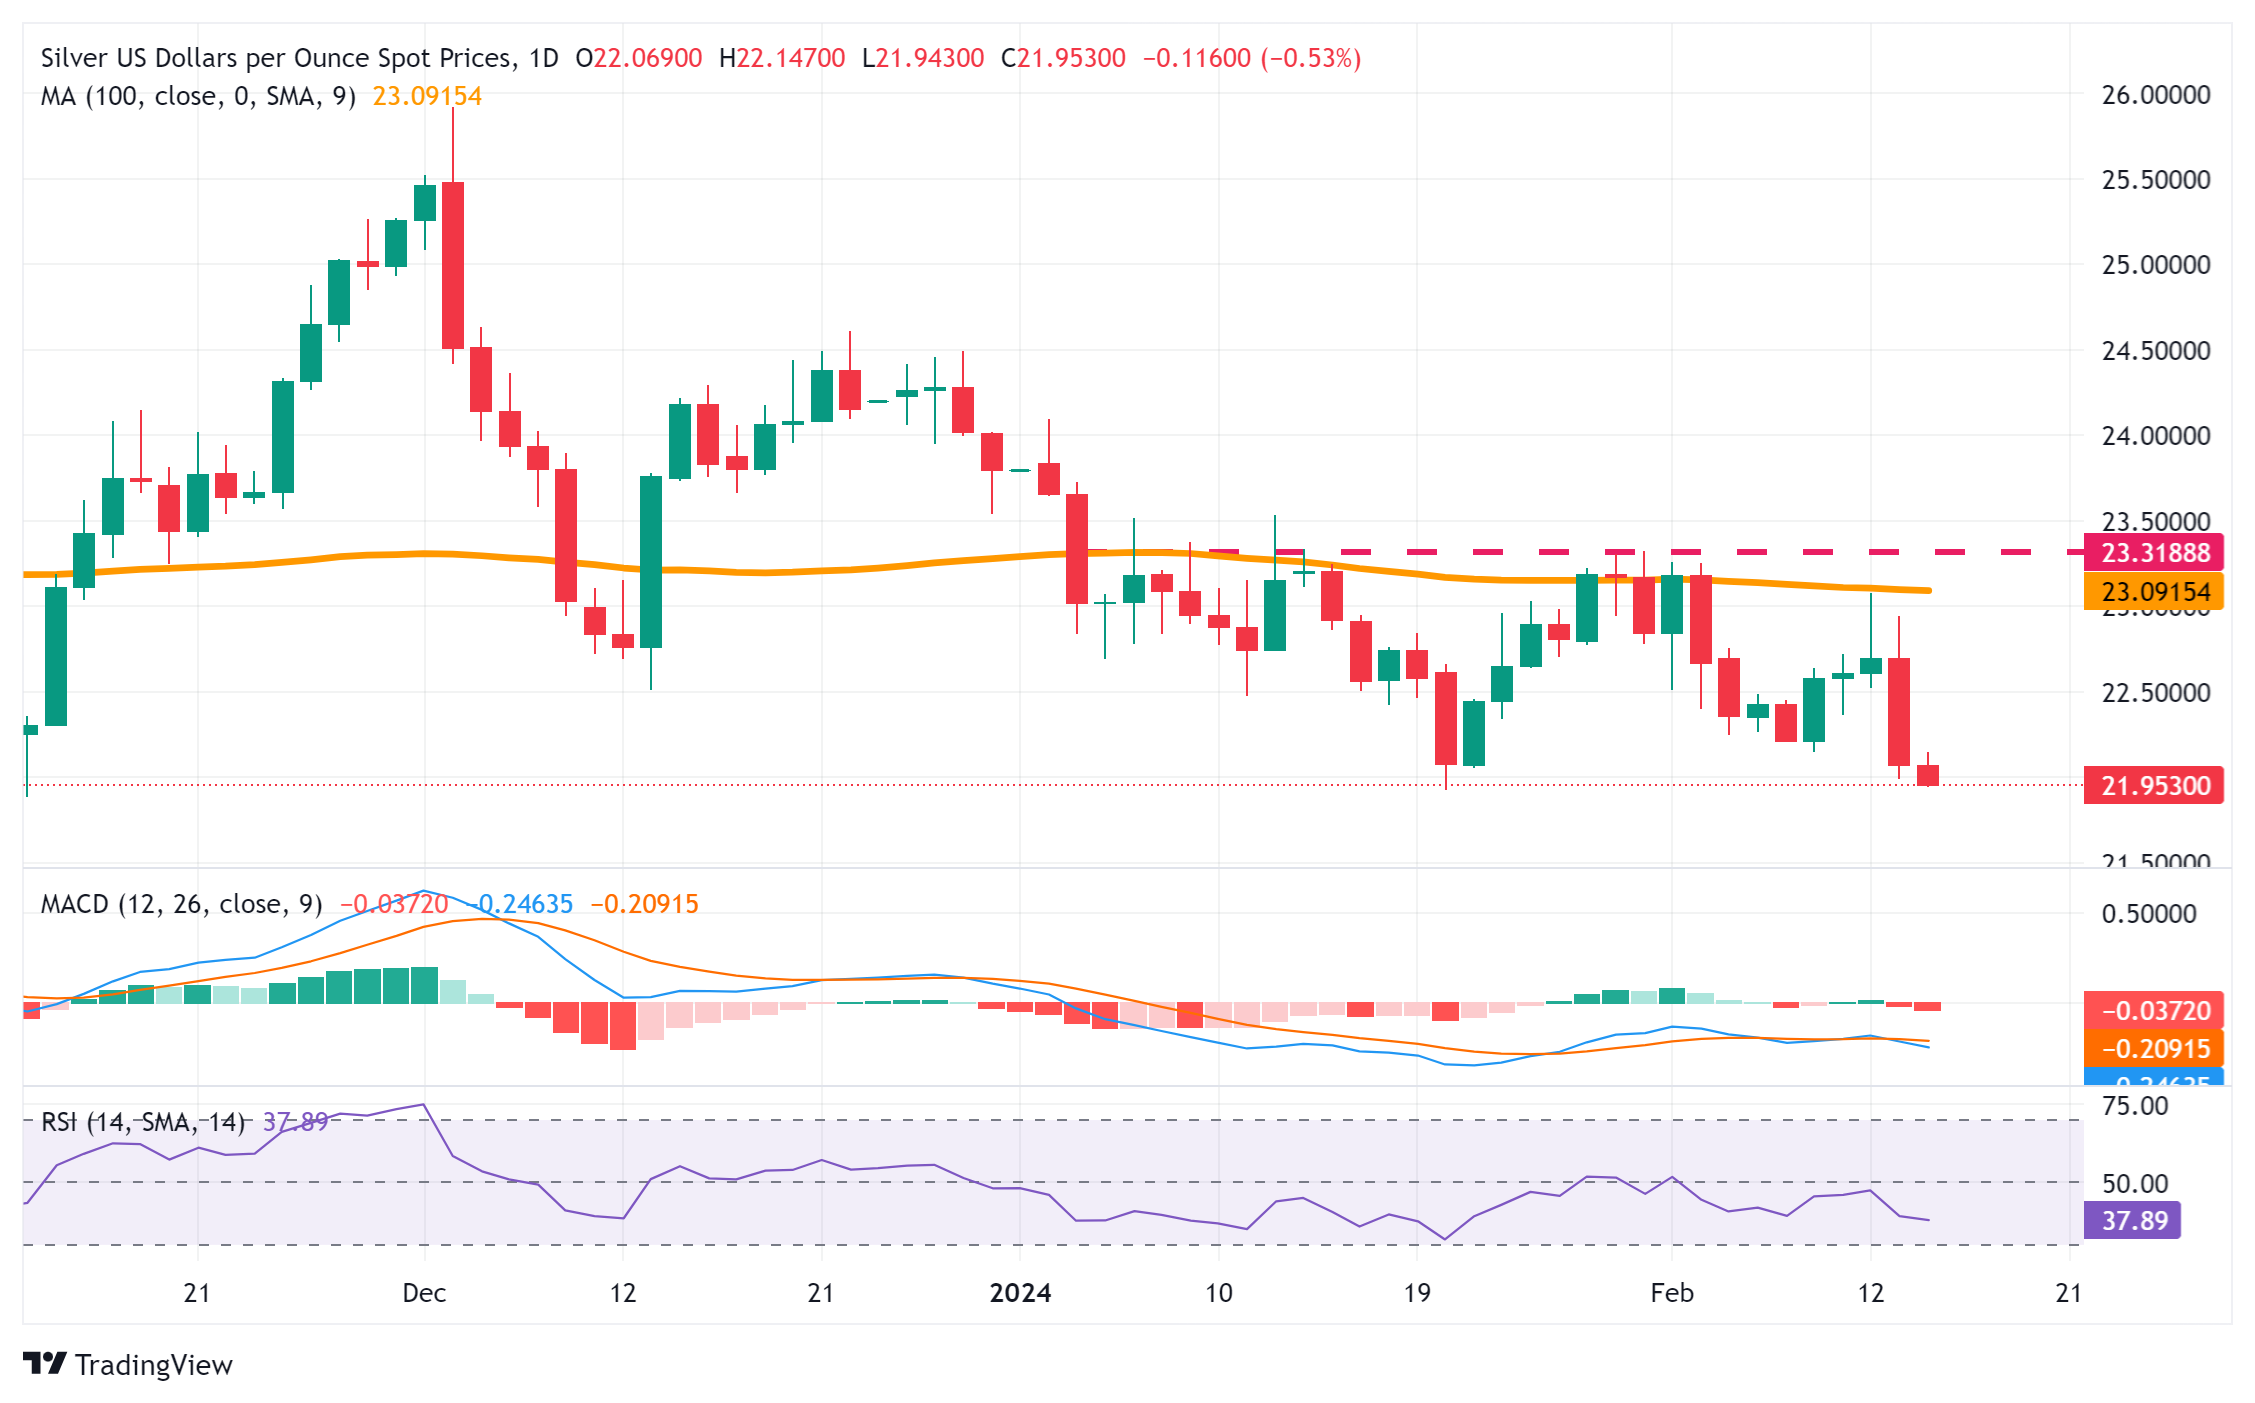
Silver technical analysis
Silver price trades in a Descending Triangle Chart pattern on a daily scale, which indicates a volatility contraction but with a negative bias. The 50-day Exponential Moving Average (EMA) near $23 continues to act as a barricade for the Silver price bulls.
The 14-period Relative Strength Index (RSI) consistently discovers support near 40.00. A slippage below the same would trigger a downside momentum.
Silver daily chart
-
14.02.2024 08:51Silver Price Analysis: XAG/USD hangs near YTD low, seems poised to decline further
- Silver adds to the overnight heavy losses and drops closer to a two-month low set in December.
- The technical setup favours bearish traders and supports prospects for further near-term losses.
- Any attempted recovery could get sold into and is likely to remain capped near the $23.50 area.
Silver (XAG/USD) remains under some selling pressure for the second successive day and slides back closer to the YTD trough during the first half of the European session on Wednesday. The white metal currently trades below the $22.00 round figure and seems to extend the depreciating move.
From a technical perspective, the recent repeated failures near the very important 200-day Simple Moving Average (SMA) and a subsequent slide validate the near-term negative outlook for the XAG/USD. Furthermore, oscillators on the daily chart are holding deep in the negative territory and are still away from being in the oversold zone. This, in turn, suggests that the path of least resistance for the white metal remains to the downside.
Meanwhile, some follow-through selling below the two-month low touched in December will expose the $21.40-$21.35 support. The XAG/USD could weaken further below the $21.00 mark and aim to retest the October swing low near the $20.70-$20.65 region.
On the flip side, any meaningful recovery attempt might now confront stiff resistance ahead of mid-$22.00s. A sustained strength beyond, however, might trigger a short-covering rally and allow the XAG/USD to reclaim the $23.00 round-figure mark. The momentum could extend towards the 200-day SMA, currently around the $23.20 area. This is followed by the $23.50 supply zone, which if cleared decisively will negate the negative outlook.
The XAG/USD might then aim to reclaim the $24.00 round figure and climb further towards the next relevant hurdle near the $24.50-$24.60 region en route to the $25.00 psychological mark.
Silver daily chart
Key technical levels to watch
-
13.02.2024 06:14Silver Price Forecast: XAG/USD consolidates around $22.70 ahead of US Inflation data
- Silver price trades lackluster around $22.70 as the focus remains on US inflation data.
- Soft inflation data would uplift hopes of early rate cuts by the Fed.
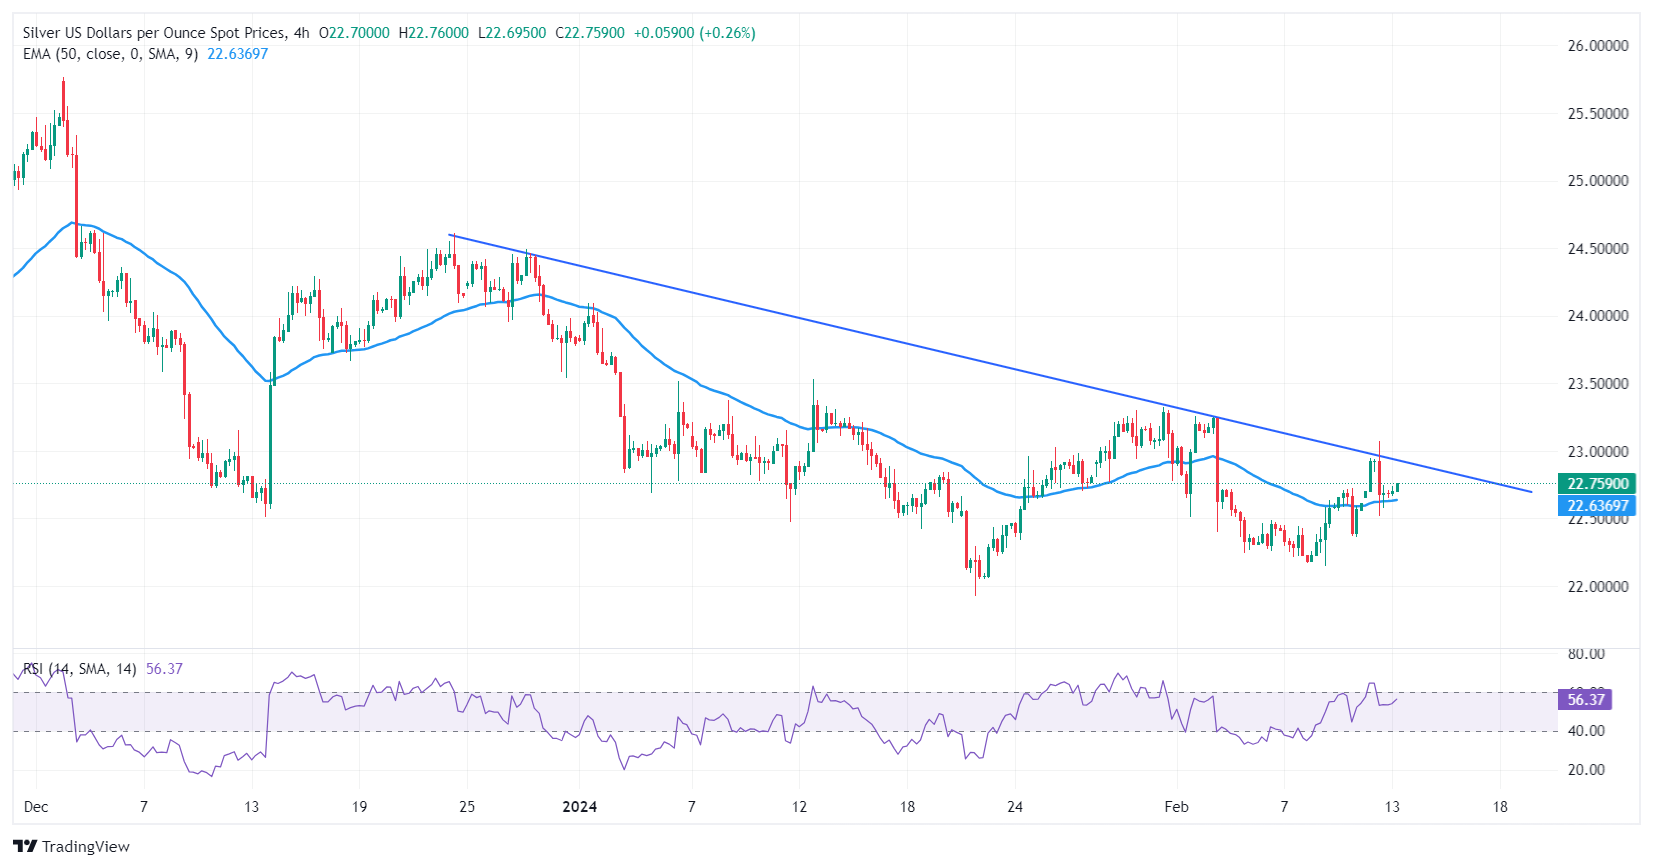
- Silver price is consistently facing pressure from a downward-sloping trendline placed from $24.60.
Silver price (XAG/USD) trades back and forth in a narrow range around $22.70 in the late Asian session on Tuesday. The white metal struggles for a direction as investors await the United States Consumer Price Index (CPI) data for January, which will be published at 13:30 GMT.
S&P500 futures remain on the backfoot in the Tokyo session, indicating a decline in the risk appetite of the market participants. The US Dollar Index (DXY) remains positive but struggles to extend upside above the crucial resistance of 104.25. 10-year US Treasury yields rise to 4.18%.
The US inflation data is expected to impact the outlook for interest rates. As per the CME Fedwatch tool, traders bet for a rate cut by 25 basis points (bps) in May. A significant decline in the inflation data would prompt expectations of an early rate cut by the Federal Reserve (Fed).
In the last monetary policy statement, Fed Chair Jerome Powell ruled out expectations of a rate cut in March as the central bank is unconvinced about inflation declining towards the 2% target. Also, Fed policymakers have not favored aggressive rate cuts as they could increase price pressures again.
Silver technical analysis
Silver price faces pressure while extending recovery above the downward-sloping trendline plotted from December 22 high at $24.60. The asset manages to sustain above the 50-period Exponential Moving Average (EMA) at $22.63, which indicates that the near-term outlook is bullish.
The 14-period Relative Strength Index (RSI) aims to move above 60.00. A bullish momentum would get triggered if the RSI (14) manages to do so.
Silver four-hour chart


© 2000-2024. All rights reserved.
This site is managed by Teletrade D.J. LLC 2351 LLC 2022 (Euro House, Richmond Hill Road, Kingstown, VC0100, St. Vincent and the Grenadines).
The information on this website is for informational purposes only and does not constitute any investment advice.
The company does not serve or provide services to customers who are residents of the US, Canada, Iran, The Democratic People's Republic of Korea, Yemen and FATF blacklisted countries.
Making transactions on financial markets with marginal financial instruments opens up wide possibilities and allows investors who are willing to take risks to earn high profits, carrying a potentially high risk of losses at the same time. Therefore you should responsibly approach the issue of choosing the appropriate investment strategy, taking the available resources into account, before starting trading.
Use of the information: full or partial use of materials from this website must always be referenced to TeleTrade as the source of information. Use of the materials on the Internet must be accompanied by a hyperlink to teletrade.org. Automatic import of materials and information from this website is prohibited.
Please contact our PR department if you have any questions or need assistance at pr@teletrade.global.
transfers