- Analytics
- News and Tools
- Quotes
- Chart and quotes for USDCAD
CFD Trading Rate US Dollar vs Canadian Dollar (USDCAD)
| Date | Rate | Change |
|---|
Related news
-
18.03.2024 11:04USD/CAD Price Analysis: Stabilizes above 1.3500 ahead of Canada Inflation, Fed policy
- USD/CAD exhibits strength above 1.3500 ahead of an eventful week.
- The Fed is widely anticipated to hold interest rates unchanged in the range of 5.25%-5.50%.
- The Canadian Dollar faces pressure ahead of consumer inflation data for February.
The USD/CAD pair seems comfortable above the psychological resistance of 1.3500 in the European session on Monday. The Loonie asset clings to gains amid uncertainty ahead of the interest rate decision by the Federal Reserve (Fed), which will be announced on Wednesday.
While the Fed is certain to keep interest rates unchanged in the range of 5.25%-5.50%, market participants will keenly focus on the release of the dot plot, which details policymakers’ projections for interest rates over time and the latest economic projections.
The US Dollar Index (DXY), which tracks the US Dollar’s value against six major currencies, drops slightly to 103.40, while the Loonie asset is positive, indicating weakness in the Canadian Dollar.
The Canadian Dollar has come under pressure ahead of the February inflation data, which will be published on Tuesday. The annual headline Consumer Price Index (CPI) is anticipated to have accelerated to 3.1% from 2.9% in January. Hotter-than-anticipated inflation data will delay the Bank of Canada’s (BoC) plans to reduce interest rates.
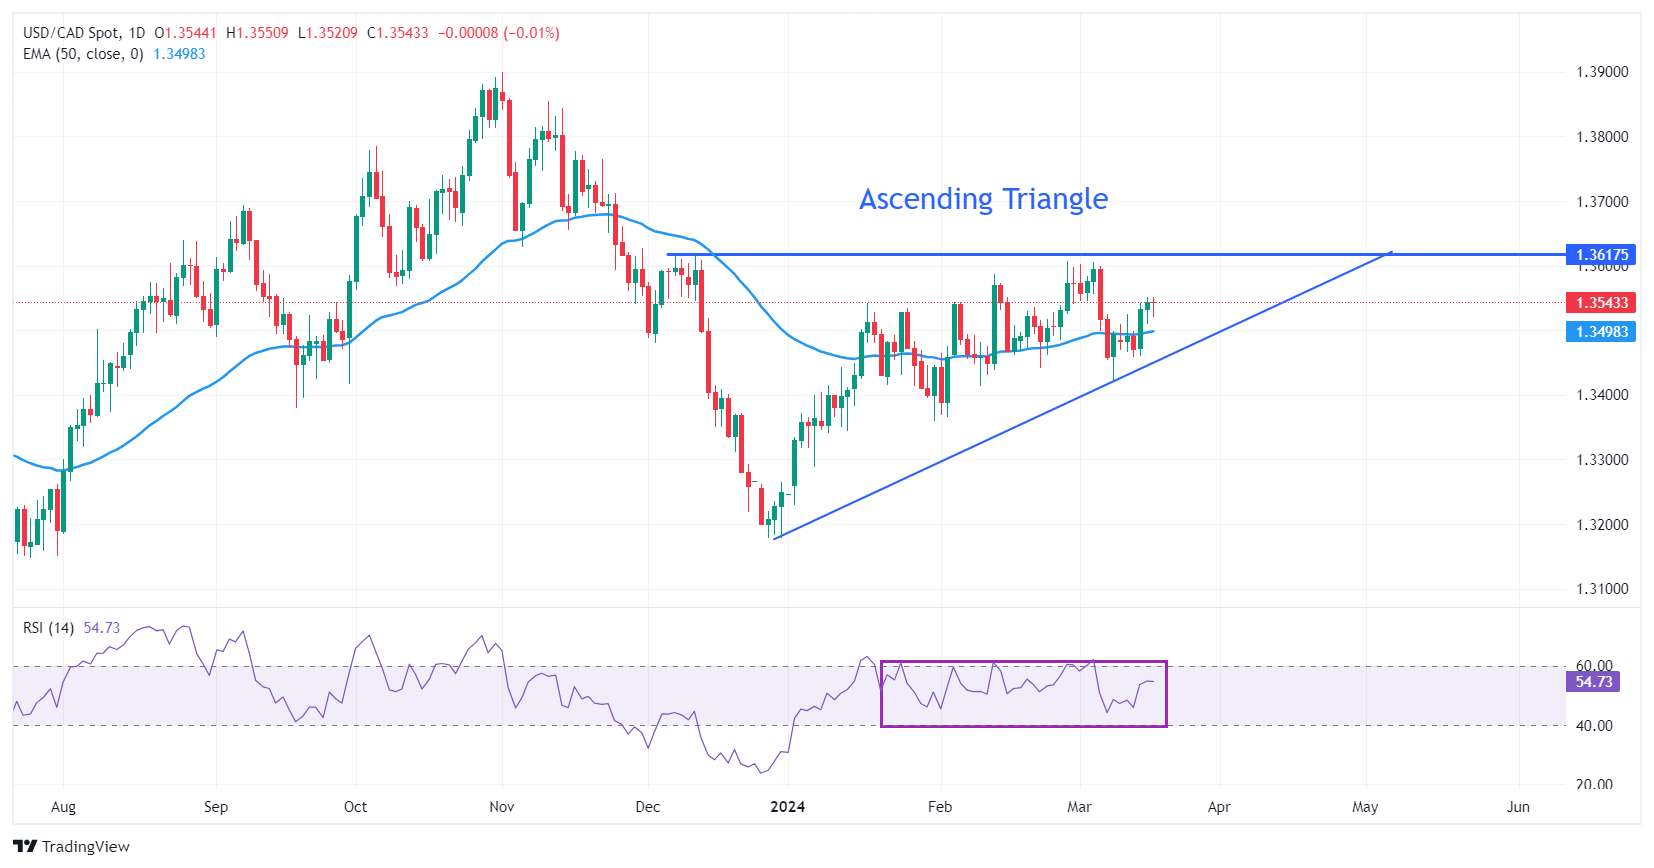
USD/CAD trades inside Friday’s trading range around 1.3540. Earlier, the Loonie asset rebounded from the upward-sloping border of the Ascending Triangle pattern formed on a daily timeframe, plotted from the December 27 low at 1.3177. The horizontal resistance of the aforementioned pattern is placed from December 7 high at 1.3620.
The 50-day Exponential Moving Average (EMA) near 1.3500 continues to support the US Dollar bulls.
The 14-period Relative Strength Index (RSI) oscillates inside the 40.00-60.00 region, which indicates indecisiveness among investors.
The fresh upside would appear if the asset breaks above the December 7 high at 1.3620, which will drive the asset towards the May 26 high at 1.3655, followed by the round-level resistance of 1.3700.
On the flip side, a downside move below February 22 low at 1.3441 would expose the asset to February 9 low at 1.3413. A breakdown below the latter would extend downside towards January 15 low at 1.3382.
USD/CAD daily chart
-
18.03.2024 04:21USD/CAD inches higher to near 1.3540, focus on Canadian CPI, Fed policy
- USD/CAD appreciates to continue its winning streak on Monday.
- US Dollar could gain ground on expectations of the Fed maintaining higher interest rates to combat inflation.
- The higher WTI price could limit the losses of the Canadian Dollar.
USD/CAD kicks off the week with its third consecutive day of gains on Monday, inching higher to near 1.3540 during the Asian trading session. The US Dollar (USD) could be bolstered by expectations that the Federal Reserve (Fed) will uphold its narrative of maintaining higher interest rates to combat inflation, which could further mitigate significant downside for the USD/CAD pair. The Fed is also set to update its Dot Plot projection, outlining interest rate expectations for the next one to five years.
Meanwhile, the US Dollar Index (DXY) struggles to sustain its position in positive territory, hovering around 103.50 at the time of writing. However, downward pressure on the US Dollar is evident due to a correction in US Treasury yields. The 2-year and 10-year US Treasury yields are currently at 4.72% and 4.30%, respectively.
On the flip side, the Canadian Dollar (CAD) may find some support from the surge in Crude oil prices. West Texas Intermediate (WTI) oil price continues its upward climb, reaching near $80.90 per barrel, by the press time. The positive momentum in Crude oil prices is driven by concerns over supply disruptions due to heightened geopolitical risks.
Traders are likely anticipating the release of the Canadian Consumer Price Index (CPI) data scheduled for Tuesday. Expectations suggest that the year-over-year consumer price will show an increase in February. A higher reading in the CPI could contribute a bullish sentiment for the Loonie Dollar (CAD). Additionally, the US Manufacturing Purchasing Managers Index (PMI) is set to be released on Thursday.
-
15.03.2024 11:22USD/CAD Price Analysis: Exhibits strength above 1.3500 as focus shifts to Fed policy
- USD/CAD clings to gains above 1.3500 as Fed rate cut hopes for June wane.
- Investors shift focus to the Fed’s interest rate decision in which the central bank is expected to maintain a status quo.
- The IEA raises Oil demand forecasts by 110K bpd for 2024.
The USD/CAD pair holds strength above the psychological support of 1.3500 in Friday’s European session. The Loonie asset turns sideways after a sharp recovery, prompted by diminished market expectations for the Federal Reserve (Fed) reducing interest rates in the June policy meeting.
Fed policymakers want to see price pressures declining for months to gain confidence that inflation will return sustainably to the desired rate of 2%. However, the United States Producer Price Index (PPI) data for February, released on Thursday, remained stubborn than expected due to rising gasoline and food prices. Tuesday’s consumer price inflation data for February was also sticky from expectations.
The US Dollar Index (DXY) trades sideways after a sharp recovery to 103.50 as investors shift focus to the Fed’s policy decision, which will be announced on Wednesday. The Fed is widely anticipated to keep interest rates unchanged in the range of 5.25%-5.50% but the release of the dot plot and economic projections will be keenly watched.
Meanwhile, the Oil price turns sluggish after a two-day rally. The broader strength in the Oil price remains intact as the International Energy Agency (IEA) has raised its 2024 oil demand forecasts by 110K bpd (barrels per day). It is worth noting that Canada is the leading exporter of Oil to the US and higher oil prices support the Canadian Dollar.
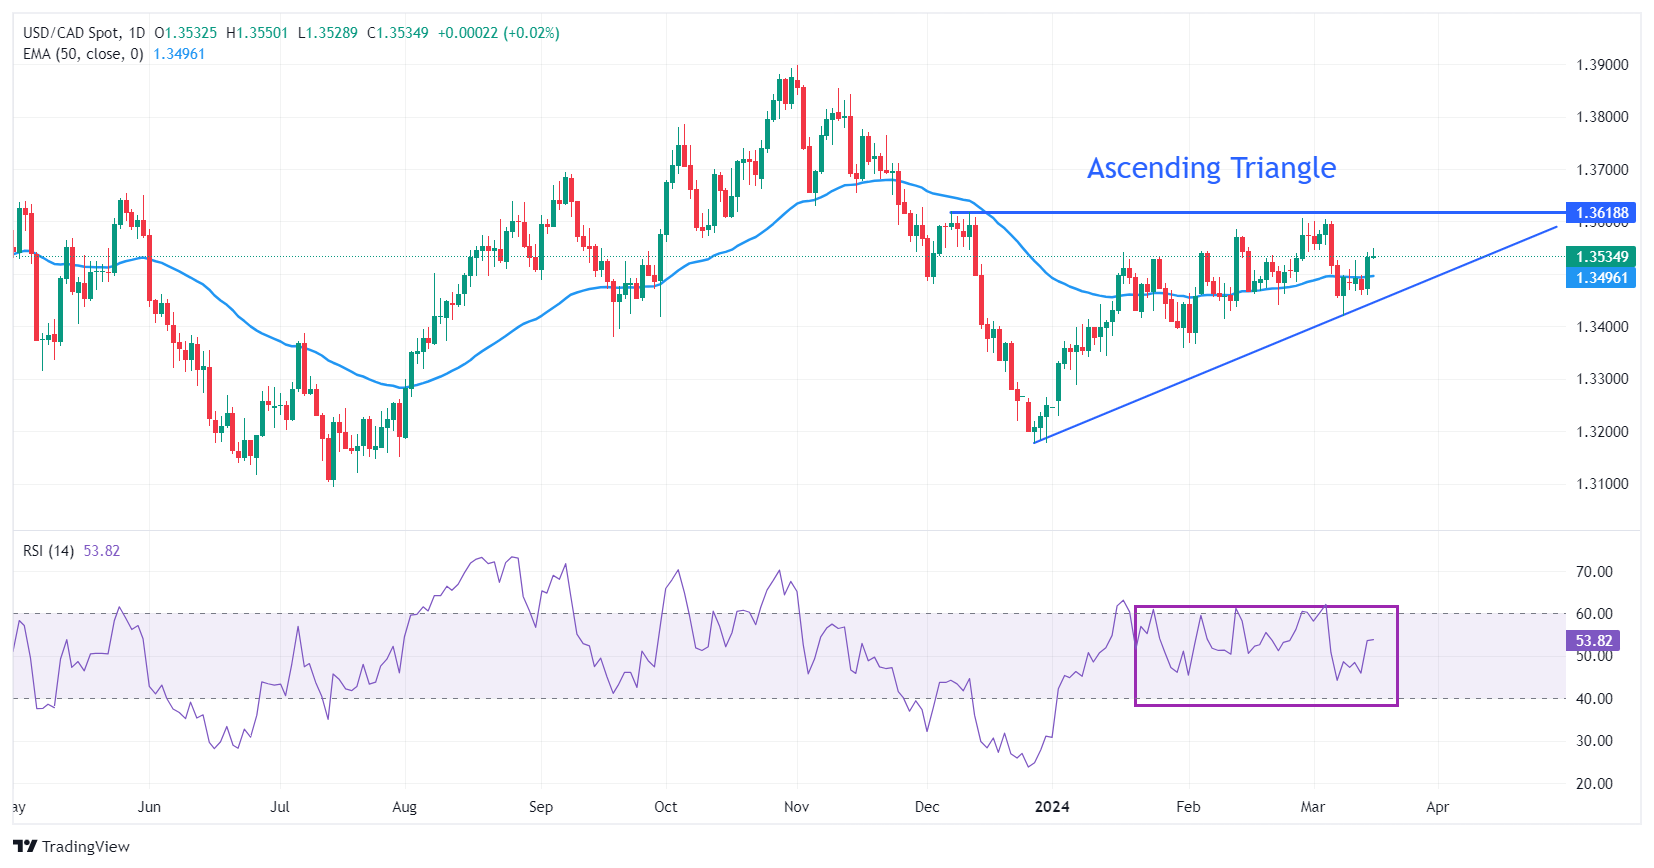
USD/CAD rebounds from the upward-sloping border of the Ascending Triangle pattern, placed from the December 27 low at 1.3177. The horizontal resistance of the aforementioned pattern, formed on a daily timeframe, is plotted from the December 7 high at 1.3620. The near-term trend is bullish as the pair is trading above the 50-day Exponential Moving Average (EMA), which trades around 1.3500. However, investors would gain more conviction after a triangle breakout.
The triangle could break out in either direction. However, the odds marginally favor a move in the direction of the trend before forming the triangle – in this case, up. A decisive break above or below the triangle boundary lines would indicate a breakout is underway.
The 14-period Relative Strength Index (RSI) falls back into the 40.00-60.00 region, which indicates persistent indecisiveness among investors.
Fresh upside would appear if the asset breaks above December 7 high at 1.3620, which will drive the asset towards May 26 high at 1.3655, followed by the round-level resistance of 1.3700.
On the flip side, a downside move below February 22 low at 1.3441 would expose the asset to February 9 low at 1.3413. A breakdown below the latter would extend the downside towards January 15 low at 1.3382.
USD/CAD daily chart
-
15.03.2024 04:19USD/CAD rises to near 1.3540, focus shifts to the Michigan Consumer Sentiment Index
- USD/CAD extends its gains after stronger US Producer Price Index (PPI) data.
- US Core PPI remained at 2.0% YoY and rose by 0.3% MoM in February.
- Higher WTI price could provide support for the Canadian Dollar.
USD/CAD gains ground for the second successive session on Friday. Wednesday’s hotter-than-expected US Consumer Inflation data has reduced the likelihood of the Federal Reserve (Fed) cutting interest rates soon. This sentiment is further bolstered by Thursday’s Producer Inflation figures from the United States (US). As a result, the USD/CAD pair trades higher around 1.3540 at the time of this update.
The US Dollar Index (DXY) benefits from the hawkish sentiment surrounding the US Fed, which is considering prolonging its higher interest rates due to persistent inflationary pressures. US Treasury yields have increased in the previous four consecutive sessions, providing support to the US Dollar (USD). The DXY remains in the green zone around 103.40, with the 2-year and 10-year yields on US Treasury bonds correcting at 4.68% and 4.28%, respectively.
The US Core Producer Price Index (PPI) held steady with a 2.0% year-over-year increase in February, surpassing expectations which were set at 1.9%. The US PPI (YoY) experienced a 1.6% increase, exceeding both the expected 1.1% and the previous 1.0%.
US Retail Sales rose by 0.6% monthly, below the expected 0.8% in February, swinging from the previous decline of 1.1%. While Retail Sales Control Group improved to a flat 0.0%, compared to the previous decline of 0.3%. Traders will likely keep an eye on the preliminary US Michigan Consumer Sentiment Index for March, due to be released on Friday.
West Texas Intermediate (WTI) oil prices are on the rise for the third consecutive day, buoyed by signs of strong demand in the United States and an optimistic outlook for global consumption in 2024. This positive trend in Crude oil prices could offer support for the Canadian Dollar (CAD), as Canada is the largest oil exporter to the US. Consequently, this could limit the upside potential of the USD/CAD pair.
On Thursday, Canadian Manufacturing Sales showed a rebound to 0.2% in January, although it fell short of the forecasted 0.4%. Despite this, it marks a recovery from the previous month's decline of -1.1% (revised down from -0.7%). Investors will now turn their attention to Housing Starts and Wholesale Sales data scheduled for release on Friday.
-
14.03.2024 15:13USD/CAD set to move above 1.4000 in the second half of the year – NBF
The Loonie’s recent appreciation has been tepid considering the overall weakness of the US Dollar. In essence, the CAD has been the weakest of the strong over the past month. Economists at the National Bank of Canada analyze USD/CAD outlook.
Restrictive monetary policy in Canada can no longer be justified
The restrictive monetary policy in Canada can no longer be justified.
As we continue to believe that rate cuts will be more aggressive on this side of the border, we still see USD/CAD moving above 1.4000 in H2 2024.
-
14.03.2024 07:23USD/CAD Price Analysis: Reaches higher to near 1.3480 ahead of nine-day EMA
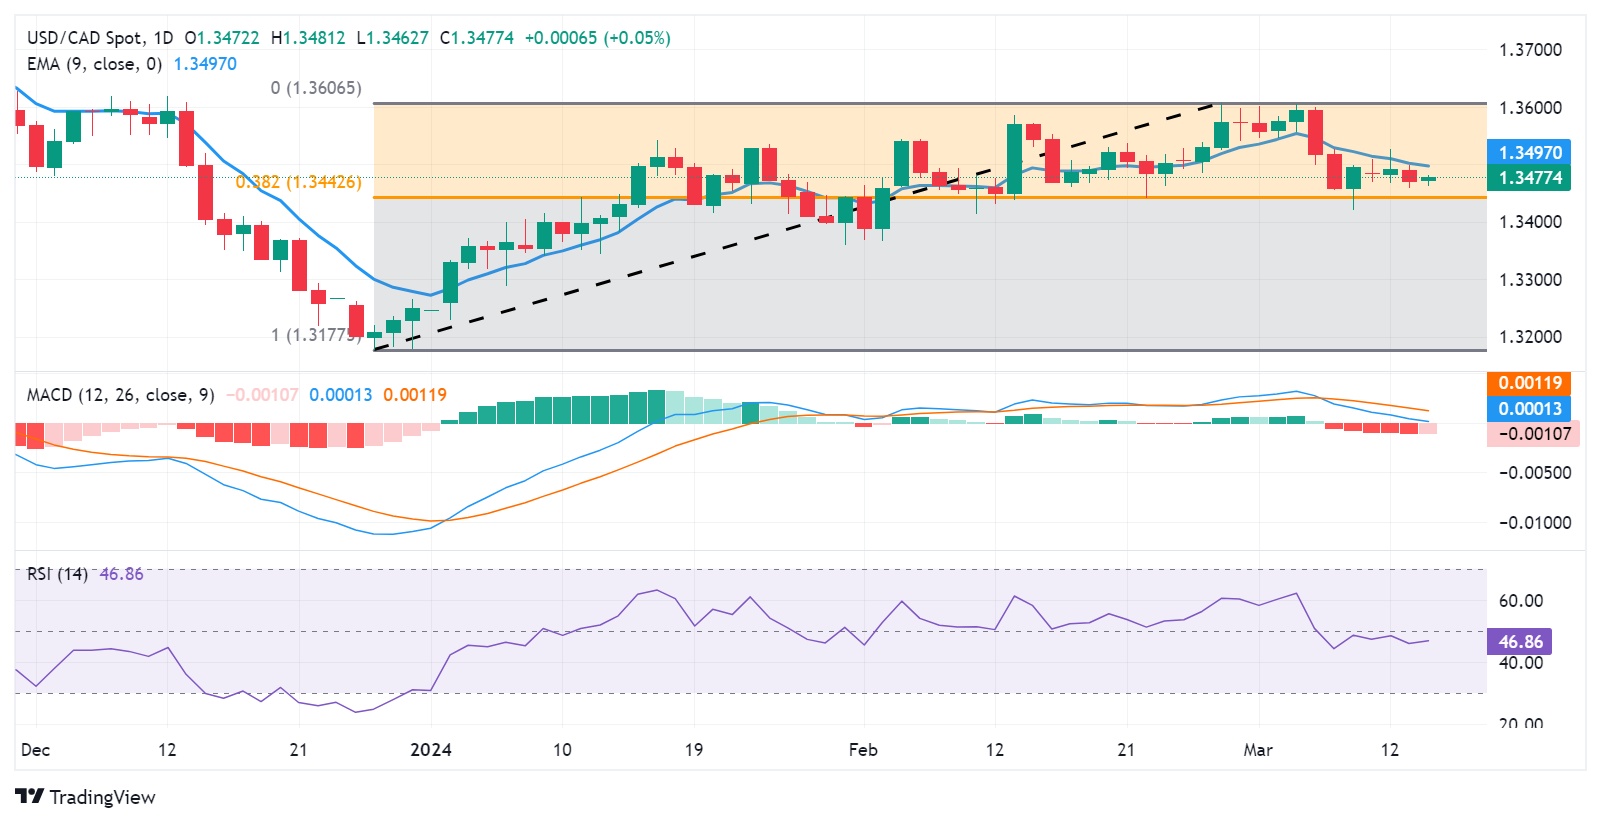
- USD/CAD could test a nine-day EMA of 1.3497 and a psychological level of 1.3500.
- The major level of 1.3450 and the 38.2% Fibonacci retracement level of 1.3442 could act as key support levels.
- A break above the 1.3600 level could lead the pair to test March’s high of 1.3605.
USD/CAD retraces its recent losses from the previous session, edging upwards to near 1.3480 during Thursday's European session. The US Dollar (USD) receives support from higher US Treasury yields, likely influenced by recent data indicating sticky inflation in the United States (US).
The immediate resistance is at the nine-day Exponential Moving Average (EMA) at 1.3497, coinciding with the psychological level of 1.3500.
A breakout above the psychological level could provide upward support for the USD/CAD pair, with the next resistance at the major level of 1.3550. Further upside momentum may target the region around the psychological level of 1.3600, aligned with March’s high of 1.3605.
On the downside, the USD/CAD pair may encounter significant support around the major level of 1.3450, followed by the 38.2% Fibonacci retracement level at 1.3442. A breach below this level could exert downward pressure on the pair, potentially leading it toward the support zone near the previous week’s low of 1.3419 and the psychological level of 1.3400.
The technical analysis indicates mixed signals for the USD/CAD pair. The 14-day Relative Strength Index (RSI) is positioned below 50, suggesting bearish momentum. However, the Moving Average Convergence Divergence (MACD) suggests a potential momentum shift.
The MACD line is above the centerline, indicating bullish momentum, but there is divergence below the signal line. Traders may await confirmation from the MACD, a lagging indicator, to determine the direction of the trend.
USD/CAD: Daily Chart
-
14.03.2024 01:08USD/CAD drifts lower to 1.3470, investors await US Retail Sales data
- USD/CAD loses traction near 1.3468 on the softer USD.
- The upbeat US CPI data might keep the Fed waiting until the summer before starting to cut rates.
- Markets believe the BoC will not move aggressively on interest rates.
- Investors will focus on the Canadian Manufacturing Sales and the US Retail Sales, due on Thursday.
The USD/CAD pair trades in negative territory for a second consecutive day during the early Asian session on Thursday. The US Dollar (USD) resumes its decline below the 103.00 mark and drags the pair lower. Investors await the US Retail Sales data on Thursday for fresh impetus, which is projected to rise 0.8% MoM in February. At press time, USD/CAD is trading at 1.3468, down 0.02% on the day.
The hotter-than-expected US inflation data earlier this week might keep the Federal Reserve (Fed) on course to wait at least until the summer before starting to lower interest rates. The headline CPI rose 3.2% YoY from January’s reading of 3.1%, while the Core CPI ticked lower to 3.8% YoY from the previous reading of 3.9%. Market players will take more cues from US February Retail Sales data as it might influence the Fed’s next move in its March meeting scheduled for next week. The stronger report might convince the Fed to focus on more data and allow policymakers to avoid having to rush to cut rates, which might lift the US Dollar (USD) and create a tailwind for the USD/CAD pair.
On the other hand, the Bank of Canada (BoC) left the interest rate unchanged earlier this month, as largely expected by the market. The BoC’s governor Tiff Macklem highlighted that lowering inflation close to target is the central bank’s priority. The markets anticipate that the BoC will not move aggressively or cut rates until after the Fed, which might be the upside potential for the Canadian Dollar (CAD) in the coming months.
Meanwhile, the rise in crude oil prices might boost the commodity-linked Loonie for the time being, as Canada is the largest oil exporter to the United States (US).
Moving on, the Canadian Manufacturing Sales is due on Thursday. On the US docket, traders will keep an eye on the US Retail Sales data for February, along with the Producer Price Index (PPI), Business Inventories, and usual weekly Initial Jobless Claims. -
13.03.2024 07:26USD/CAD moves sideways amid a stable US Dollar, floats around 1.3490
- USD/CAD could continue its winning streak on risk-off sentiment.
- US CPI YoY and MoM rose by 3.2% and 0.4%, respectively, in February.
- The higher Crude oil prices limit the losses of the Canadian Dollar.
USD/CAD could maintain its winning streak for the fourth consecutive session, with the pair trading higher around 1.3490 during the early European hours on Wednesday.
The US Dollar (USD) receives upward support from the prevailing market sentiment despite a potential for a rate cut by the Federal Reserve (Fed) in June, despite the release of upbeat Consumer Price Index (CPI) data on Tuesday.
According to the CME FedWatch Tool, the probability of a rate cut in March has decreased to 1.0%, while it stands at 15.6% for May. In June, the likelihood of a rate cut is estimated to be 66.6%.
In February, US CPI (YoY) increased by 3.2%, surpassing estimates of 3.1%. The monthly inflation met expectations at 0.4%, higher than the previously observed 0.3%. US Core CPI rose by 3.8% year-over-year, above the anticipated 3.7% but below the previous reading of 3.9%. The month-over-month figure remained steady at 0.4%, against the market expectations of 0.3%.
The rise in Crude oil prices may have provided upward support for the Canadian Dollar (CAD), thereby capping the upside potential of the USD/CAD pair. West Texas Intermediate (WTI) oil price edged higher to nearly $77.90 per barrel during the European hours at the time of writing.
Crude oil prices are anticipated to receive upward support due to a strong outlook for global demand. The Organization of the Petroleum Exporting Countries (OPEC) has maintained its forecast for relatively robust growth in global oil demand in 2024 and 2025.
The economic calendar for the Canadian Dollar does not contain high-impact data for the week. Attention will be on the US Core Producer Price Index (PPI) and Retail Sales data scheduled for release on Thursday.
-
13.03.2024 01:07USD/CAD posts modest gains below the 1.3500 barrier, investors await US Retail Sales data
- USD/CAD trades with a mild positive bias around 1.3492 in Wednesday’s early Asian session.
- The upbeat US CPI inflation data for February might convince the Fed to wait until the summer before starting rate cuts.
- Moody’s Analytics stated that the BoC is at risk of weakening the economy by not cutting interest rates sooner.
The USD/CAD pair posts modest gains below the 1.3500 mark during the early Asian session on Wednesday. The stronger-than-expected US inflation number weighs on market sentiment and provides some support for the pair. The US February Retail Sales will be the highlight for this week, which is projected to improve to 0.8% MoM. USD/CAD currently trades near 1.3492, adding 0.01% for the day.
The US inflation, as measured by the Consumer Price Index (CPI), unexpectedly increased to 3.2% YoY in February, keeping the Federal Reserve (Fed) on course to wait at least until the summer before starting to cut interest rates. Additionally, the Core CPI, excluding volatile food and energy prices, rose 0.4% MoM and 3.8% YoY, stronger than the estimation. The February CPI inflation data will play an important role in the Fed’s rate forecast. Investors anticipate the US central bank to keep rates between 5.25% and 5.5% in its March meeting scheduled for next week.
On the Loonie front, analysts are concerned about the economic slowdown in the Canadian economy. Moody’s Analytics stated that the Bank of Canada (BoC) is at risk of weakening the economy by not cutting interest rates sooner. Earlier this month, the BoC left the interest rate unchanged at 5% for the fifth consecutive meeting. The BoC governor Tiff Macklem said that core inflation remains a concern and emphasized that it was premature to talk about rate cuts.
Looking ahead, Canada’s Manufacturing Sales, Housing Starts, and Wholesale Sales for January will be published on Thursday. On the US docket, Retail Sales for February will be a closely watched event this week. This event could give a clear direction to the USD/CAD pair.
-
12.03.2024 12:30USD/CAD: Technical momentum is mildly bearish – Scotiabank
USD/CAD edges slightly lower. Economists at Scotiabank analyze the pair’s outlook.
Firm resistance at 1.3510/1.3520
Risk appetite looks relatively constructive in Asia (ex-Japan) and Europe while US equity futures are narrowly mixed. Crude is trading firmer on the session. These are mild positives for the CAD.
Technical momentum is mildly USD-bearish.
The pair eased back sharply from Monday’s intraday peak, leaving a negative tone to short-term price signals while shorter-term DMI oscillators are aligned bearishly for the USD. That should mean firm resistance at 1.3510/1.3520 intraday (strong resistance at 1.3600/1.3610 more generally).
Support is 1.3420.
-
12.03.2024 08:02USD/CAD Price Analysis: Drops to near 1.3470 followed by the major support
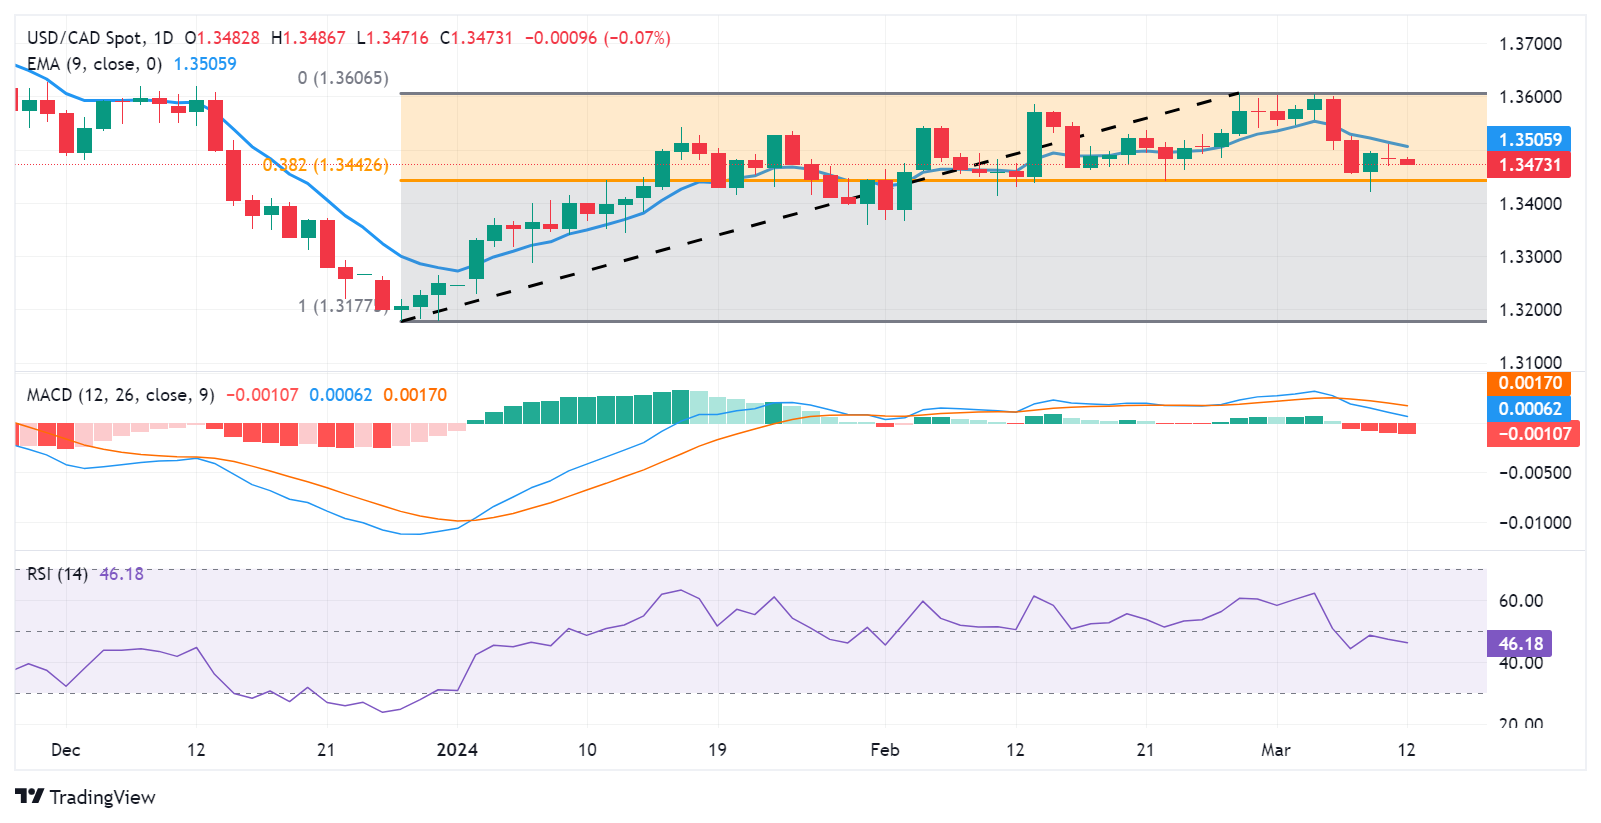
- USD/CAD could test the major support of 1.3450 on Tuesday.
- Technical analysis suggests a momentum shift in the trend.
- The key resistance zone could appear around the psychological level of 1.3500 and a nine-day EMA of 1.3506.
USD/CAD extends its losses for the second session, edging lower to near 1.3470 during the European session on Tuesday. The cautious sentiment prevails ahead of the release of the Consumer Price Index (CPI) data from the United States (US).
The USD/CAD pair could find key support at the major level of 1.3450, followed by the 38.2% Fibonacci retracement level of 1.3442. A break below this level could put downward pressure on the pair to navigate the support region around the previous week’s low of 1.3419 and psychological level of 1.3400.
The technical analysis of the 14-day Relative Strength Index (RSI) is positioned below 50, suggesting bearish momentum for the USD/CAD pair. However, Moving Average Convergence Divergence (MACD) indicates a momentum shift for the USD/CAD pair. This interpretation is based on the MACD line's position above the centerline but shows divergence below the signal line. Traders would likely await the MACD, the lagging indicator, to confirm a directional trend.
On the upside, the immediate resistance appears at the psychological level of 1.3500 and the nine-day Exponential Moving Average (EMA) at 1.3506. A break above the latter could exert upward support for the USD/CAD pair to test the major level of 1.3550, aiming to navigate the region around the psychological level of 1.3600, aligned with March’s high of 1.3605.
USD/CAD: Daily Chart
-
12.03.2024 01:09USD/CAD remains capped below the 1.3500 barrier, eyes on US CPI data
- USD/CAD weakens around 1.3478 on the softer USD.
- The Fed’s dovish comments and mixed US February labor market data reaffirmed the expectation for a June rate cut.
- BoC’s Macklem said it’s premature to ease monetary policy despite the recent cooling in inflation.
- Traders will closely monitor the US February Consumer Price Index (CPI) inflation data, due on Tuesday.
The USD/CAD pair remains caped under the key 1.3500 barrier during the early Asian session on Tuesday. The decline of the US Dollar (USD) and lower US Treasury bond yields weigh on the pair. Investors await the US Consumer Price Index (CPI) inflation data for February, due later on Tuesday. At press time, USD/CAD is trading at 1.3478, down 0.03% on the day.
The mixed US labor market data for February was not strong enough to convince the Fed of monetary policy expectations. Additionally, the dovish comments from Federal Reserve (Fed) officials last week reaffirmed the expectation for a June rate cut. Fed Chair Powell said last week during his semiannual testimony that more confidence is needed before the central bank is ready to lower the rate, but they’re not far from it. Money markets are pricing in around 70% odds of an interest rate cut by June, according to the CME FedWatch tool.
The Bank of Canada held the interest rate unchanged at 5.0% for the fifth consecutive meeting last week, as widely expected. However, the BoC governor Tiff Macklem said during a press conference that it’s premature to cut interest rates until there’s more progress in taming core inflation. He further stated that the central bank needs to give higher rates more time to do its work. Money markets have pushed back bets for a fully priced in rate cut to July from June. This, in turn, boosts the Canadian Dollar (CAD) against the USD.
Traders will closely monitor the US February inflation data on Tuesday. The headline CPI is expected to remain steady at 3.1% YoY, while the core figure is projected to drop to 3.7% YoY. On Thursday, attention will shift to US Retail Sales, which is forecast to improve to 0.8% in February. These events could give a clear direction to the USD/CAD pair. -
11.03.2024 13:04USD/CAD may nudge a little higher in the short run – Scotiabank
USD/CAD has steadied below 1.3500. Economists at Scotiabank analyze the pair’s outlook.
Potential bull flag pattern
The domestic data run is relatively light this week – just Manufacturing Sales, Housing Starts and Wholesale Sales, which are all out later in the week. This likely means the CAD will trade more off of external developments – the USD, asset markets – and technical factors in the next day or so.
Spot’s losses last week stalled in the low 1.3400s and price action leaves the door open for a little more corrective USD strength in the short run, potentially.
USD gains are consolidating just under 1.3500 in what could be a bull flag pattern (more gains above 1.3495/1.3500 intraday towards firmer resistance at 1.3540/1.3550.
USD support is 1.3420/1.3440.
-
11.03.2024 09:08USD/CAD Price Analysis: Faces pressure around 1.3500 on subdued US Dollar
- USD/CAD struggles to extend recovery above 1.3500 amid weak US Dollar.
- Cooling US labor market conditions indicate that Fed rate cut bets for June remain on the table.
- Slower Canada’s wage growth indicates that the inflation outlook is softening.
The USD/CAD pair faces pressure while attempting to extend recovery above the psychological resistance of 1.3500 in the European session on Monday. The Loonie asset is expected to resume its downside journey as the broader appeal for the US Dollar remains weak due to firm market expectations for the Federal Reserve (Fed) reducing interest rates in the June policy meeting.
The United States Nonfarm Payrolls (NFP) report for February, released on Friday, indicated that the Unemployment Rate rose to 3.9%, highest in two years, though in a comfortable range and monthly wage growth was significantly slower. On the contrary, labor demand remains robust as employers hired 275K workers against expectations of 200K.
Going forward, the US Dollar will be guided by the Consumer Price Index (CPI) data for February, which will be published on Tuesday and will provide fresh insights into the interest rate outlook.
On the Canadian Dollar front, slower wage growth has softened the inflation outlook. Annual Average Hourly Earnings grew at a significantly slower pace of 4.9% in February from a 5.3% increase in January. This could allow Bank of Canada (BoC) policymakers to consider reducing interest rates ahead.
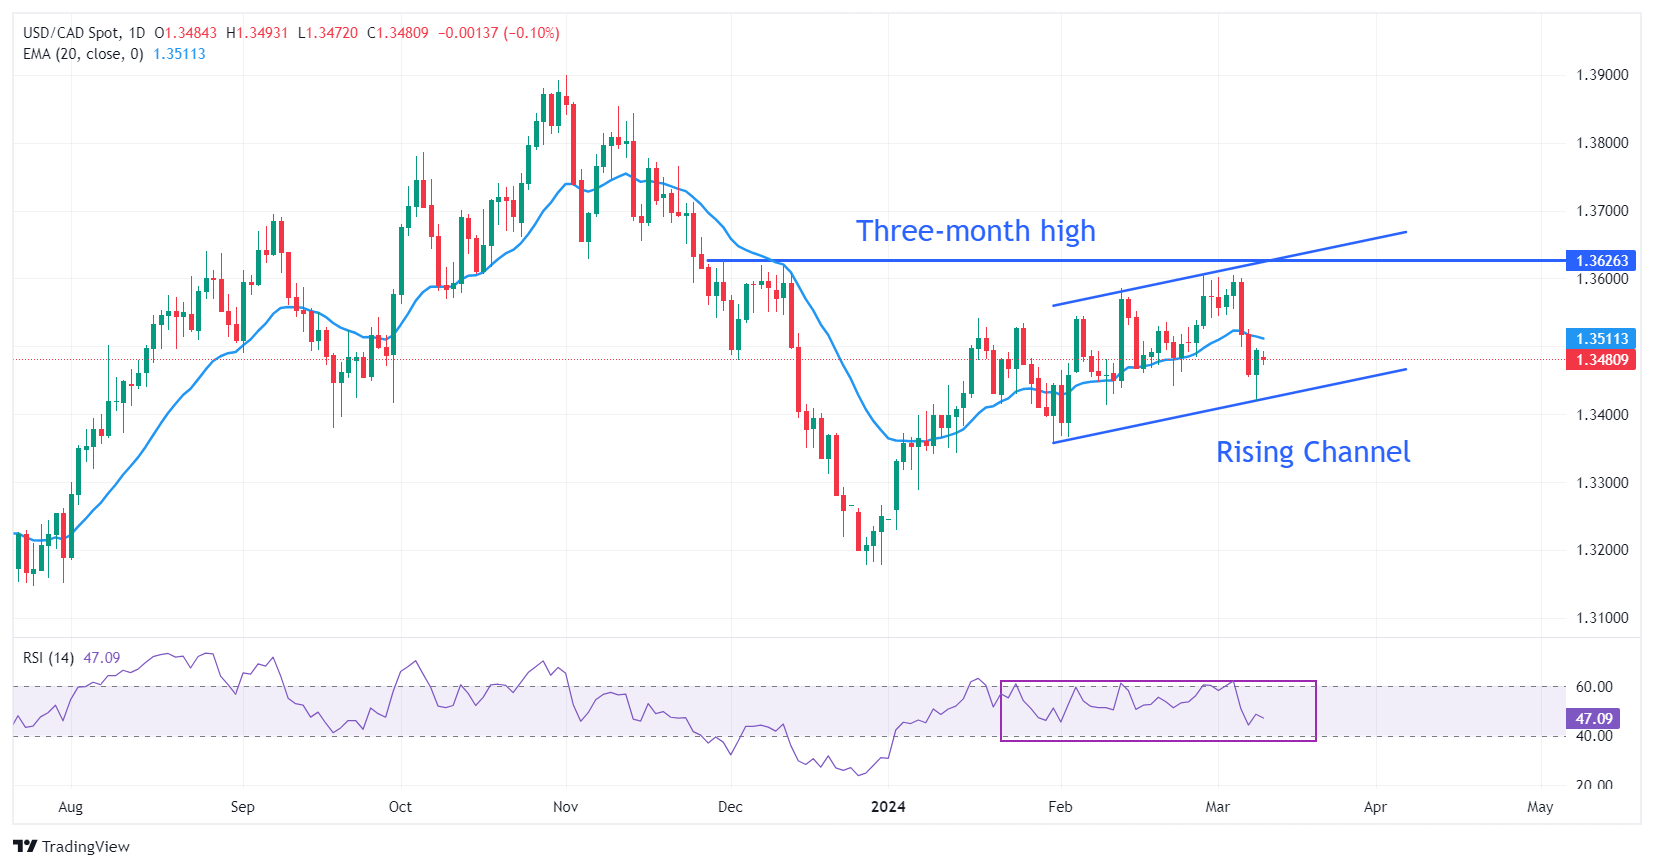
USD/CAD trades in a Rising Channel chart pattern on a daily timeframe. The chart formation exhibits an upside bias with moderate strength, and market participants consider each pullback a buying opportunity. Near-term demand remains downbeat as the Loonie asset is trading below the 20-day Exponential Moving Average (EMA), which trades around 1.3510.
The 14-period Relative Strength Index (RSI) oscillates inside the 40.00-60.00 range, indicating indecisiveness among market participants.
Fresh upside would appear if the asset breaks above January 17 high at 1.3542, which will drive the asset towards February 13 high at 1.3586, followed by the round-level resistance of 1.3600.
On the flip side, a downside move below February 22 low at 1.3441 would expose the asset to February 9 low at 1.3413. A breakdown below the latter would extend downside towards January 15 low at 1.3382.
USD/CAD daily chart
-
11.03.2024 04:46USD/CAD holds steady below 1.3500 amid weaker Oil prices, subdued USD demand
- USD/CAD struggles to attract any meaningful buyers amid a mixed fundamental cue.
- Sliding Crude Oil prices and Friday’s mixed Canadian jobs data undermine the Loonie.
- Bets for a June Fed rate cut keep the USD bulls on the defensive and act as a headwind.
The USD/CAD pair struggles to capitalize on Friday's goodish rebound from the 1.3420 region, or a nearly one-month low and oscillates in range on the first day of a new week. The pair trades around the 1.3480 area, nearly unchanged for the day during the Asian session, and is influenced by a combination of diverging forces.
Crude Oil prices drift lower for the second straight day and retreat further from over a four-month peak set earlier this March amid concern about slowing demand in China, exacerbated by underwhelming import data for the first two months of 2024. Furthermore, mixed Chinese inflation data add to market worries and overshadow a tighter supply outlook. This continues to weigh on the black liquid, which is seen undermining the commodity-linked Loonie and acting as a tailwind for the USD/CAD pair.
The Canadian Dollar (CAD) is further pressured by slowing domestic wage growth in February, to its lowest level since June, and an uptick in the unemployment rate. Meanwhile, the simultaneous release of the US jobs report pointed to a spike in the jobless rate to the highest level in two years reaffirmed bets that the Federal Reserve (Fed) will start cutting interest rates in June. This fails to assist the US Dollar (USD) to build on its recovery from a nearly one-month low and caps the upside for the USD/CAD pair.
The mixed fundamental backdrop warrants some caution for bullish traders and before positioning for any meaningful appreciating move for the currency pair. Market participants might also prefer to move to the sidelines ahead of the release of the latest US consumer inflation figures on Tuesday, which might influence the Fed's rate-cut path and drive the USD demand in the near term. This, along with Oil price dynamics, should help determine the next leg of a directional move for the USD/CAD pair.
-
08.03.2024 10:36USD/CAD Price Analysis: Breaking lower ahead of NFPs
- USD/CAD has broken below a major trendline and is unfolding lower.
- Key fundamental data lies ahead with US Nonfarm Payrolls and Canadian Payrolls both coming out at the same time.
- Unless the fundamental data is substantially bullish for the US Dollar, the downmove will probably extend.
The USD/CAD is down over a tenth of a percent on Friday as traders await the arrival of key employment metrics from both the US and Canada at 13:30 GMT.
Over the last two and a half days the pair has fallen from 1.3600 to the 1.3430s as traders digested Federal Reserve (Fed) Chairman Jerome Powell’s dovish comments to US lawmakers. Powell said “we’re not far” from inflation falling to a level where it would be right to start cutting rates. Lower rates are negative for a currency as they tend to reduce foreign capital inflows.
The mood music around the Bank of Canada (BoC) meanwhile has been much less dovish after the Boc delivered a hawkish hold at its last policy meeting on Wednesday.
The technical picture is showing some interesting developments as we head into what will probably be a volatile afternoon.
USD/CAD is overall looking bearish. It has broken through a key trendline for the 2024 rally and the break coincides with a sell signal from the Moving Average Convergence/ Divergence (MACD) indicator as it crosses below its signal line (circled). The Relative Strength Index (RSI) is also relatively low – a bearish sign.
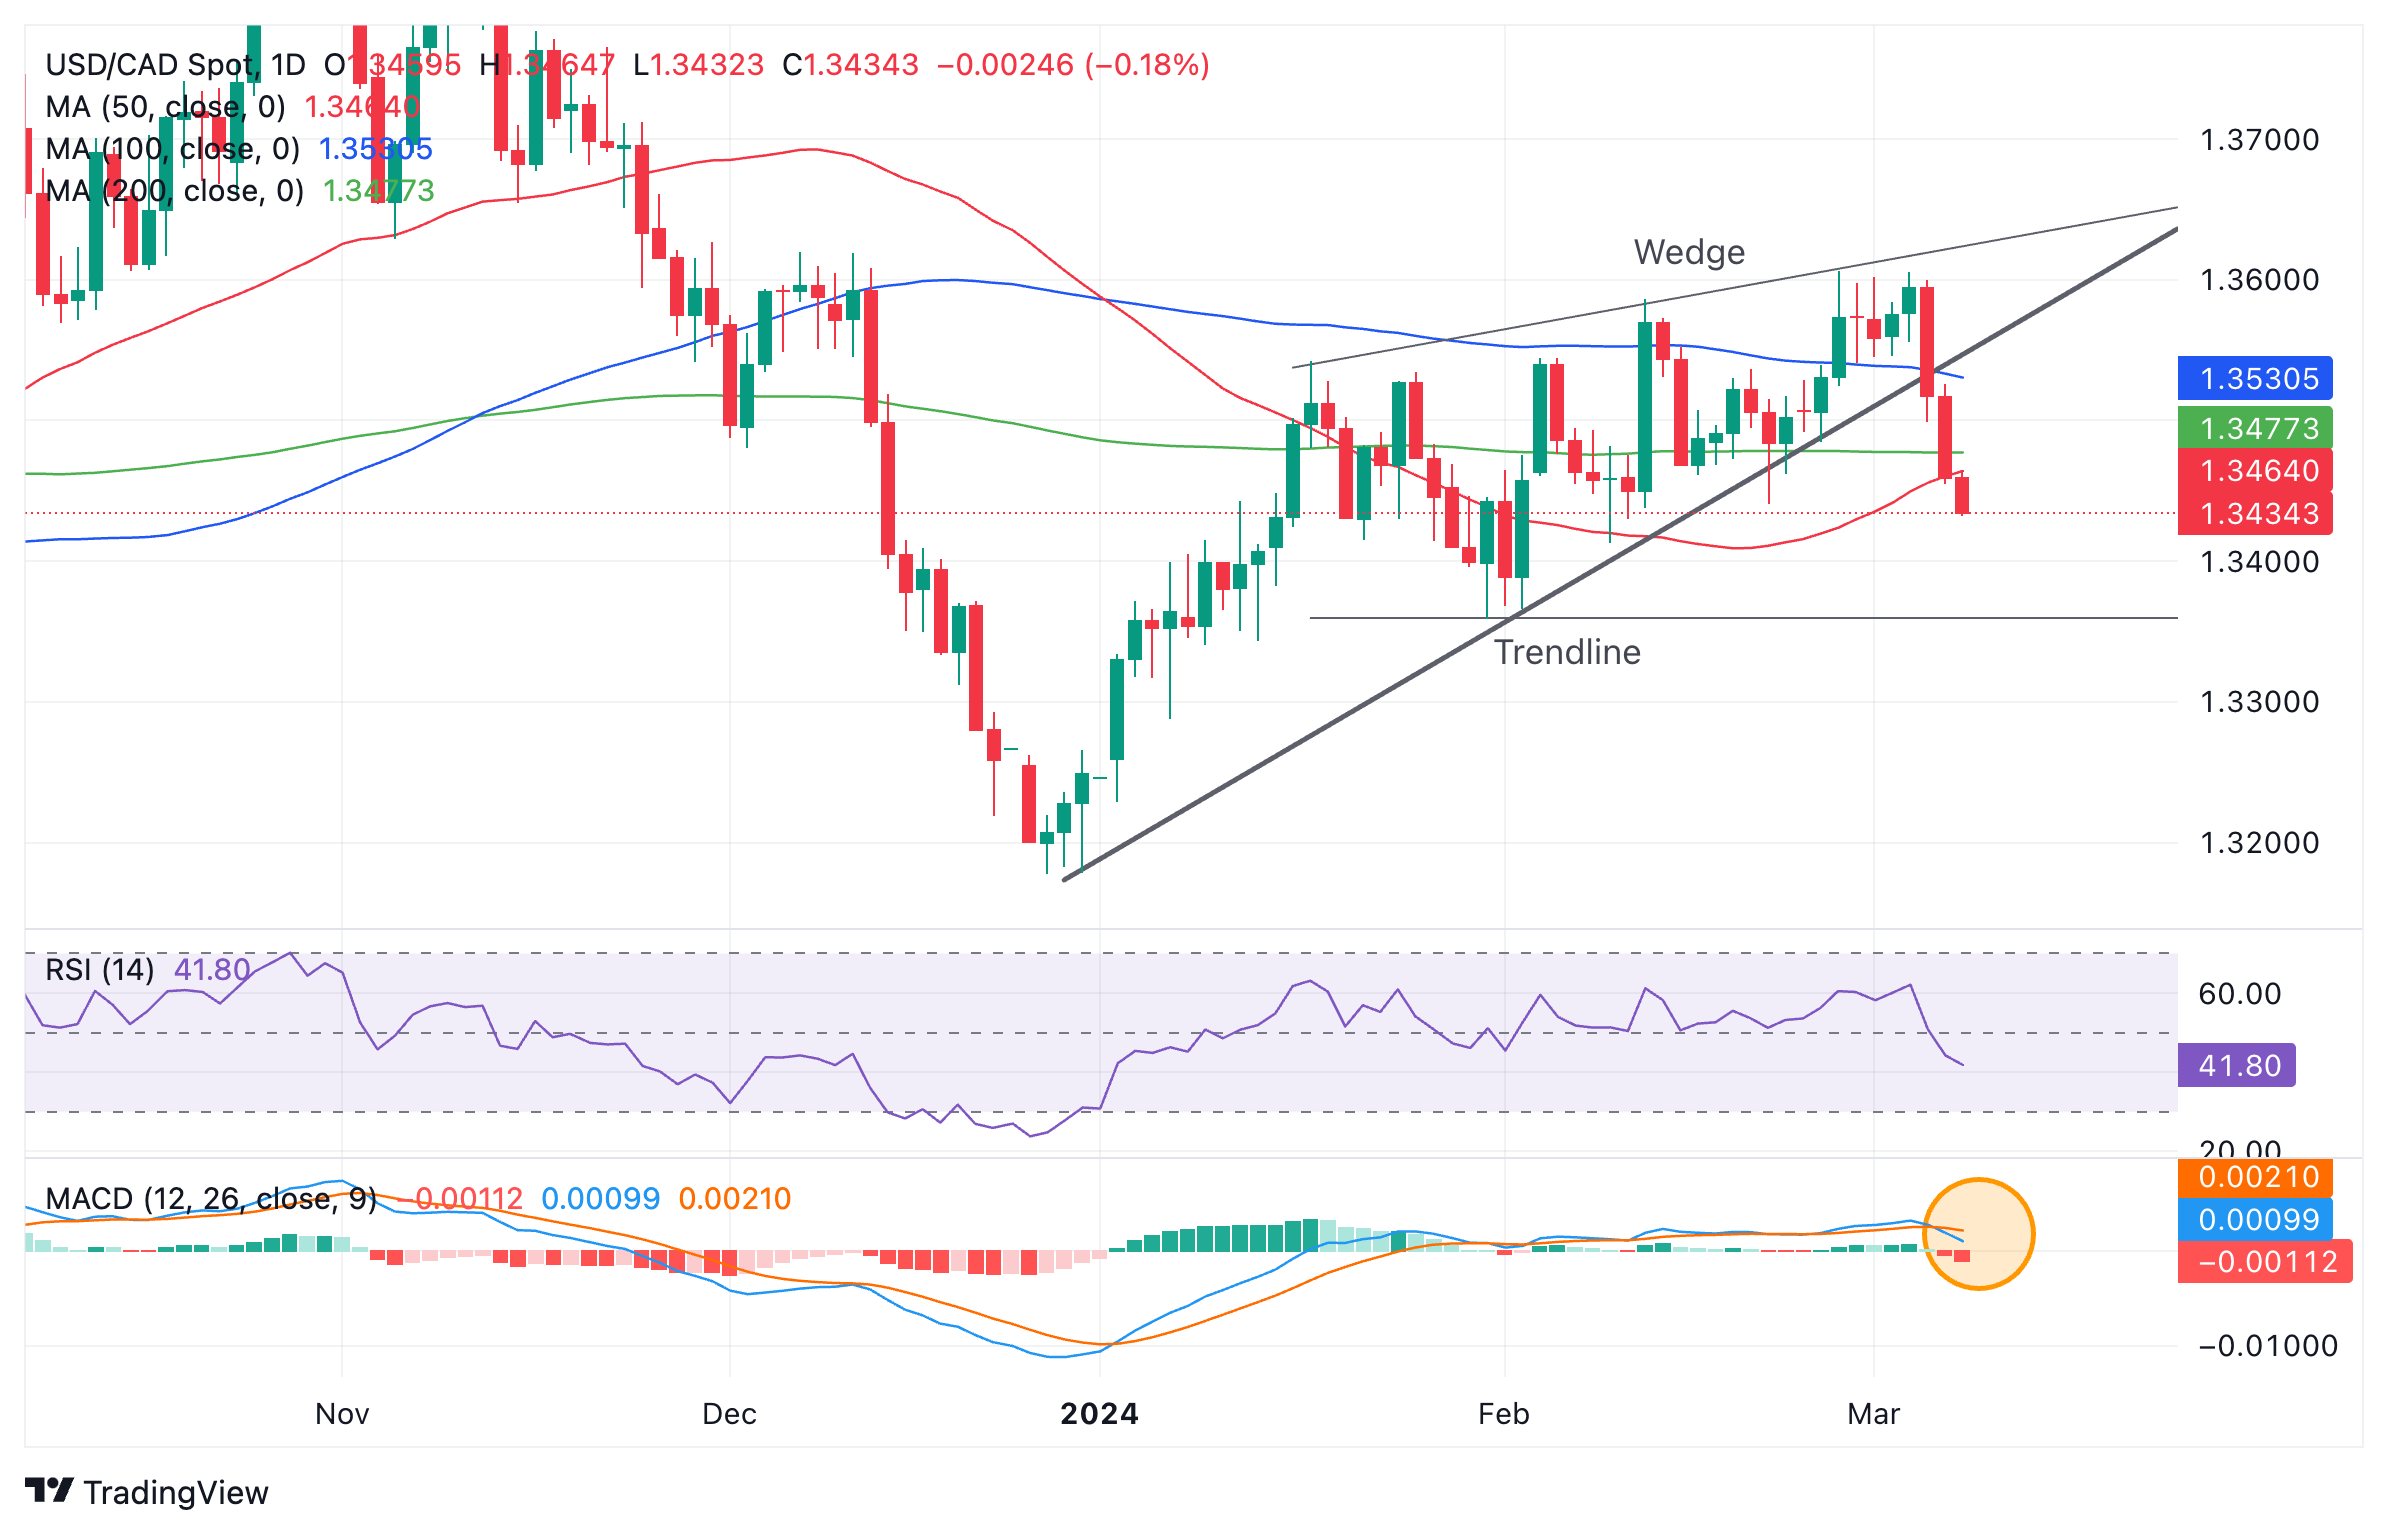
US Dollar vs Canadian Dollar: Daily chart
It is possible to see the 2024 price action as forming a Wedge pattern – another potentially bearish motif. Since the trendline has a dual role as the bottom of the Wedge, the trendline break also indicates a breakout from the price pattern.
The target for the breakdown is equal to the widest part of the Wedge pattern extrapolated lower from the breakout point lower. This gives a target at roughly 1.3350, which is also the level of the January lows.
A break below that would solidify the reversal and probably see a run down to around the vicinity of the 2023 December lows in the 1.3170s.
-
08.03.2024 09:49USD/CAD: Loonie to shrug off employment data barring a big surprise in either direction – ING
Canada releases jobs figures for February today. Economists at ING analyze Loonie’s outlook ahead of the employment report.
Loonie still looks at the US more than Canada
Expectations are for a respectable 20K employment print, with the unemployment rate expected to nudge higher from 5.7% to 5.8%.
The implications for the Canadian Dollar should not be material unless we see a big surprise in either direction. Both the Loonie and Bank of Canada rate expectations have followed very closely US data dynamics and we think that today’s US payrolls should have a bigger say in the short-term direction of USD/CAD.
A USD decline should see the Loonie lag other high-beta/commodity currencies, but can still put gradual pressure on USD/CAD, which we expect to break below 1.3000 by 2H24.
-
08.03.2024 04:11USD/CAD drops to near 1.3450, awaits labor data from US, Canada
- USD/CAD continues its losing streak on higher Crude oil prices.
- Canada’s Unemployment Rate is anticipated to reach 5.8% from 5.7 prior.
- US Nonfarm Payrolls could print a 200K figure for new jobs created in February, against 353K prior.
USD/CAD extends its losses for the third consecutive session on Friday, trading lower to near 1.3450 during the Asian hours. Market participants look forward to the labor data from Statistics Canada on Friday. February’s Unemployment Rate is expected to increase by 5.8% against 5.7 prior. Net Change in Employment is anticipated to print 20K against the previous figure of 37.3K.
The higher Crude oil prices contribute to underpinning the Canadian Dollar (CAD) and, consequently, act as a headwind for the USD/CAD pair. West Texas Intermediate (WTI) inches higher to near $78.90, at the time of writing.
Economists at ING have highlighted the persistent correlation between the Canadian dollar (CAD) and US data, as well as the strong connection between policy expectations of the Federal Reserve (Fed) and the Bank of Canada (BoC). Consequently, they suggest that significant movements in either direction for the USD/CAD pair appear unlikely at this time.
US Dollar Index (DXY) attempts to snap its losing streak ahead of the employment figures from the United States (US), hovering around 102 80, by the press time. US Initial Jobless Claims printed 217K reading for the previous week, surpassing the expectations of 215K. Meanwhile, US Nonfarm Productivity remained consistent, maintaining growth at 3.2% in the fourth quarter of 2023, against the market expectations of 3.1%. Friday is set to release employment numbers from the United States (US), which includes Average Hourly Earnings and Nonfarm Payrolls.
Federal Reserve (Fed) is expected to initiate an interest rate cut cycle starting from June. Fed Chair Jerome Powell reiterated the central bank's stance during his second day of testimony before the US Congress, further fueling speculation regarding potential rate cuts. Powell suggested that cuts in borrowing costs could occur sometime this year, with the condition that the inflation trajectory aligns with the Fed's 2% target.
-
07.03.2024 14:34USD/CAD to stay rangebound in the short term before a USD decline emerges – ING
USD/CAD has declined below the 1.3500 level. Economists at ING anlayze the pair’s outlook.
USD/CAD to head towards the 1.3000 mark in the second half of 2024
The persistence of CAD’s correlation to US data and the strict link between Fed and BoC policy expectations means the room for a major break in either direction in USD/CAD does not seem very likely.
We expect it to keep trading in a 1.3400/1.3600 range in the coming weeks before a clearer USD downtrend starts to emerge from the second quarter onwards and takes the pair towards the 1.3000 mark in the second half of 2024.
-
07.03.2024 11:03USD/CAD Price Analysis: Threatening to break below key trendline
- Negative comments from Chairman Powell have weakened the US Dollar.
- USD/CAD is selling-off to a key trendline and is threatening to break below it.
- The MACD indicator, useful in a range bound market, is issuing a sell signal.
The USD/CAD is down a tenth of a percent on Thursday in line with widespread US Dollar (USD) weakness, as traders digest Federal Reserve (Fed) Chairman Jerome Powell’s comments to US lawmakers on the Wednesday, during the first day of his testimony to Congress.
The Greenback sold-off steeply on Wednesday after Powell affirmed that the Fed was planning to cut interest rates subject to inflation falling closer to target. USD/CAD was particularly hit as the Fed’s stance contrasts with the hawkish hold adopted by the Bank of Canada (BoC) at its last meeting.
The technical picture on the daily chart of USD/CAD is showing some interesting developments in line with the fundamentals.
-638454057891134630.png)
US Dollar vs Canadian Dollar: Daily chart
The chart above shows how the pair has been in a long sideways market since the end of 2022.
The Moving Average Convergence/ Divergence (MACD) momentum indicator is especially useful to analyze range bound asset prices, as it tends to accurately mirror and predict the key turning points of prices oscillating in a range. This can be seen to be the case in the chart above.
More recently USD/CAD has been rising up in the range since the turn at the end of 2023. Although it has not yet reached the range highs, the MACD has just crossed below the signal line, giving a sell signal and suggesting the trend may be about to change. The steep sell-off on Wednesday adds credence to the idea the market may be reversing.
-638454058914743388.png)
US Dollar vs Canadian Dollar: Daily chart
Price has fallen to the level of a key trendline for the 2024 rally. This is likely to be an important make-or-break support zone for the pair. The strength of the preceding day’s sell-off adds evidence to the possibility price could penetrate the trendline and begin moving south.
A decisive break below the trendline – characterized by a long red candle that closes well below the trendline and near its low of the day, for example – would be the confirmation signal of a reversal of the 2024 uptrend and a probable new phase of weakness, targeting the range lows in lower 1.30s. If the pair prints three down days in a row and also breaks below the trendline that would be another confirmation of a “decisive break”.
-638454059351928750.png)
US Dollar vs Canadian Dollar: Daily chart
The possible evolution of a bearish Wedge price pattern in the move higher, as shown on the chart above, is another potentially negative motif. Such a pattern recommends a breakdown to a target equal to its widest point, extrapolated from the breakout point lower. This gives a target of roughly 1.3350.
In the event that the trendline manages to hold, however, the pair may continue its slow upside grind, targeting the top of the wedge at roughly 1.3640 initially, and on a breakout higher, the top of the long-term range at 1.3900.


© 2000-2024. All rights reserved.
This site is managed by Teletrade D.J. LLC 2351 LLC 2022 (Euro House, Richmond Hill Road, Kingstown, VC0100, St. Vincent and the Grenadines).
The information on this website is for informational purposes only and does not constitute any investment advice.
The company does not serve or provide services to customers who are residents of the US, Canada, Iran, The Democratic People's Republic of Korea, Yemen and FATF blacklisted countries.
Making transactions on financial markets with marginal financial instruments opens up wide possibilities and allows investors who are willing to take risks to earn high profits, carrying a potentially high risk of losses at the same time. Therefore you should responsibly approach the issue of choosing the appropriate investment strategy, taking the available resources into account, before starting trading.
Use of the information: full or partial use of materials from this website must always be referenced to TeleTrade as the source of information. Use of the materials on the Internet must be accompanied by a hyperlink to teletrade.org. Automatic import of materials and information from this website is prohibited.
Please contact our PR department if you have any questions or need assistance at pr@teletrade.global.
transfers