- Analytics
- News and Tools
- Quotes
- Chart and quotes for NZDUSD
CFD Trading Rate New Zealand Dollar vs US Dollar (NZDUSD)
| Date | Rate | Change |
|---|
Related news
-
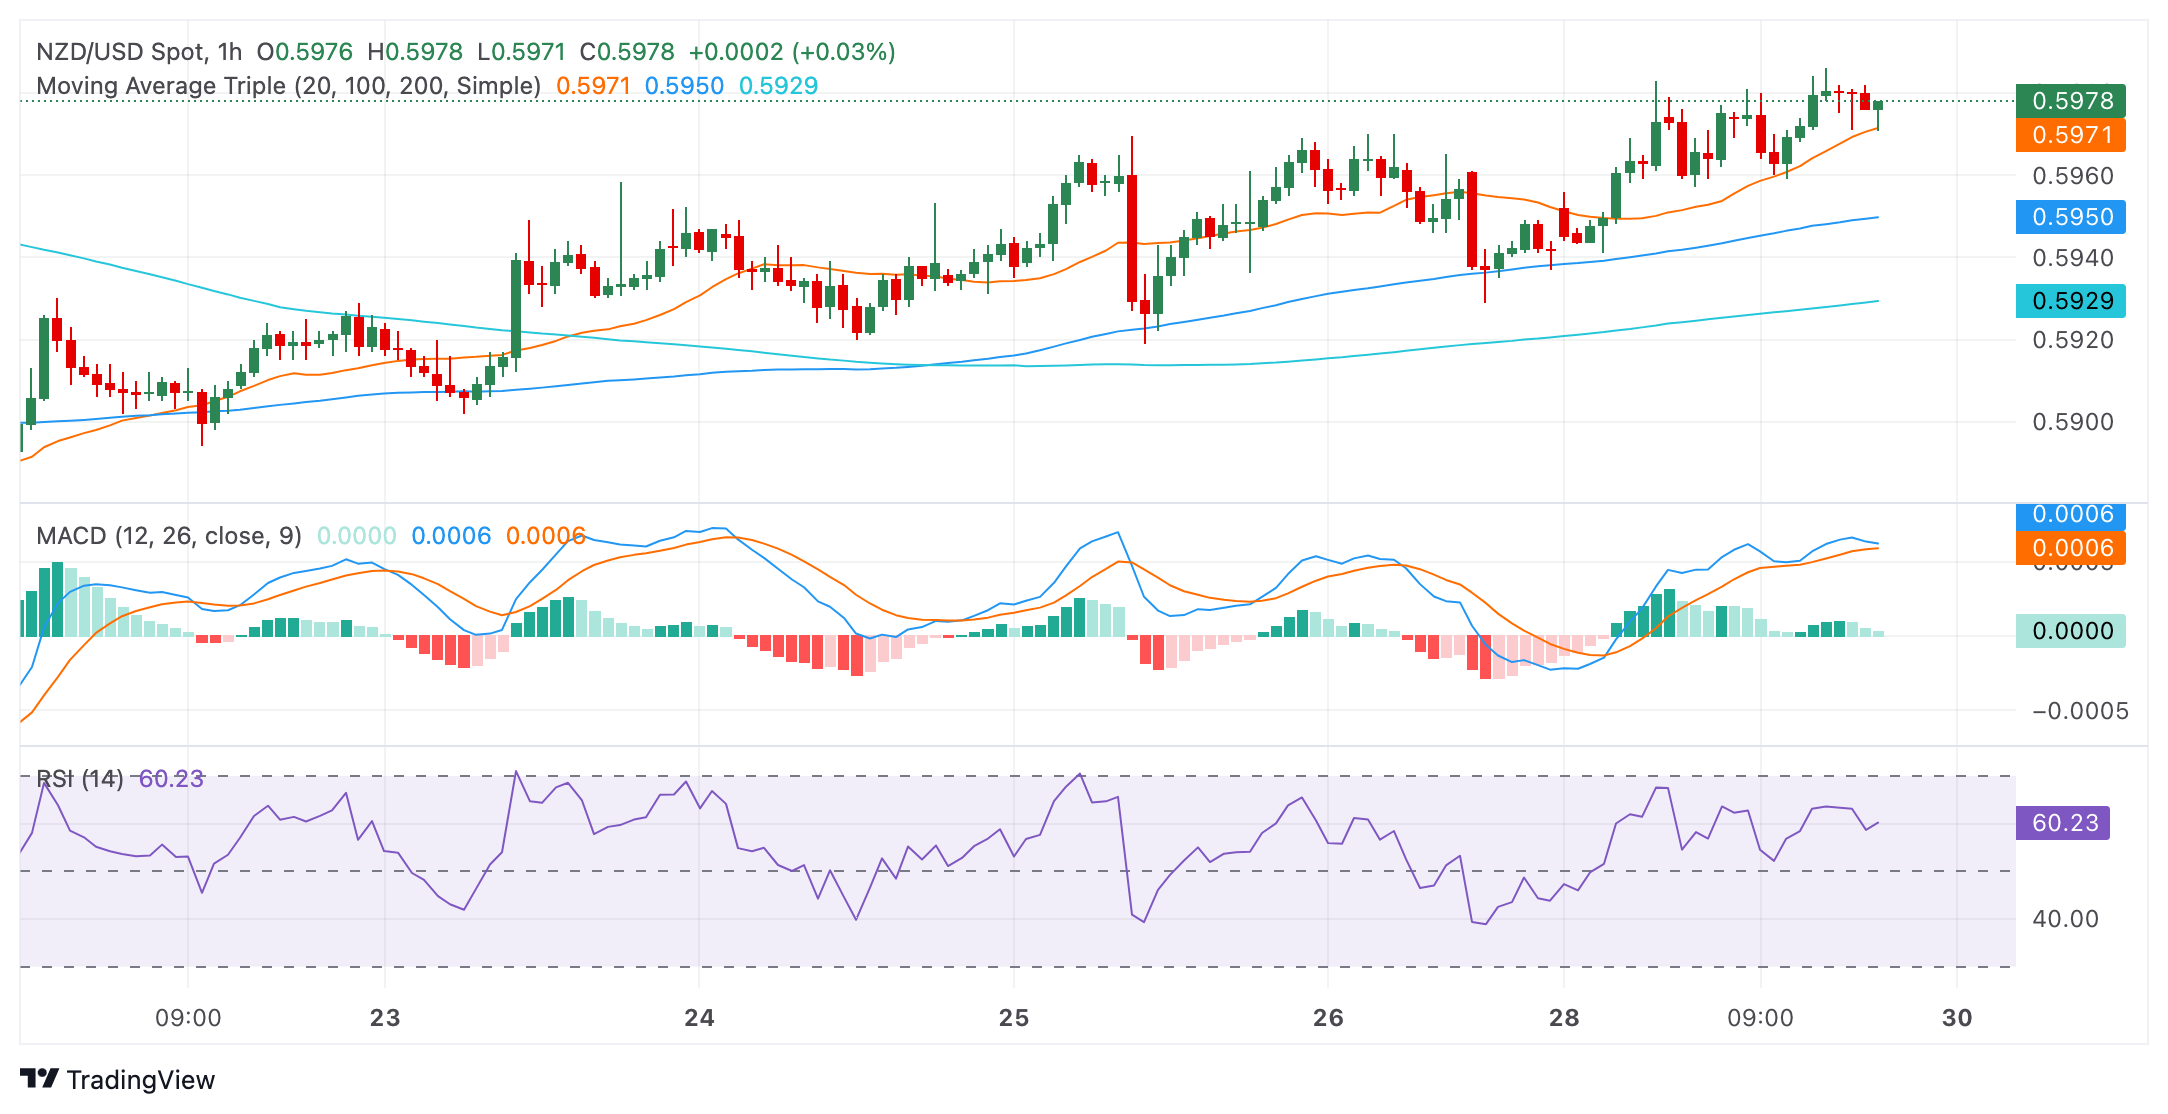
06.05.2024 13:36NZD/USD Price Analysis: The Kiwi reaches a pivotal point
- NZD/USD has reached a key resistance level which it needs to break above to extend.
- Failure to break above the level would probably lead to continuation of the descending channel.
- The MACD has formed a bullish price pattern which adds weight to the upside view.
NZD/USD is trading in the 0.6020s after having risen for the fourth day in a row, on Monday. The pair is encountering significant resistance from the 50-day Simple Moving Average (SMA) and a major trendline. NZD/USD has reached a crossroads where it could either continue higher or revert to the bearish sentiment that has characterized the year so far.
To extend the bullish short-term gains NZD/USD has clocked up since the pivotal April 19 low, the pair will need to make a decisive break above the confluence of resistance it is bumping up against – if not, this could be an inflection point where the price turns and starts going lower again, in line with the medium-term bearish trend.
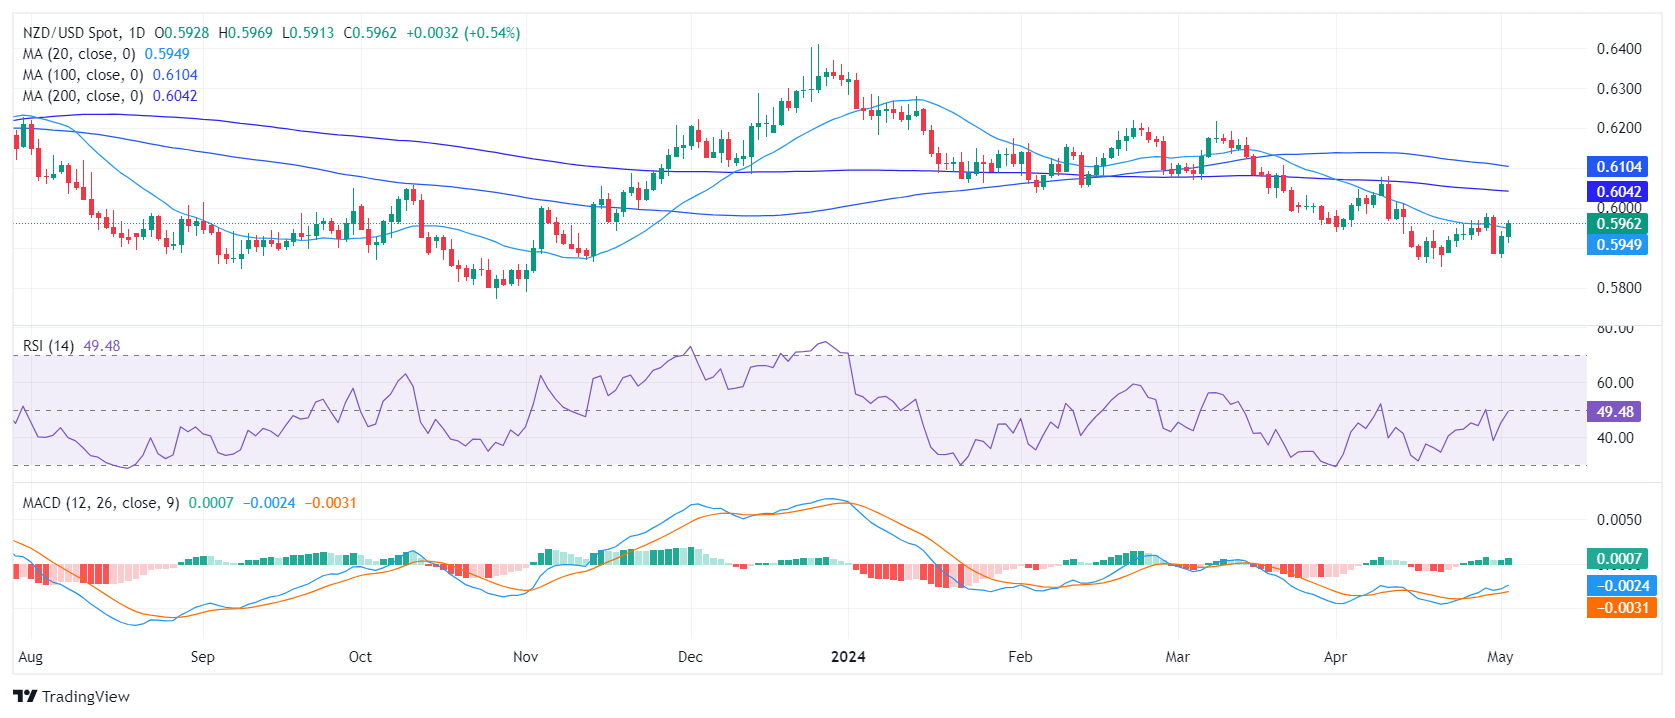
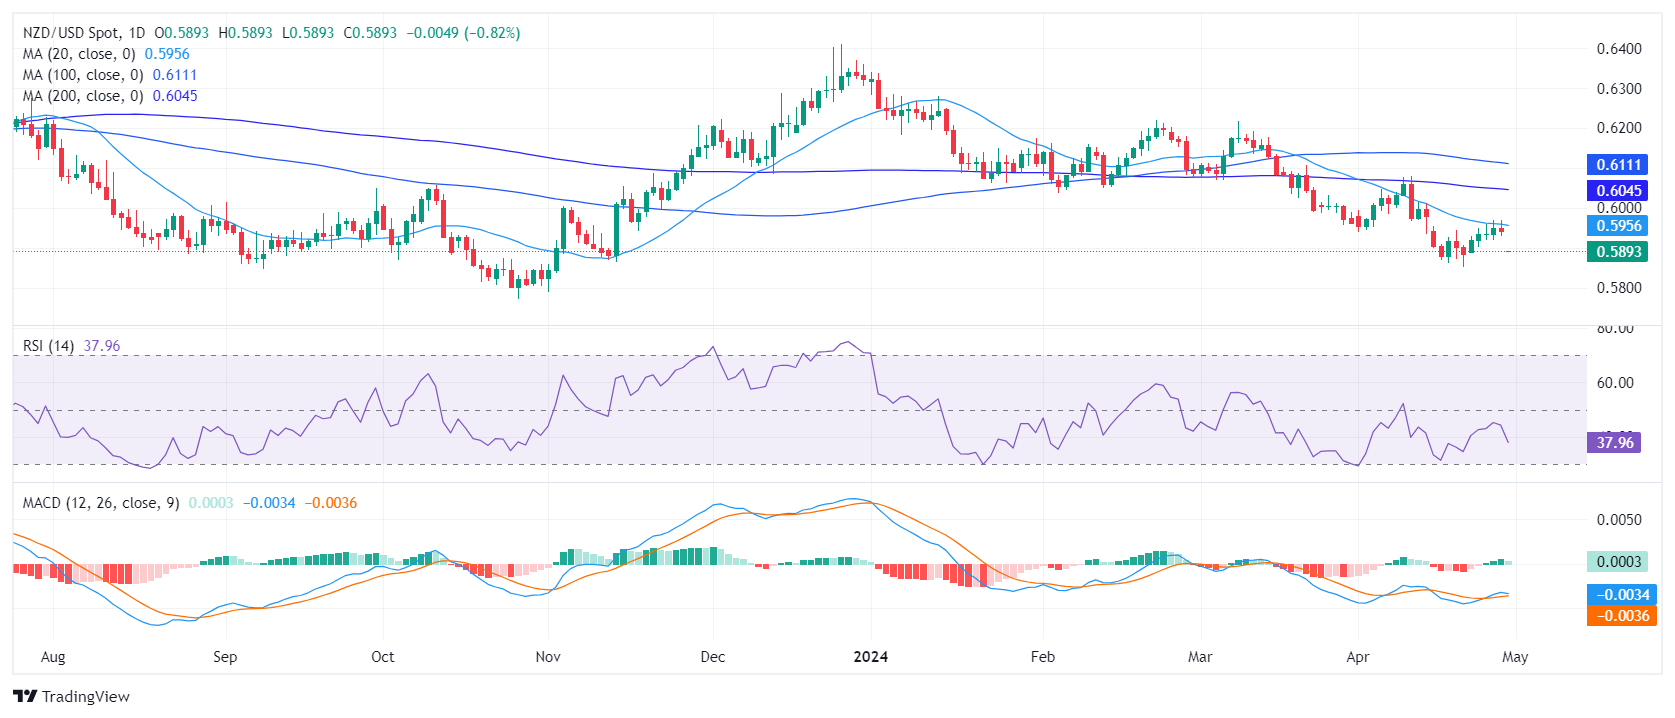
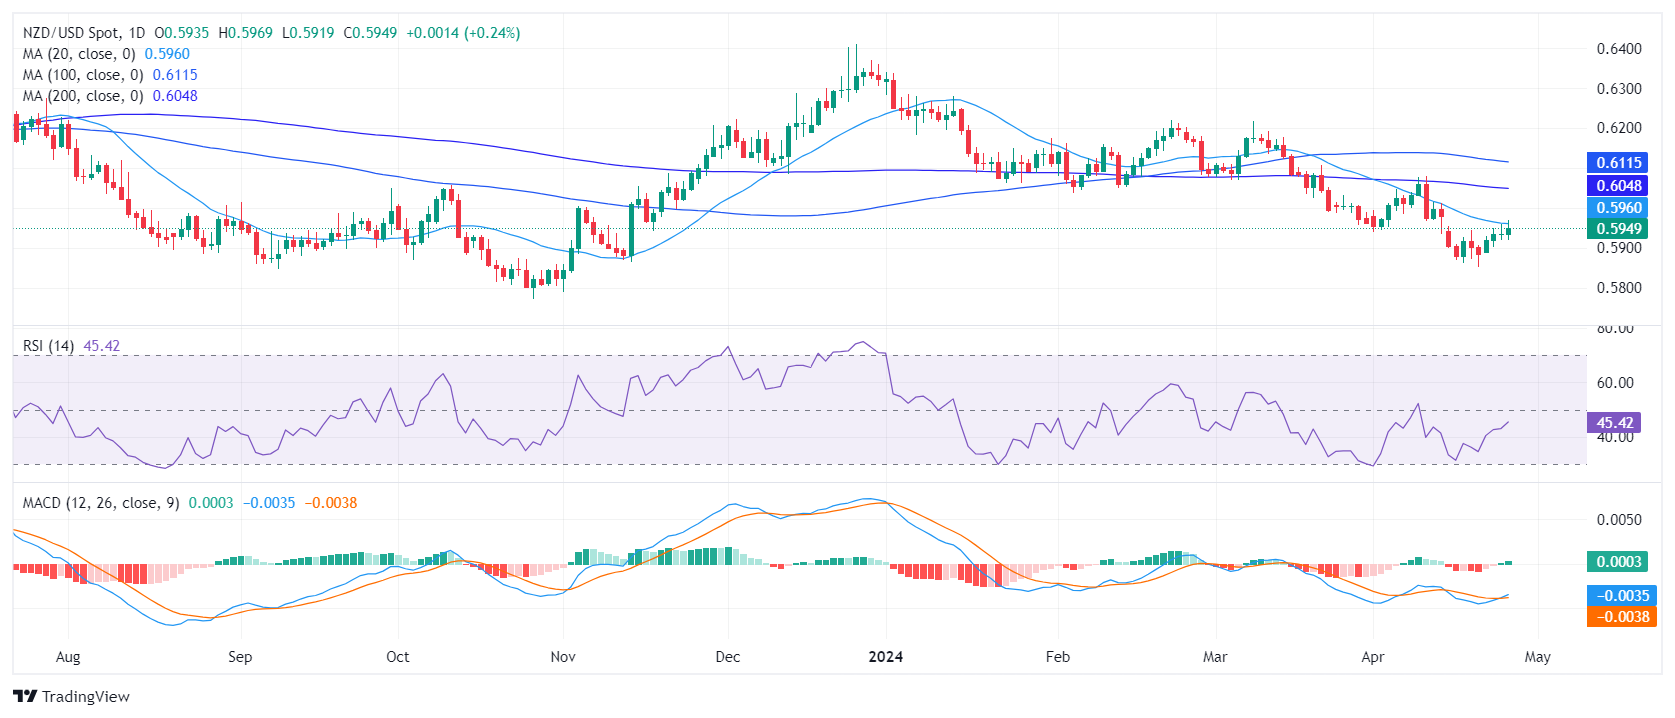
NZD/USD Daily Chart
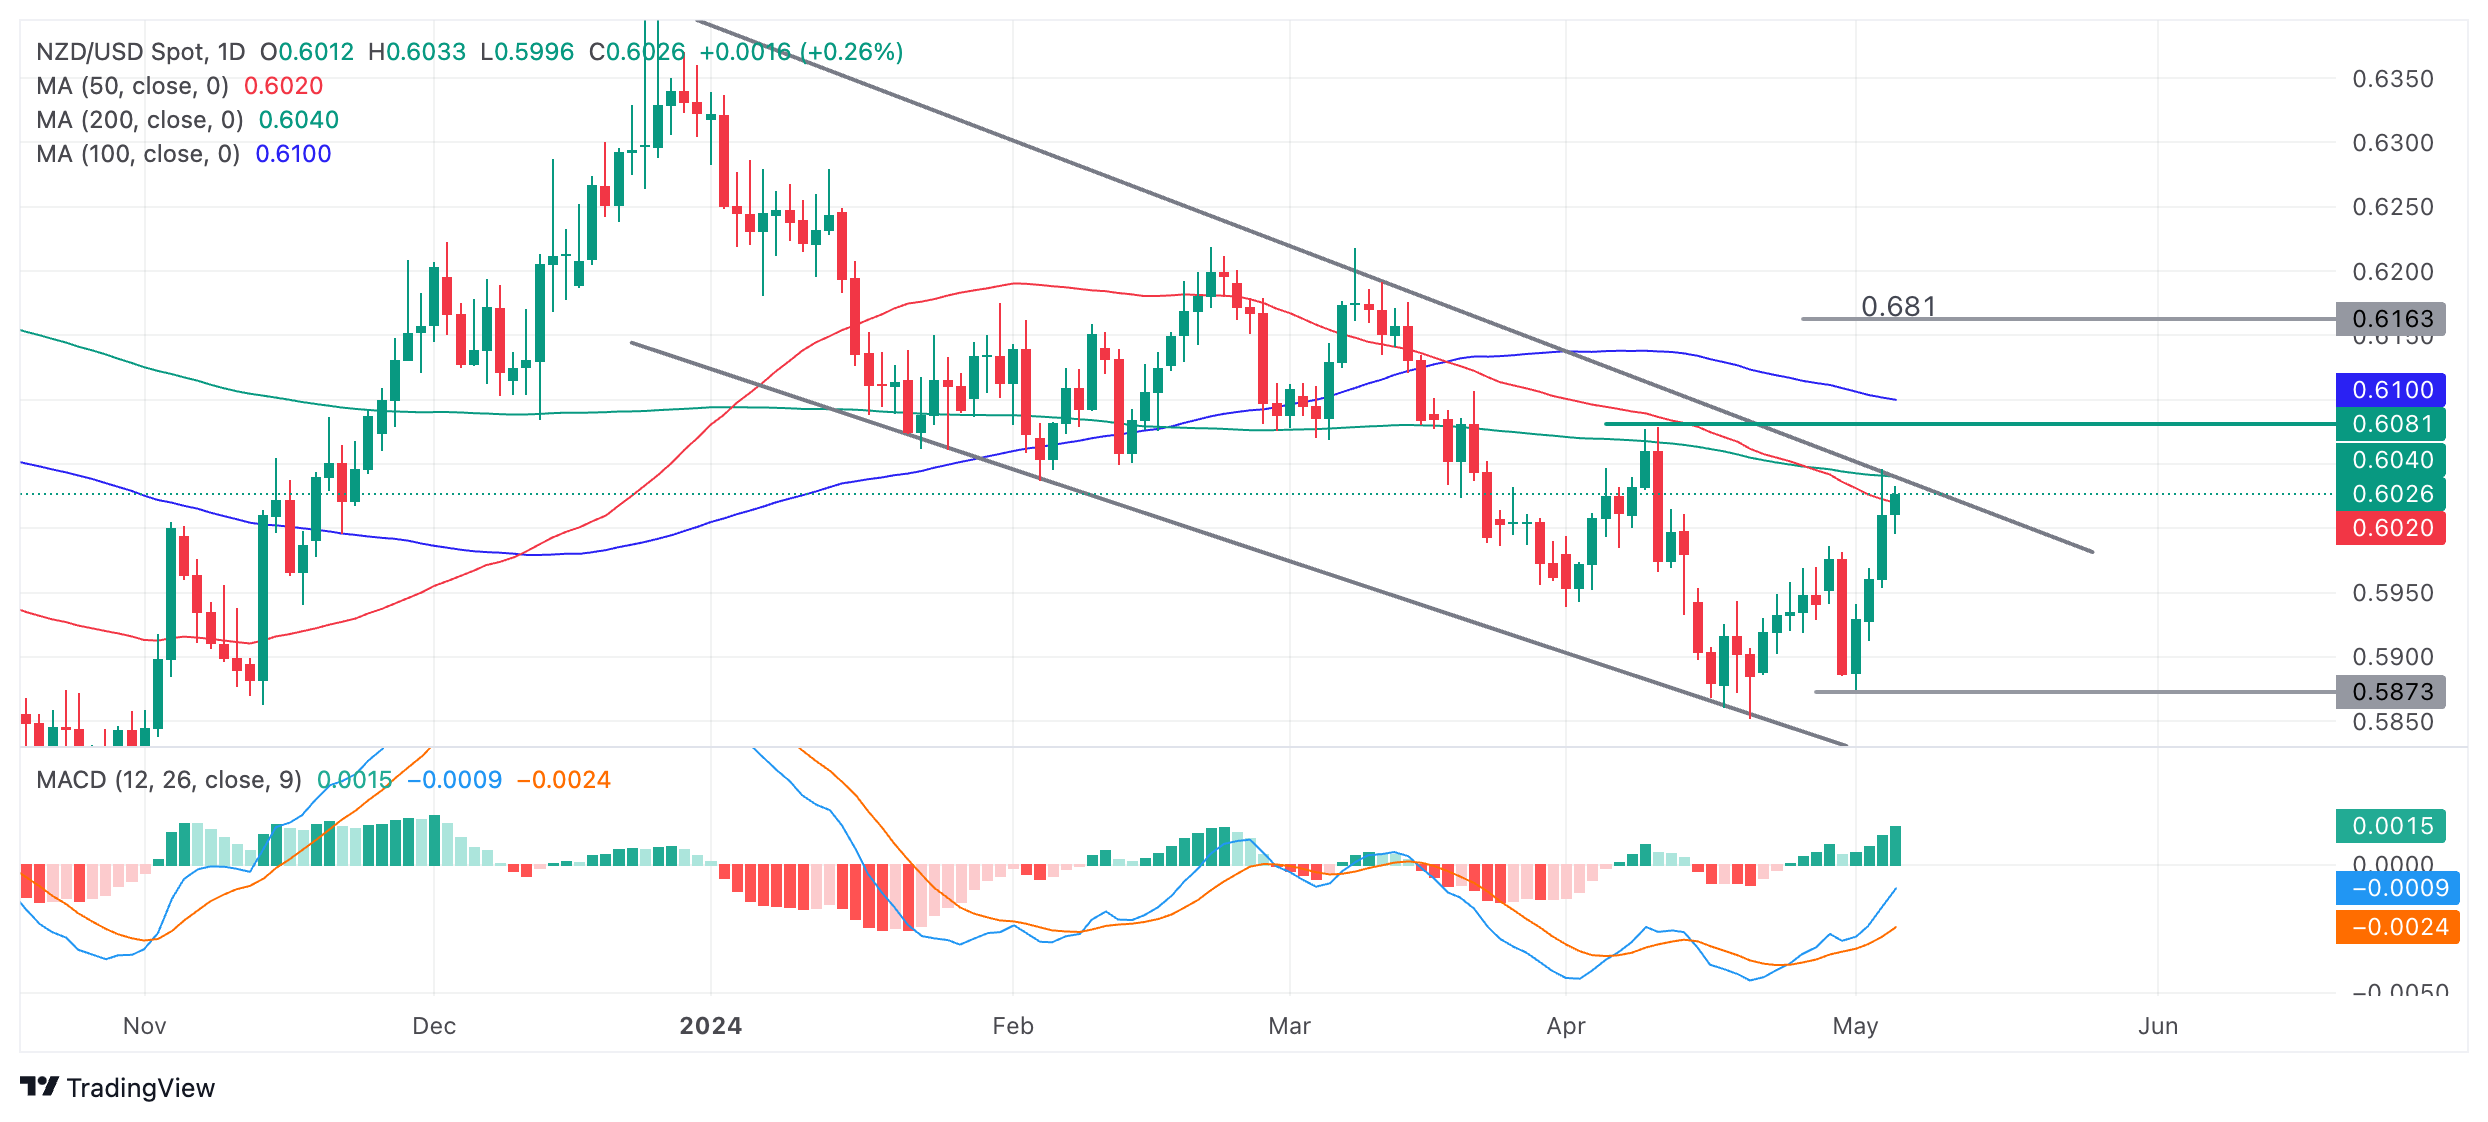
NZD/USD is testing resistance from the 50-day, 200-day SMA and the trendline for the down move since the start of 2024. Unless it breaks out it will probably continue back down to the 0.5870 lows, possibly even lower.
However, there are no signs yet on the chart that indicates the start of a new down-leg.
Given the strength of the move up since the April 19 lows and the strong accompanying bullish momentum reflected in the Moving Average Convergence Divergence (MACD) there is a chance a breakout from the channel could follow on. Further, the MACD has formed a bullish double bottom pattern during April which is a sign of a change in trend in the underlying price as well as the MACD.
A decisive break above the trendline would be required to indicate NZD/USD was going higher. Such a breakout would be signaled by a long bullish green daily candle breaking clearly above the trendline and closing near the high of the day. Alternatively three green candles in a row that broke clearly above could also indicate a decisive breakout. Price trading above the top of the last swing high at 0.6081 would also be a bullish sign.
Such a break, if it were to develop, would signal significant upside. The usual way to estimate how far a move will go following a trendline break is to take the move that directly preceded it and extrapolate that higher. For a conservative estimate the 0.681 Fibonacci ratio can be used. This gives a conservative target of 0.6163 and a full estimate of 0.6213.
-
06.05.2024 04:23NZD/USD edges lower to near 0.6000 amid stable US Dollar
- NZD/USD snaps its winning streak due to a rebound in the US Dollar.
- The US Dollar struggled due to softer-than-expected US jobs data revived hopes for the Fed’s interest rate cuts later this year.
- RBNZ signaled to delay any shift toward monetary easing until 2025 due to higher inflation in Q1.
The NZD/USD pair experienced a slight decline after three consecutive days of gains, trading around 0.6000 during the Asian session on Monday. This decline in the pair could be attributed to the rebound in the US Dollar (USD).
The US Dollar Index (DXY), which gauges the performance of the US Dollar (USD) against six major currencies, hovers around 105.20, by the press time. The lower US Treasury yields could limit the advance of the Greenback.
However, the US Dollar struggled due to softer-than-expected US jobs data released on Friday. This development revived hopes for potential interest rate cuts by the US Federal Reserve (Fed) later this year. The prevalent risk appetite may continue this week following Fed Chair Jerome Powell's relatively dovish stance on the monetary policy outlook during Wednesday's session.
On the Kiwi’s side, China's Caixin Services Purchasing Managers' Index (PMI), slightly decreased to 52.5 in April, from 52.7 in March, aligning with expectations. However, it has marked the 16th consecutive month of growth in services activity. This has the potential to boost New Zealand's market, considering its status as one of the largest exporters to China.
Last week, the Reserve Bank of New Zealand (RBNZ) signaled its intention to delay any shift toward monetary easing until 2025, citing higher-than-expected inflation pressures in the first quarter. This stance may continue to provide support for the New Zealand Dollar (NZD), underpinning the NZD/USD pair.
-
03.05.2024 22:11NZD/USD Price Analysis: Bullish momentum picks up, buyers rejected at the 100-day SMA
- The daily indicators hint at a strengthening bullish momentum.
- Hourly indicators are consolidating after hitting overbought conditions earlier in the session.
- If the buyers regain the 100-day SMA, the bearish trend will be threatened.
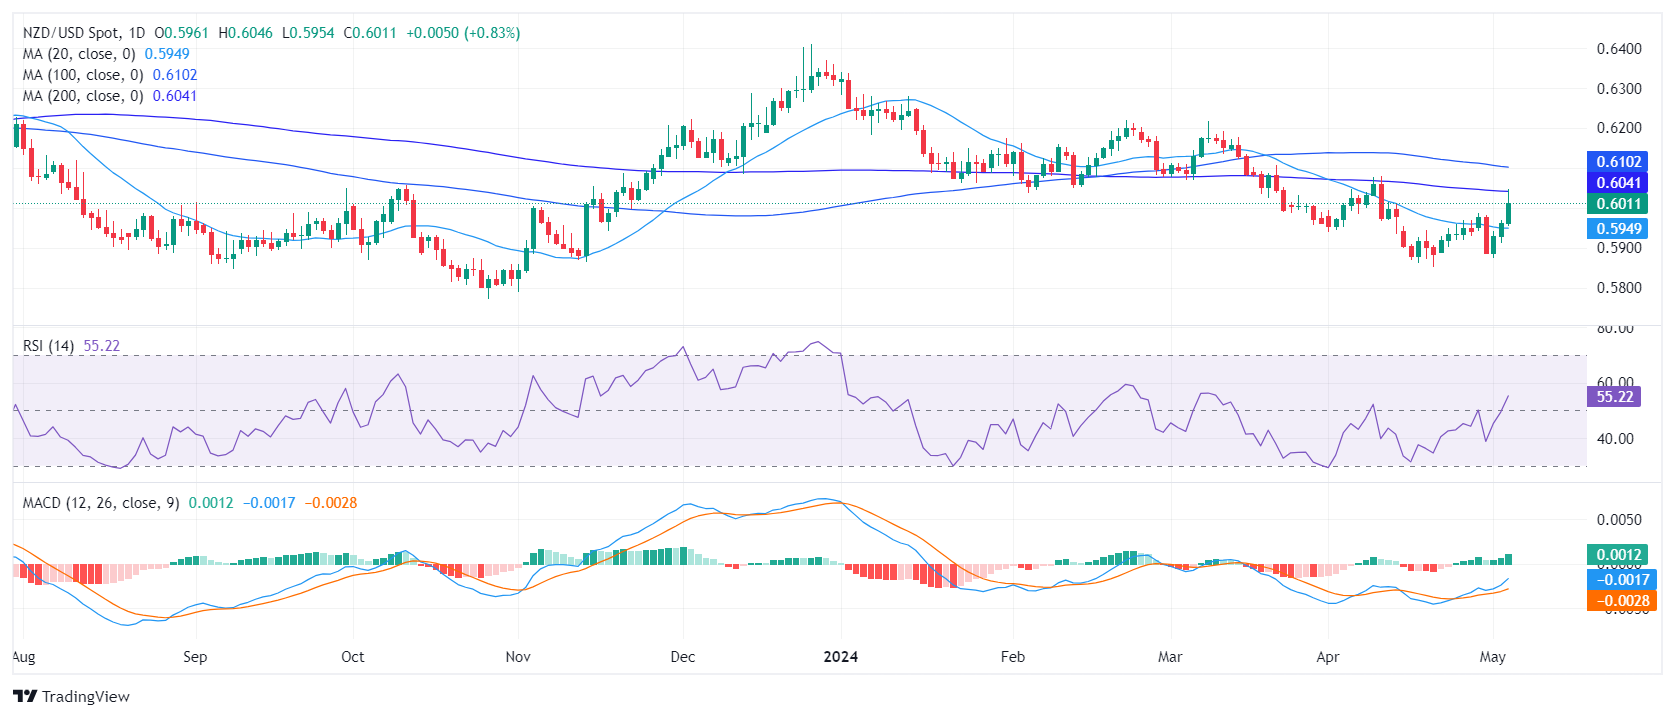
At the end of the week, the NZD/USD rallied to around 0.6050, up by 0.80%. Bullish momentum is picking up but the overall trend is still tilted in favor of the sellers. Further bullish validation is needed after the pair's unsuccessful attempt to cross a crucial 100-day Simple Moving Average (SMA) during Friday's session.
On the daily chart, the Relative Strength Index (RSI) shows a shift towards a stronger bullish trend. The last session recorded an RSI of 56, settling in positive territory. This solidifies a consistent increase in momentum in favor of buyers after being below 50 since early April.
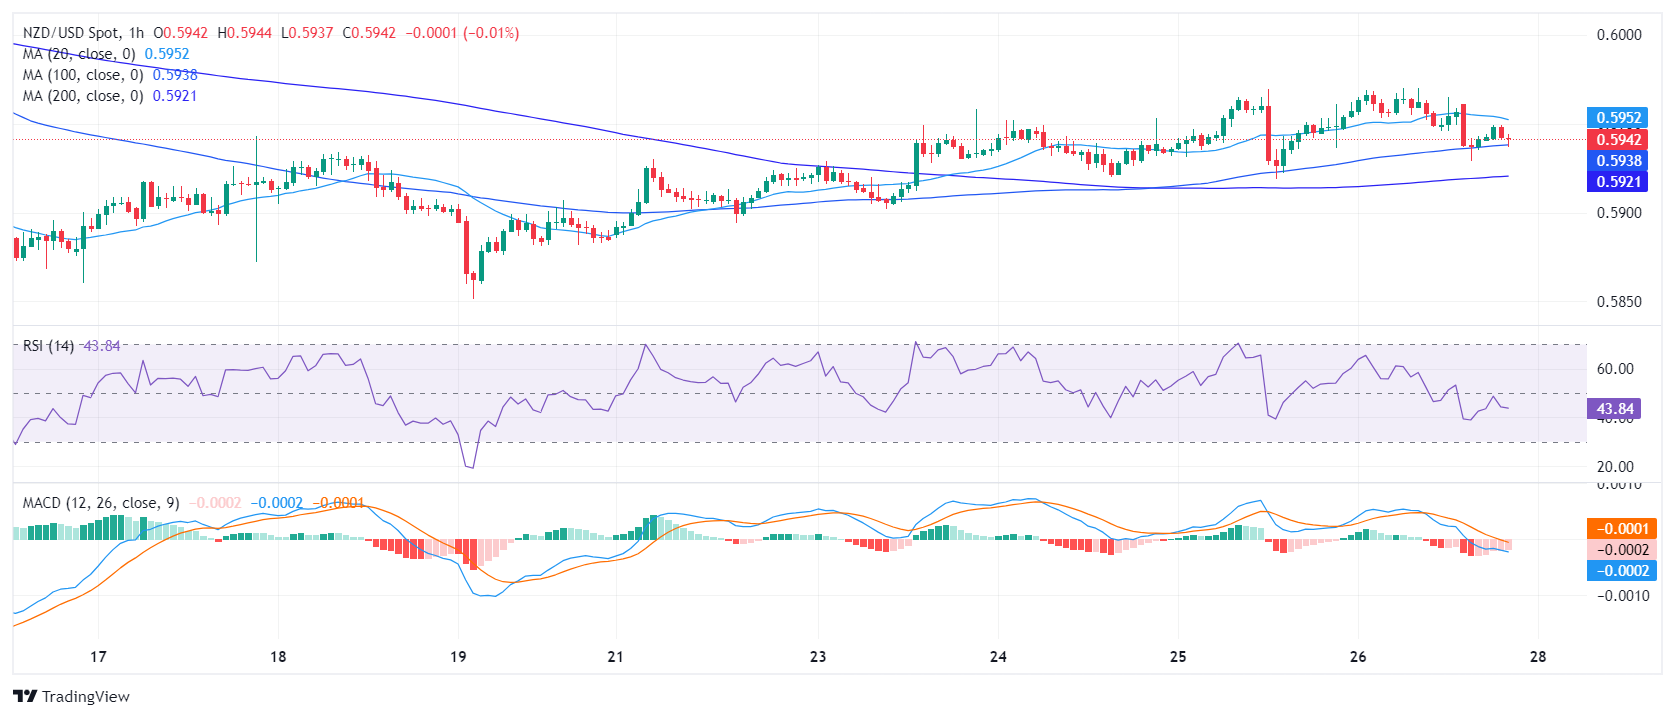
NZD/USD daily chart
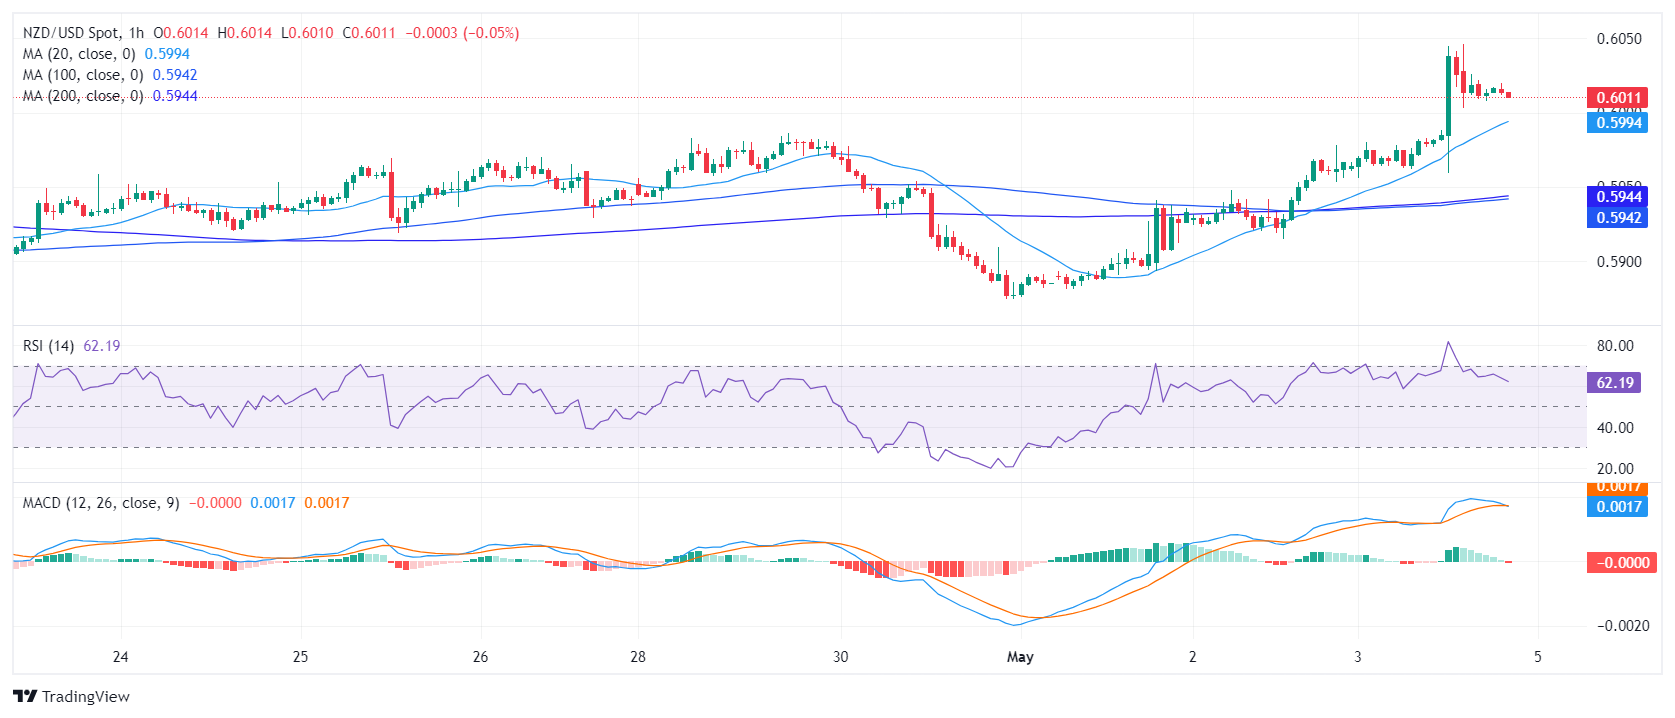
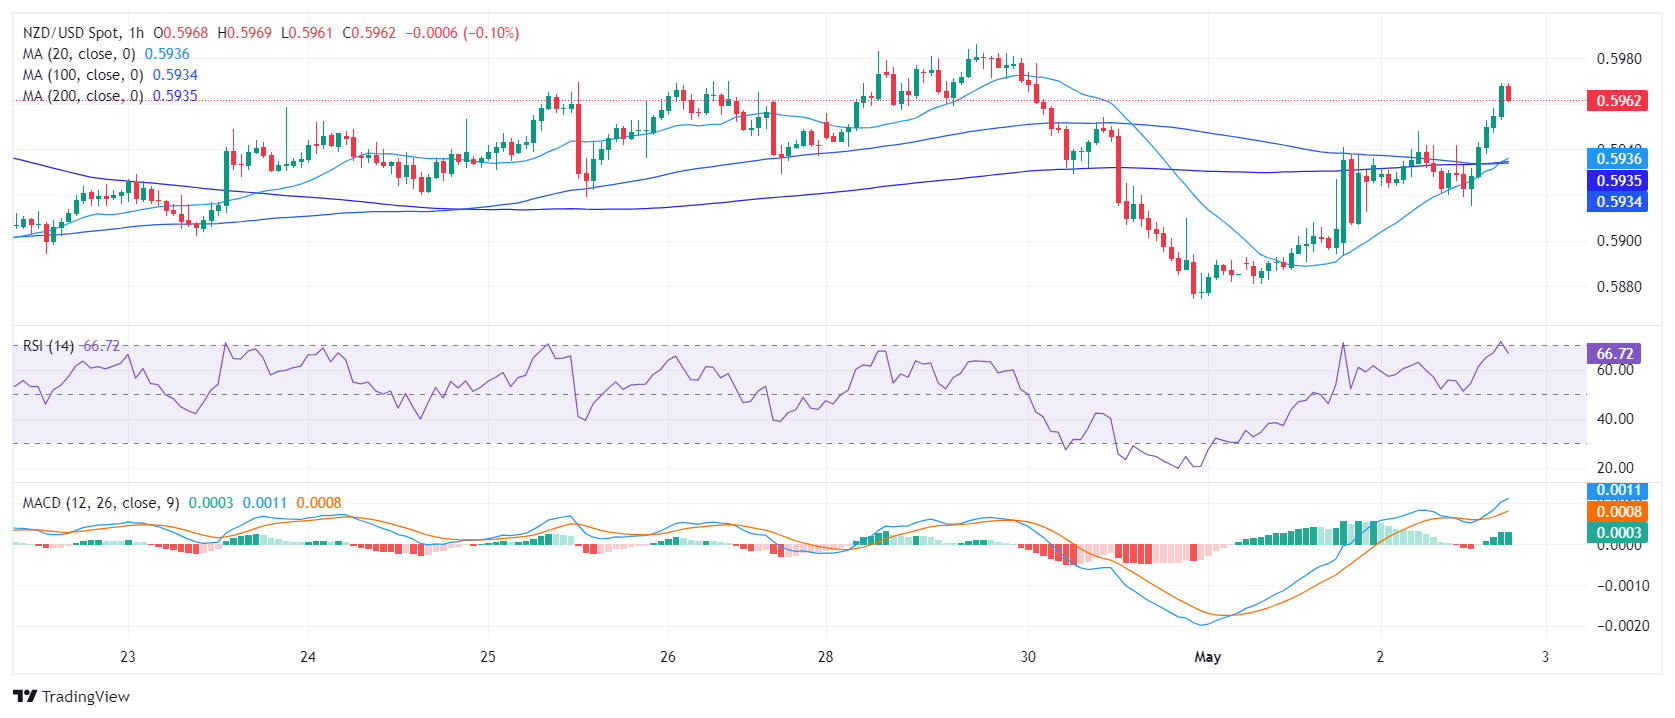
Examining the hourly chart, a similar viewpoint is observed. The RSI measures 62, but somewhat flattened after jumping above 70 earlier in the session. In addition, the Moving Average Convergence Divergence (MACD) histogram exhibited consistent red bars, signaling a potential deceleration in the bullish momentum.
NZD/USD hourly chart
Regarding the overall market trend, the NZD/USD is trading below the 100, and 200-day SMA which confirms the presence of significant downside pressure on the pair and challenges short-term buyers. Notably, the pair encountered rejection around the 100-day SMA at the 0.6100 level during Friday’s session, suggesting the buyers still need more traction to turn the outlook bullish. However, the break above the 20-day SMA definitely brightened the outlook for the short term.
-
03.05.2024 10:28NZD/USD Price Analysis: Comes closer to 0.6000 ahead of US NFP
- NZD/USD moves higher to 0.5980 as US Dollar remains on backfoot ahead of US economic data.
- The US NFP will influence speculation for Fed rate cuts, which are expected in September.
- NZ’s steady Labor Cost Index growth boosts expectations of the RBNZ delaying rate cuts.
The NZD/USD pair extends its two-day winning spell on Friday as the US Dollar hits a fresh three-week low ahead of the United States Nonfarm Payrolls (NFP) and the ISM Services PMI report for April, which will be published in the New York session.
The economic indicators will exhibit the current status of labor demand and economic health, which will be Federal Reserve (Fed) for decision-making on interest rates. This will also drive the speculation about when the Fed will start reducing interest rates. Currently, investors expect that the Fed will start reducing interest rates from the September meeting.
The consensus shows that US nonfarm employers hired 243K job-seekers, lower than robust joining of 303K payrolls in March. Investors will also focus on the Average Hourly Earnings, which is a leading indicator of wage growth that reflects the inflation outlook. The Services PMI is forecasted to have improved to 52.0 from the prior reading of 51.4.
Meanwhile, the New Zealand Dollar strengthens as the Reserve Bank of New Zealand (RBNZ) is expected to start reducing interest rates later this year. The Labor Cost Index data, which reflects wage growth and influence the consumer spending grew in line with estimates in the first quarter this year. This has boosted expectations for the RBNZ delaying rate cuts later this year.
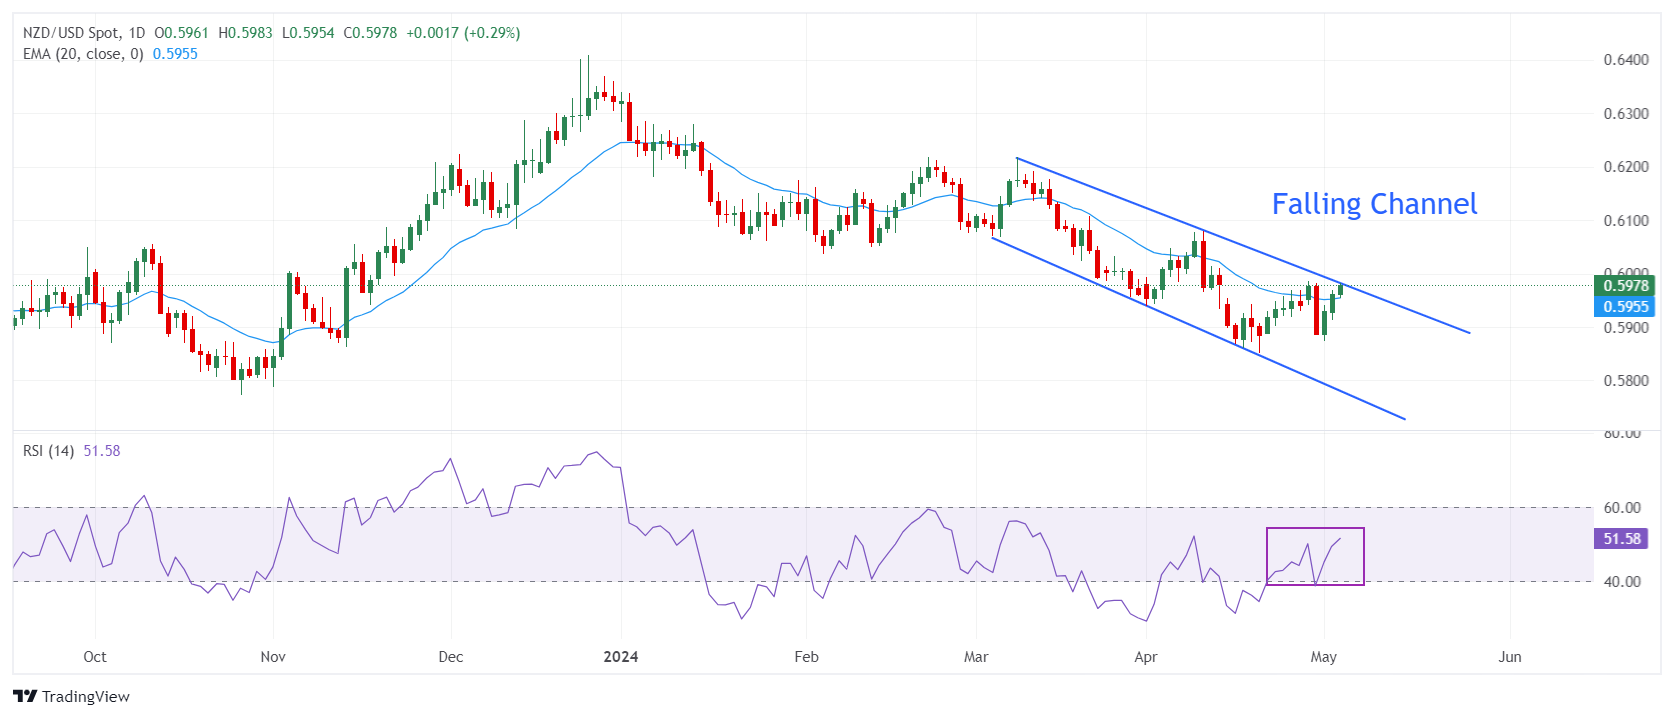
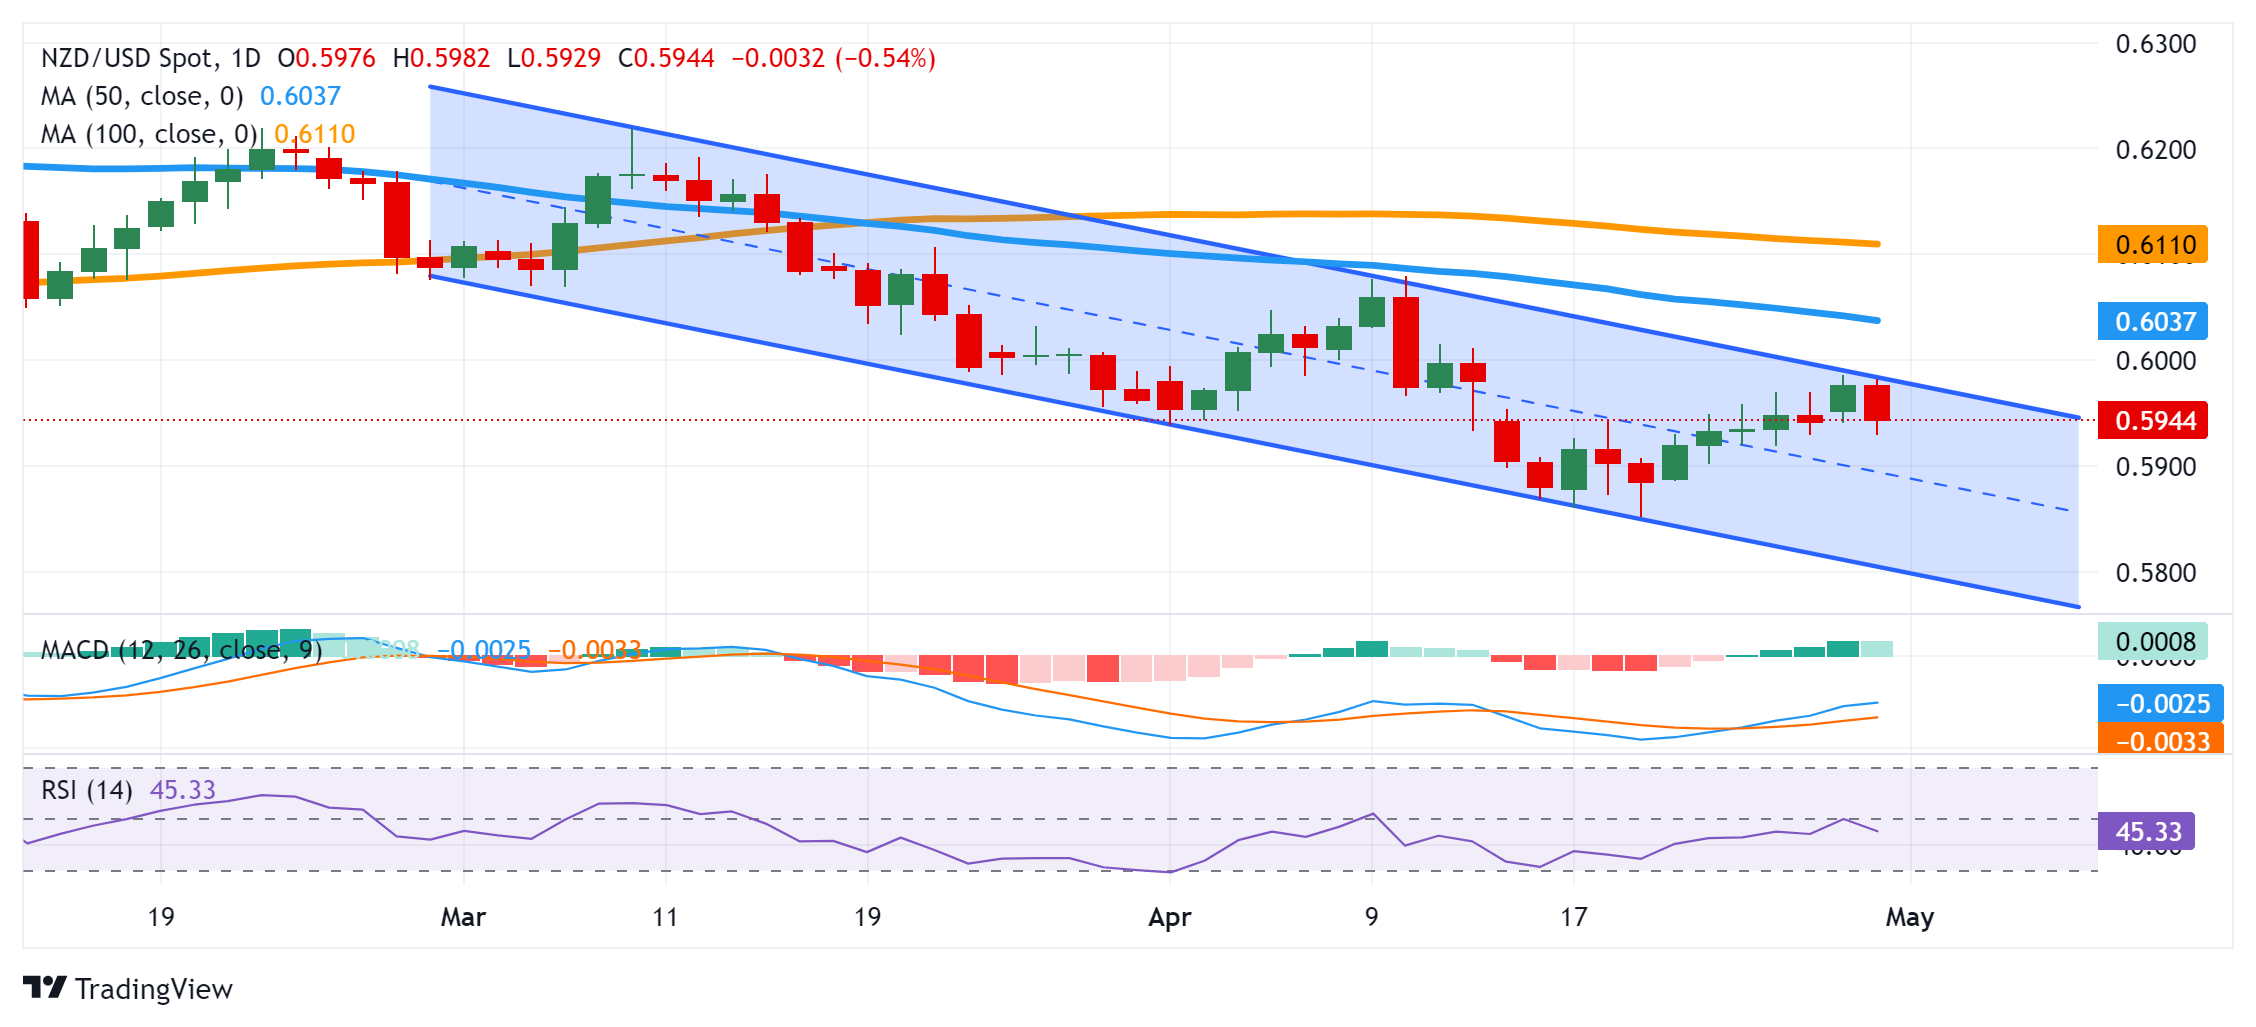
NZD/USD rises to the upward border of the Falling Channel formation on a daily timeframe. The Kiwi asset is at a make or a break near 0.5980 as momentum oscillators exhibit signs of a bullish reversal while a pullback move to the upward border of the above-mentioned chart pattern emerges as a selling opportunity for the market participants knowing that the broader trend is still bearish.
The 14-Relative Strength Index (RSI) rebounds from 40.00, which indicates that the trend is not bearish anymore.
The near-term outlook of the asset improves as it holds above the 20-day Exponential Moving Average (EMA), which trades around 0.5954.
An upside above the psychological resistance of 0.6000 will drive the asset towards April 4 high around 0.6050 and the round-level resistance of 0.6100.
On the contrary, fresh downside would appear if the asset breaks below April 16 low at 0.5860. This would drag the asset toward 8 September 2023 low at 0.5847, followed by the round-level support of 0.5900.
NZD/USD daily chart
-
03.05.2024 00:00NZD/USD holds positive ground above 0.5950 ahead of US NFP data
- NZD/USD gains ground around 0.5965 on softer USD in Friday’s early Asian session.
- There were 208,000 initial jobless claims in the US for the week ending April 27.
- RBNZ stated there’s a risk that renewed inflation pressures could keep global interest rates high for longer.
The NZD/USD pair trades in positive territory for the third consecutive day near 0.5965 during the early Asian trading hours on Friday. The uptick of the pair is bolstered by the further selling pressure of the US Dollar (USD). The releases of the US Nonfarm Payrolls (NFP) and Unemployment Rate for April will be in the spotlight later on Friday.
The number of Americans filing new claims for unemployment benefits for the week ended April 27 held steady at a seasonally adjusted 208,000, better than the forecast of 212,000, the US Department of Labor (DOL) reported on Thursday.
The US Federal Reserve (Fed) noted on Wednesday that inflation remained high in recent months and the Fed doesn’t plan to cut interest rates until it has “greater confidence” that price increases are easing sustainably to its 2% target. The Fed Chair Jerome Powell added that it “will take longer than previously expected. Investors now expect just one rate cut this year, in November, according to futures prices tracked by CME FedWatch. The delay rate cut prospect from the Fed provides some support to the USD and acts as a headwind for the NZD/USD pair.
On the Kiwi front, the Reserve Bank of New Zealand (RBNZ) said in its semi-annual Financial Stability Report on Wednesday that “global inflation is declining from elevated levels and financial markets have priced in lower policy rates over the next year.” Nonetheless, there is a risk that fresh or persistent inflationary pressures could cause global interest rates to stay restrictive for longer. The New Zealand central bank indicated that it doesn’t plan to pivot to monetary easing until 2025, as inflation pressures were higher than expected in the first quarter. This, in turn, continues to support the New Zealand Dollar (NZD) for the time being. -
02.05.2024 19:49NZD/USD Price Analysis: Short-term uptrend hinted, buyers might take some profits
- The daily RSI shows minor buying traction, further validation is needed.
- The hourly chart reveals growing buying momentum with RSI hitting overbought terrain.
- Buyers finally recovered the 20-day SMA, which brightens the outlook for the short term.
The NZD/USD rose to 0.5961, displaying a rally of 0.56% and jumping above the key short-term 20-day Simple Moving Average (SMA) on Thursday which now indicates a potential bullish bias. However, the broader trend remains bearish. With the intense increase in buying traction on an hourly scale, buyers might take some profits ahead of the Asian session.
On the daily chart, the Relative Strength Index (RSI) stands just above negative territory threshold, hinting at a slight uptrend. However, this inconclusive signal requires further validation to be considered a bullish flag.
NZD/USD daily chart
On the hourly chart, the RSI is at 66 slightly down after hitting the overbought threshold. This indicates a stronger short-term buying momentum but that the pair may start to consolidate ahead of Friday’s session. Furthermore, the Moving Average Convergence Divergence (MACD) presents green bars, showing positive momentum.
NZD/USD hourly chart
Considering broader market movements, the NZD/USD’s jump above the 20-day Simple Moving Average (SMA), signify a potential short-term upward trend. However, the pair still lingers below the 100 and 200-day SMA, implying sustained selling pressure and a bearish market bias long-term. That being said, bulls are making arguments to be considered seriously and will start to set their sight at the 100-day SMA at 0.6100.
-
02.05.2024 10:15NZD/USD edges higher on positive market sentiment but systemic factors remain a drag
- NZD/USD edges higher continuing the gains from Wednesday when the Fed adopted an easing bias in its May policy meeting.
- A positive tilt to market sentiment leverages gains for NZD/USD on Thursday.
- Longer-term negative factors and the worsening economic picture in NZ are likely to continue to weigh.
NZD/USD edges higher, up by eight-hundredths of a percent in the 0.5930s, on Thursday, as an improvement in global market sentiment helps commodity currencies, of which the Kiwi is a prime example.
Risk appetite is seen rebounding on the back of falling Oil prices which have reached a seven week low in the mid $79s as well as an overall market-positive outcome of the US Federal Reserve’s (Fed) policy meeting on Wednesday.
Lower Oil prices reduce costs for business and alleviate headline inflation, and the takeaway from the Fed’s May policy meeting was that although US inflation was not falling swiftly enough for the central bank to seriously consider cutting interest rates, neither was it entertaining the notion of raising them either. The Fed also decided to slow the reduction in its holdings of US Treasury bonds, effectively unwinding the pace of quantitative tightening – a dovish move that weakened the US Dollar (USD) in most pairs.
Despite the recovery over the past 48-hrs NZD/USD is likely to remain under pressure over the longer-term, however, due to the poor performance of the New Zealand economy, which increases the chances the Reserve Bank of New Zealand (RBNZ) will cut interest rates before the US Federal Reserve. Since relatively lower interest rates reduce capital inflows, this is likely to hurt NZD more than USD.
New Zealand’s run of poor macroeconomic data continues
Recent data from Statistics New Zealand, showed the New Zealand Unemployment Rate rising to 4.3% in Q1, its highest level for three years. New Zealand is in a technical recession after two quarters of negative growth. Furthermore, headline inflation fell to 4.0% (Core 3.7%) in Q1 from 4.7% previously. Even though inflation remains well above the Reserve Bank of New Zealand’s (RBNZ) target of 1.0% - 3.0%, the pressure is increasing for it to lower interest rates to help boost the stuttering economy.
More negative data out on Wednesday showed Building Permits fell 0.2% in March on a monthly basis – worse still, on an annual basis, the number of homes consented to is down 25.0% suggesting residential investment will remain a drag on New Zealand growth, according to analysts at Brown Brothers Harriman (BBH).
Business Confidence also fell to 14.9 in April, from 22.9 a month earlier, pointing to the third straight month of drop and marking the lowest reading since last September, according to data out on Tuesday.
The RBNZ appears to remain split between doves who want to cut rates and hawks who want to raise them, according to Westpac Chief Economist Kelly Eckhold. Whilst weak growth and high unemployment would be aided by lower interest rates, inflation is not seen as falling fast enough in key areas to warrant lower interest rates.
“Stickiness in core inflation is consistent with embedded inflation expectations..with the implication that inflation may bottom out above 2% without further tightening. The balance of risks does not favor relying on a 5.5% OCR,” says the Chief Economist in her note “Hawks, Doves and Kiwis,” published on Wednesday.For NZD/USD the key question is which central bank – the Fed or the RBNZ – will move to cut interest rates first. Given the worsening economic situation in New Zealand and the Fed’s increasingly neutral position, the RBNZ seems more likely to be the first to make the move.
-
01.05.2024 21:38NZD/USD holds gains following Fed’s decision
- The Fed acknowledged no significant progress towards the 2% inflation goal, maintaining a hawkish stance.
- Despite challenges, Powell notes restrictive policies have moderated inflation and that risks to dual goals are more balanced.
- Markets are giving up the hopes of three rate cuts in 2024.
The NZD/USD found some momentum after the widely-anticipated Federal Reserve (Fed) decision which announced yet another hold, leaving rates at the 5.25-5.50% range. Powell’s cautious tone and data dependency were taken as dovish by markets which made investors dump the USD.
In addition, Powell stated that the bank still needs additional evidence to gain confidence to start cutting rates, noting that inflation’s progress stagnated in the last months. He confirmed that in case data continues to come strong, it would be appropriate to hold the restrictive police for some more time. When the data started to align with the bank’s forecast, he pointed out that he would consider cutting rates.
Regarding expectations, markets are giving up hopes of a cut in June and July and are pushing the start of the easing to September or even November.
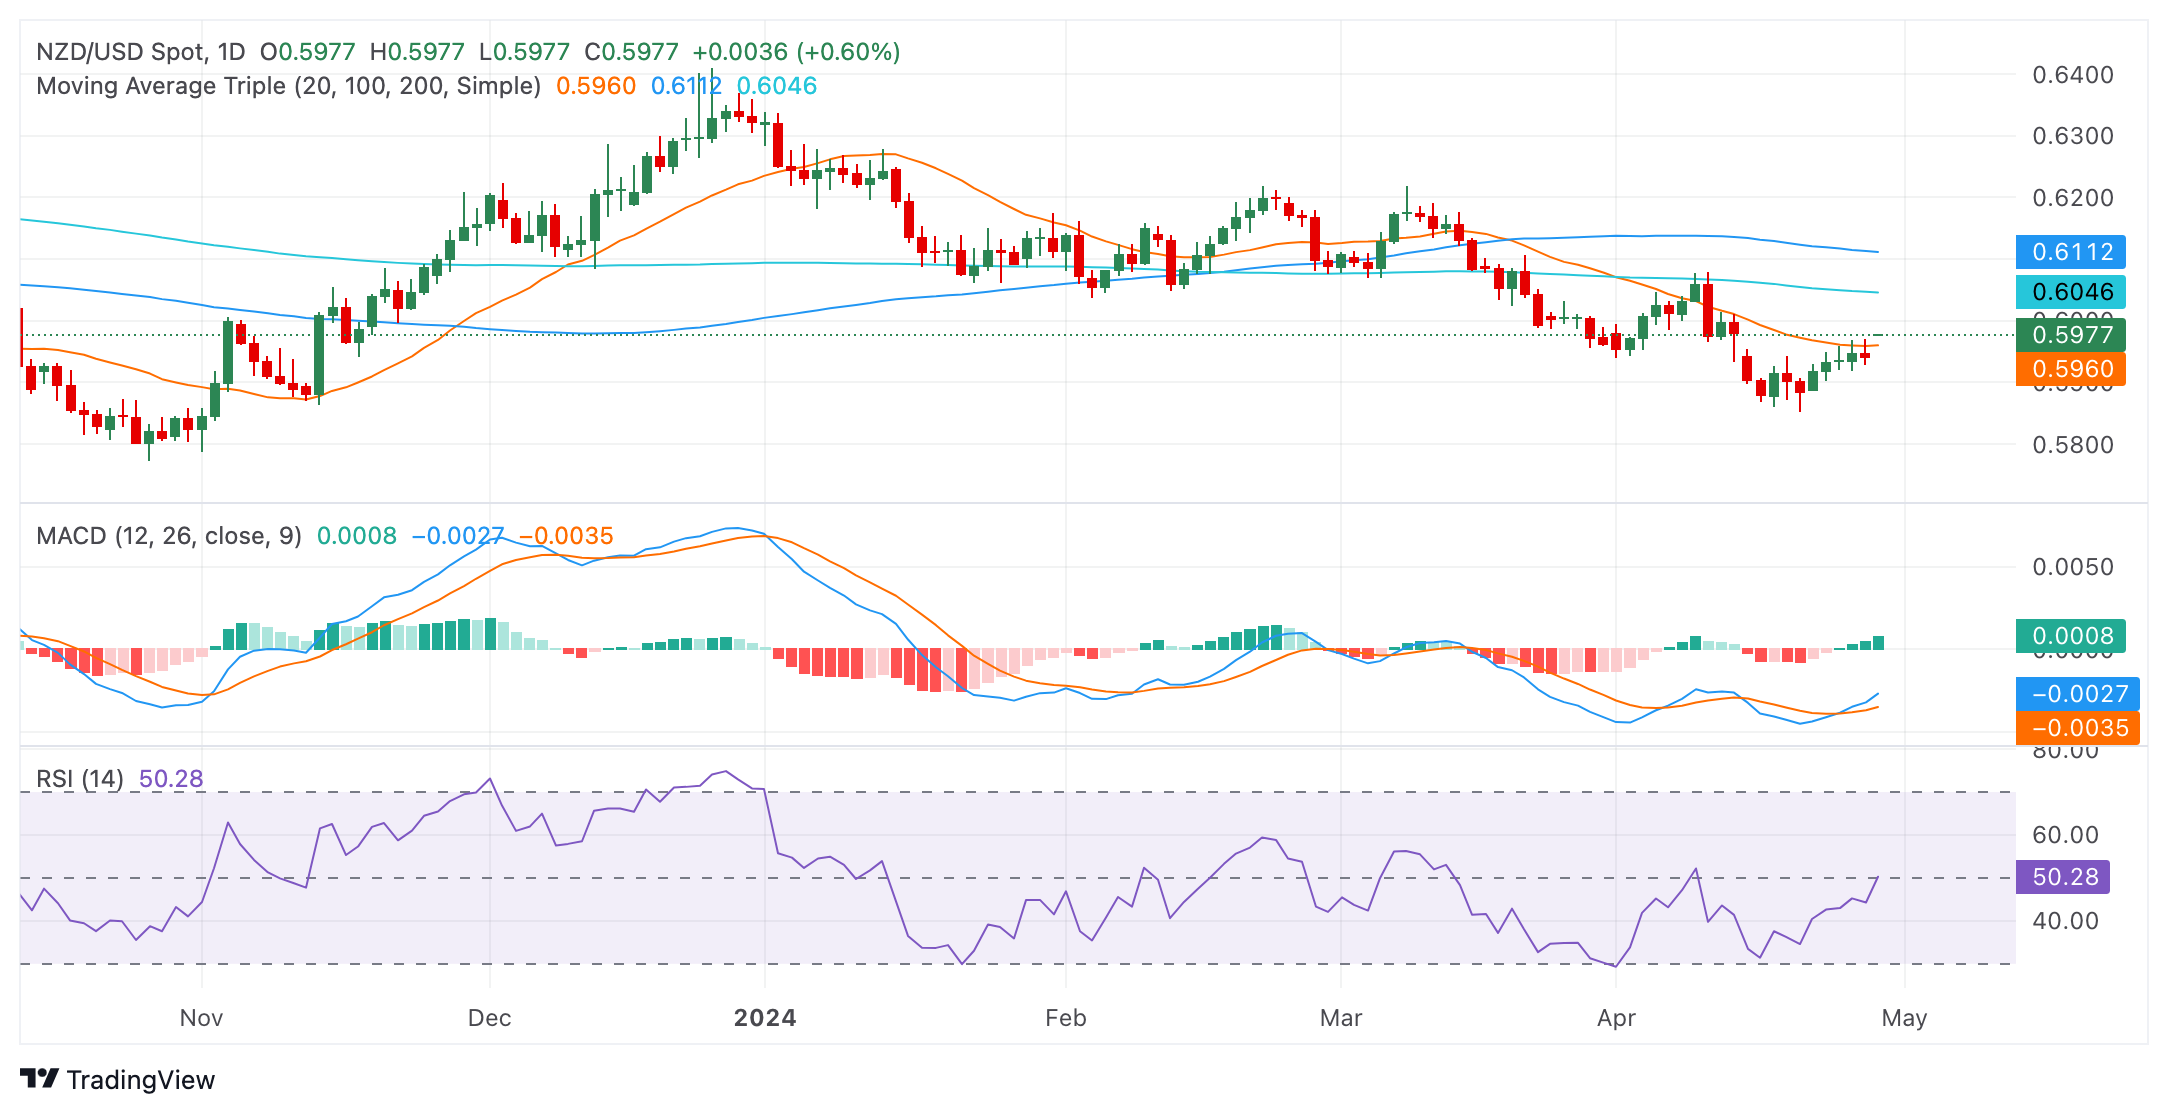
NZD/USD technical analysis
On the daily chart, the Relative Strength Index (RSI) stands in negative territory. The recent readings note an uptick to 44 which shows some light for the bulls but that they remain beneath the positive line. In addition, the Moving Average Convergence Divergence (MACD) histogram marks flat green bars, indicating a slight positive momentum.
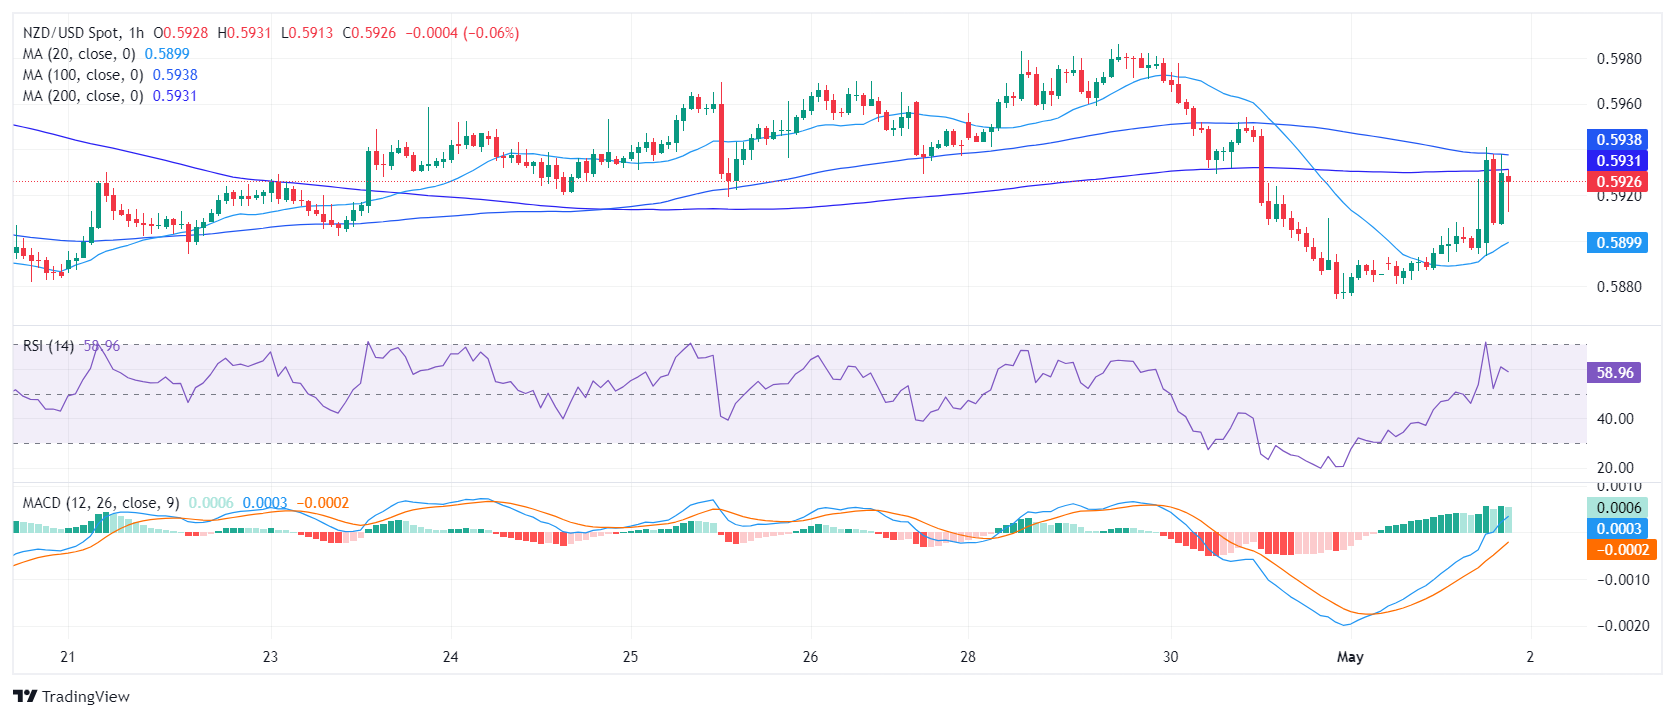
NZD/USD daily chart

Shifting to the hourly chart display, the RSI shows diverse readings with an overbought condition at 70 followed by a drop to 55. Concurrently, the hourly MACD charts flat green bars, similar to the daily forecast, hinting at prospective positive impulse in the short-term.
NZD/USD hourly chart
In assessing the wider picture, the NZD/USD is under significant downward pressure as it is currently positioned below the 20, 100, and 200-day Simple Moving Averages (SMAs).
Overall, the NZD/USD exhibits a mixed picture. Despite an hourly overbought signal tempering prospective bearish conditions, the key SMAs, coupled with the daily RSI readings, lean towards the bearish side, deprecating the NZD/USD pair. Current conditions suggest that sellers may continue to dominate, particularly as the pair trails below the important SMAs but buyers might make another stride at the 20-day SMA at 0.5950 which could brighten the outlook.
-
01.05.2024 10:19NZD/USD Price Analysis: Trades near nine-day low around 0.5900 ahead of Fed’s policy
- NZD/USD recovers intraday losses but uncertainty remains with eyes on Fed’s policy announcement.
- The Fed may emphasize maintaining interest rates higher for a longer period.
- NZ Q1 wage growth rose expectedly while labor demand weakens.
The NZD/USD pair trades close to a nine-day low slightly below the round-level resistance of 0.5900 in Wednesday’s European session. The Kiwi asset recovers early losses in the aftermath of New Zealand Q1 Employment data.
The NZ labor market data showed that quarterly and annual Labor Cost Index grew in line with the consensus of 0.8% and 3.8%, respectively. This will deepen fears of NZ interest rates remaining higher for a longer period as high wage growth fuels inflationary pressures.
The labor demand was weaker than expected as Employment Change fell by 0.2% while investors forecasted the labor market to grow by 0.3%. The Unemployment Rate rose to 4.3% from the estimates of 4.2% and the prior reading of 4.0%.
Going forward, the Kiwi asset will dance to the tunes of the Federal Reserve’s (Fed) interest rate decision, which will be announced at 18:00 GMT. The Fed is expected to hold interest rates steady in the range of 5.25%-5.50% with a hawkish guidance as inflation has remained higher-than-expected in the first quarter this year. This has strengthened the US Dollar’s appeal. The US Dollar Index (DXY), which tracks the Greenback’s value against six major currencies, rose to 106.35.
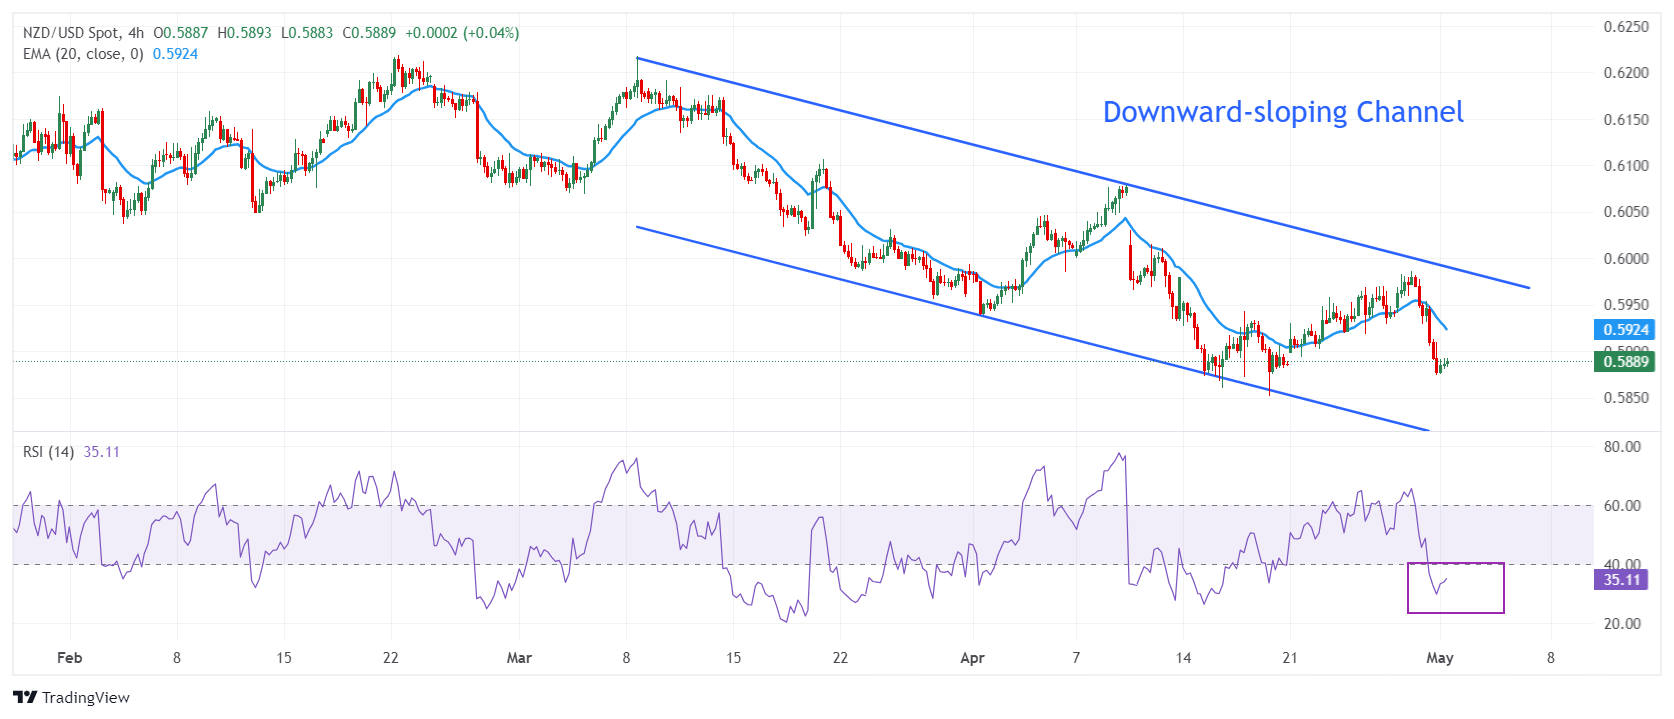
NZD/USD trades in a downward-sloping channel on a four-hour timeframe. This a bearish pattern in which each pullback move is considered as a selling opportunity by the market participants. The near-term appeal is bearish as the asset is trading below the 20-period Exponential Moving Average (EMA), which trades around 0.5924.
The 14-period Relative Strength Index (RSI) oscillates in the bearish range of 20.00-40.00, suggesting that momentum has leaned towards bears.
Fresh downside would appear if the asset breaks below April 16 low at 0.5860. This would drag the asset toward 8 September 2023 low at 0.5847, followed by the round-level support of 0.5900.
On the contrary, an upside above the psychological resistance of 0.6000 will drive the asset towards April 4 high around 0.6050 and the round-level resistance of 0.6100.
NZD/USD four-hour chart
-
01.05.2024 00:56NZD/USD attracts some sellers below 0.5900 following New Zealand employment data
- NZD/USD remains under some selling pressure around 0.5880 on Wednesday.
- The New Zealand Unemployment Rate in Q1 2024 climbed to 4.3% from 4.0% in Q4.
- Traders will monitor the Fed rate decision on Wednesday, with no change in rate expected.
The NZD/USD pair attracts some sellers near 0.5880 on Wednesday during the early Asian session. The Kiwi edges lower following the worse-than-expected New Zealand employment data. Additionally, the cautious mood in the market ahead of the US Federal Reserve's (Fed) interest rate decision on Wednesday remains to underpin the Greenback for the time being.
The unemployment rate in New Zealand rose sharply in the first quarter of this year as the economy suffered an extended recession amid high-interest rates conditions. Statistics New Zealand revealed on Wednesday that the nation’s Unemployment Rate climbed to 4.3% in Q1 from 4.0% in Q4, compared to the market estimation of 4.2%. Meanwhile, Employment Change figure declined by 0.2% in Q1 from a 0.4% rise in the previous reading, worse than the expectation of a 0.3% increase.
The rise in the jobless rate might convince the Reserve Bank of New Zealand (RBNZ) to hold the rate high for a longer period to cool inflation. Markets expect the RBNZ to maintain a restrictive Official Cash Rate, and rate cuts are unlikely to be delivered until 2025.
On the other hand, the US Fed is widely expected to leave rates unchanged in its current 5.25%–5.50% range on Wednesday. The recent hotter-than-expected inflation and robust US economic data triggered speculation that the US central bank might delay the interest rate cut. Investors will keep an eye on the tone of the FOMC statement and press conference. Any hawkish comments from the Fed might strengthen the Greenback and attract more inflows, while the dovish tone might exert some selling on the USD and create a tailwind for the NZD/USD.
-
30.04.2024 22:01NZD/USD Price Analysis: Bears reign supreme, bulls nowhere to be found
- The daily indicators of the NZD/USD daily chart confirm a steady bearish momentum.
- Hourly indicators signal oversold conditions which could lead to a mild upwards correction.
- The failure to regain the 20-day SMA worsens the outlook of the buyers.
The NZD/USD pair plunged to 0.5890 on Tuesday as bears hit the gas and bulls seem to have given up their momentum gained in the last session. Selling conditions are more extreme in the hourly charts as indicators signal oversold conditions which could lead to an upwards correction in the near tearm.
The daily Relative Strength Index (RSI) for the NZD/USD is in the negative territory. The most recent reading signals sellers are currently dominating the market, with a downward trend. Regarding the Moving Average Convergence Divergence (MACD), the decreasing green bars confirm this bearish momentum with the bullish impulse nowhere to be found.
NZD/USD daily chart
On the hourly chart, the RSI shows stronger oversold conditions in the most recent hours. However, the hourly MACD, indicated by flat red bars on the histogram, shows a flattening bearish momentum. Notably, despite the oversold condition, buyers have not yet stepped in with enough strength to shift the momentum toward the green zone but they might in the next hours.
NZD/USD hourly chart
Regarding the larger scope, the NZD/USD displays a bearish trend, evidenced by its position below the Simple Moving Averages (SMA) for the 20, 100, and 200-day periods. After getting rejected by the 20-day SMA multiple times in the last sessions, the outlook is confirmed to be bearish as the time of the buyers seems to be fading. In addition, after failing to conquer that crucial resistance, leaves the pair bound for additional downside. However, ahead of the Asian session, there could be a minor upward correction to consolidate the overextended downward movements seen on the hourly chart.
-
30.04.2024 09:06NZD/USD Price Analysis: Retreats from over two-week high, holds above 0.5900 ahead of US data
- NZD/USD meets with a fresh supply on Tuesday amid a goodish pickup in the USD demand.
- Rejection near the ascending channel hurdle and the subsequent slide favors bearish traders.
- Investors now look to US macro data for some impetus ahead of NZ jobs data on Wednesday.
The NZD/USD pair comes under heavy selling pressure on Tuesday and moves away from over a two-week high, around the 0.5985 region touched the previous day. Spot prices remain depressed through the first half of the European session and currently trade near the lower end of the daily range, around the 0.5940 area amid a goodish pickup in the US Dollar (USD) demand.
Growing acceptance that the Federal Reserve (Fed) will begin its rate-cutting cycle only in September, along with a slightly softer risk tone, turn out to be key factors underpinning the safe-haven buck and weighing on the risk-sensitive Kiwi. Bulls, meanwhile, seem rather unimpressed by mixed Chinese PMI prints released earlier today as the focus remains squarely on the crucial FOMC decision, scheduled to be announced on Wednesday. In the meantime, the US macro data – the Chicago PMI and the Conference Board's Consumer Confidence Index – might provide some impetus ahead of the quarterly New Zealand employment details on Wednesday.
From a technical perspective, the recent recovery from the mid-0.5850 region, or the YTD low touched earlier this month, faced rejection near a resistance marked by the top boundary of a downward-sloping channel extending from early March. The said barrier is currently pegged near the 0.5980-0.5985 region and is closely followed by the 0.6000 psychological mark. A sustained strength beyond will suggest that the NZD/USD pair has bottomed out in the near term and pave the way for some meaningful upside. Spot prices might then aim to surpass the 50-day Simple Moving Average (SMA), around the 0.6040 area, and reclaim the 0.6100 mark.
On the flip side, any further decline is likely to find some support near the 0.5920 area ahead of the 0.5900 round figure. Failure to defend the latter might expose the YTD trough, around the 0.5850 region, before the NZD/USD pair eventually drops to challenge the descending channel support, currently pegged near the 0.5815-0.5810 region. This is followed by the 0.5800 mark, which if broken will be seen as a fresh trigger for bearish traders. That said, mixed oscillators on the daily chart warrant some caution before placing aggressive bets ahead of the key data/central bank event risks and positioning for any further depreciating move.
NZD/USD daily chart
-
30.04.2024 05:04NZD/USD drops to near 0.5950 ahead of Fed decision on Wednesday
- NZD/USD loses ground due to Tuesday's rebound in the US Dollar.
- The hawkish remarks from Fed officials indicate that there is no immediate need for interest rate cuts.
- ANZ Business Confidence has marked its lowest level since last September, indicating a significant economic deterioration.
NZD/USD retraces its recent gains, trading around 0.5950 during the Asian session on Tuesday. The rebound in the US Dollar (USD) undermines the NZD/USD pair, which could be attributed to the hawkish remarks from US Federal Reserve (Fed) officials, indicating no immediate need for rate cuts.
The Economic Times reported on Monday that Fed Chair Jerome Powell said it would probably take "longer than expected" to be confident that inflation is moving toward the central bank's 2% target. Powell also noted that the central bank can keep rates high "as long as needed." Additionally, Fed Governor Michelle Bowman voiced her concerns about "upside risks" to inflation. Meanwhile, Minneapolis Fed President Neel Kashkari suggested the possibility of no rate cuts occurring this year.
US Dollar Index (DXY), which gauges the performance of the US Dollar (USD) against six major currencies, edges higher to near 105.80, by the press time. Traders are anticipated to observe Wednesday's release of the ADP Employment Change and ISM Manufacturing PMI from the United States (US), alongside the Fed Interest Rate Decision. These events are likely to influence market sentiment and USD movement.
In New Zealand, the ANZ Business Confidence fell to 14.9 in April from March’s reading of 22.9, marking the third consecutive month of decline and hitting the lowest level since last September. This latest data suggests a notable weakening of the economy, likely influenced by the Reserve Bank of New Zealand’s (RBNZ) decision to raise interest rates.
Moreover, amid decreasing concerns about a potential conflict between Israel and Iran, growing optimism regarding peace talks between Israel and Hamas in Cairo is enhancing investors' appetite for riskier currencies such as the New Zealand Dollar (NZD). This sentiment could limit the losses of the NZD/USD pair.
-
29.04.2024 21:39NZD/USD Price Analysis: Bearish stance persists and bulls are running out of time
- The NZD/USD maintains a bearish stance while showing a flattening buying momentum on both daily and hourly charts.
- The bulls got rejected again by the 20-day SMA.
- Any upward movement that fails to conquer the mentioned SMA shouldn’t be considered a buying signal.
The NZD/USD pair rallied to 0.5980 on Monday and then stabilized around 0.5960, yet maintains a bearish outlook. While recent movements have shown increased buying momentum, significant positioning beneath key Simple Moving Averages (SMAs) indicates a larger bearish bias and as long as the pair is kept below this levels, the outlook will remain in favor of the bears.
On the daily chart, the Relative Strength Index (RSI) indicates a positive trend for the NZD/USD pair. From the oversold territory, the index is now on its way to its middle point, demonstrating an increase in buying momentum. The Moving Average Convergence Divergence (MACD) histogram displays flat green bars, suggesting steady positive momentum with buyers dominating the market but warns of a flattening buying traction.
NZD/USD daily chart
Transitioning to the hourly chart, the RSI maintains a positive outlook, hovering around the 57 mark but is currently pointing down, suggesting that the buyers are running out of steam in this timeframe. The MACD shows flat green bars, pointing to a more cautious uptrend.
NZD/USD hourly chart
While analyzing the broader scope, the pair currently sits in a bearish posture. The Kiwi's position below its 20, 100, and 200-day Simple Moving Average (SMA), indicates an overall downtrend. The 20-day SMA rejected the buyers at the 0.596 mark on Monday, which could discourage bullish traders. However, ahead of the Asian session, buyers might make an additional stride to recover that level which could brighten the outlook for the pair.
-
29.04.2024 11:11NZD/USD Price Analysis: Prints fresh two-week high near 0.5980
- NZD/USD trades close to a two-week high around 0.5980 amid improved market mood.
- The US Dollar drops ahead of the Fed’s policy meeting, scheduled for May 1.
- NZ Q1 Employment data will guide the next move in the Kiwi Dollar.
The NZD/USD pair refreshes two-week high near 0.5980 in Monday’s European session. The Kiwi asset is up 0.55% as appeal for risk-sensitive assets is upbeat. The US Dollar drops as weak United States data has raised concerns over its economic outlook.
The US Dollar Index (DXY) remains near the key support of 105.50 due to a poor outlook by the S&P Global PMI survey for April and weak Q1 Gross Domestic Product (GDP) data.
Meanwhile, investors shift focus to the Federal Reserve’s (Fed) monetary policy, which will be announced on Wednesday. The CME FedWatch tool shows that interest rates will remain unchanged in the range of 5.25%-5.50%. Therefore, fresh guidance on interest rates will influence further action in the US Dollar.
On the New Zealand Dollar front, investors will focus on the Q1 Employment data, which will be published on Tuesday. The labor market is expected to have grown by 0.3%, slower than the prior pace of 0.4%. The Labor Cost Index that feeds price pressures are forecasted to rise slowly by 0.8% from 1.0% growth recorded in the last quarter of 2023. Tight labor market conditions would allow the Reserve Bank of New Zealand (RBNZ) to keep the monetary policy restrictive for a longer period.
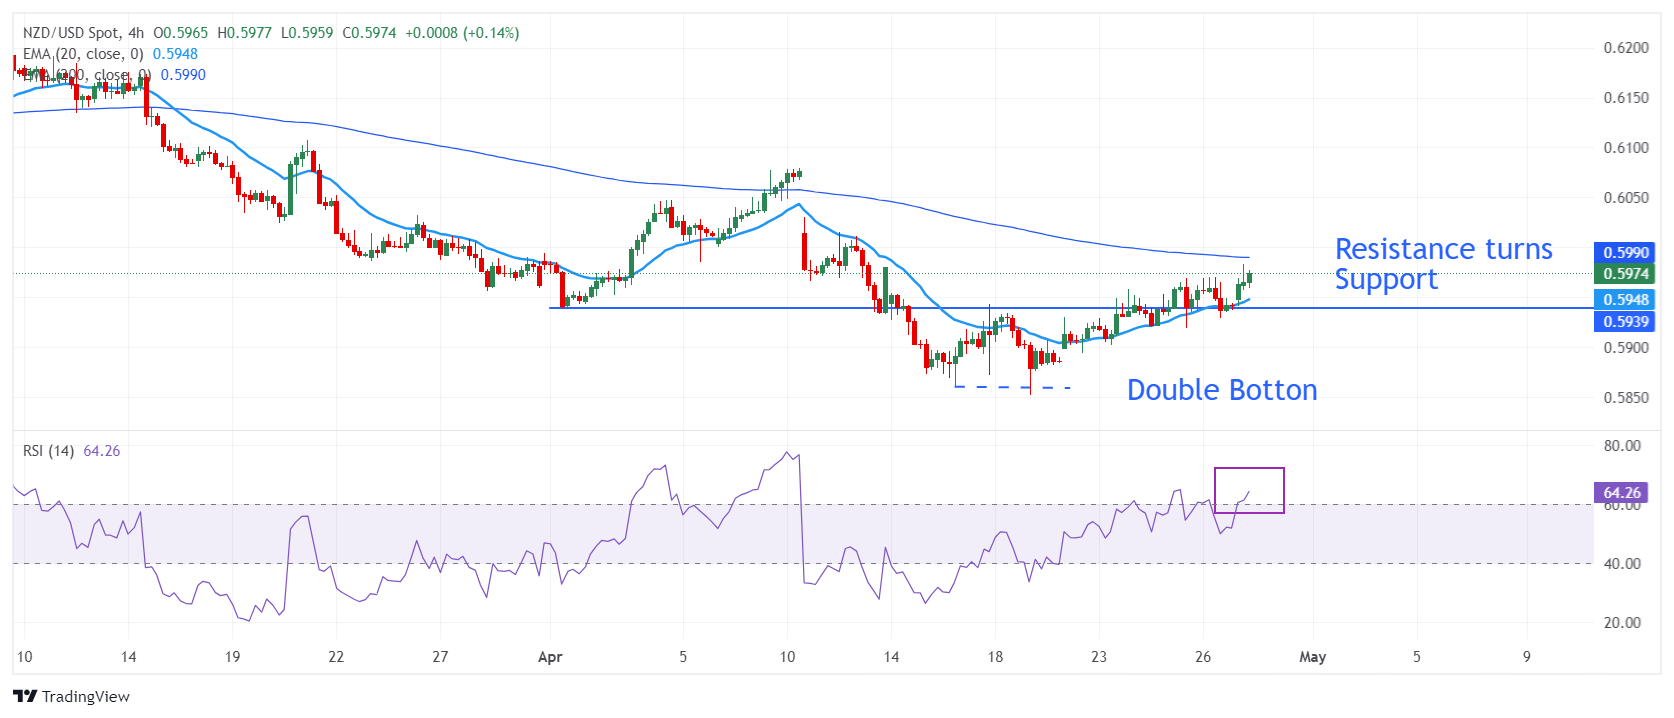
NZD/USD pair rebounds strongly after the discovery of buying interest around 0.5850. The Kiwi asset rebounded after a Double Bottom formation, which lead to a bullish reversal emerges. The asset has extended its upside above the horizontal resistance plotted from April 1 low around 0.5939, which has become a support for New Zealand Dollar bulls.
The near-term outlook improves as the asset holds gains above the 20-period Exponential Moving Average (EMA) around 0.5950. The 200-EMA around 0.5990 is still a major roadblock for the New Zealand Dollar bulls.
The 14-period Relative Strength Index (RSI) climbs above 60.00, suggesting a bullish momentum has been triggered.
Further upside above the psychological resistance of 0.6000 will drive the asset towards April 4 high around 0.6050 and the round-level resistance of 0.6100.
On the contrary, a fresh downside would appear if the asset breaks below April 16 low at 0.5860. This would drag the asset toward 8 September 2023 low at 0.5847, followed by the round-level support of 0.5900
NZD/USD four-hour chart
-
29.04.2024 05:46NZD/USD sticks to intraday gains near two-week high, around 0.5975-80 amid softer USD
- NZD/USD attracts fresh buyers on Monday and advances to over a two-week high.
- A positive risk tone undermines the Greenback and benefits the risk-sensitive Kiwi.
- Hawkish Fed expectations should limit the USD losses and cap the upside for the pair.
The NZD/USD pair gains strong positive traction on the first day of a new week and rallies to over a two-week high, around the 0.5980-0.5985 region during the Asian session.
Against the backdrop of receding fears of an Israel-Iran war, the latest optimism over Israel-Hamas peace talks in Cairo boosts investors' appetite for riskier assets. This is evident from a generally positive tone around the equity markets, which prompts some selling around the safe-haven US Dollar (USD) and benefits the risk-sensitive Kiwi. That said, hawkish Federal Reserve (Fed) expectations should help limit any meaningful USD downfall and cap the upside for the NZD/USD pair.
Investors seem convinced that the US central bank will keep interest rates higher for longer amid still sticky inflation and the bets were reaffirmed by the release of the Personal Consumption Expenditures (PCE) Price Index on Friday. The hawkish outlook, meanwhile, remains supportive of elevated US Treasury bond yields and supports prospects for the emergence of some USD dip-buying, warranting some caution before positioning for any further appreciating move for the NZD/USD pair.
Traders might also prefer to wait on the sidelines ahead of the crucial two-day FOMC monetary policy meeting starting on Tuesday. Apart from this, investors this week will confront the release of important US macro data scheduled at the beginning of a new month, including the closely-watched Nonfarm Payrolls (NFP) on Friday. This, in turn, will play a key role in influencing the near-term USD price dynamics and help in determining the next leg of a directional move for the NZD/USD pair.
-
26.04.2024 05:20NZD/USD remains firmer around 0.5950 due to improved risk appetite
- NZD/USD remains steady due to risk appetite improvements for risk-sensitive currencies.
- The gains of the US Dollar could be limited due to the lower US Treasury yields.
- New Zealand’s ANZ-Roy Morgan Consumer Confidence decreased to 82.1 in April, reaching its lowest level since 2008.
The NZD/USD pair showed positive movement, trading around 0.5960 during the Asian session on Friday. The New Zealand Dollar (NZD), known for its sensitivity to risk sentiment, gained momentum as risk appetite improved, supporting the NZD/USD pair. However, the pair trimmed some of its intraday gains due to a rebound in the US Dollar (USD).
The US Dollar Index (DXY), which measures the USD against six major currencies, edges up to near 105.70, although its gains may be limited by a downward correction in US Treasury yields, contributing to the USD's weakness.
On Thursday, mixed preliminary data from the United States (US) put pressure on the Greenback. The US Gross Domestic Product Annualized (Q1) expanded at a slower pace of 1.6% compared to the previous reading of 3.4%, falling short of market expectations of 2.5%. This slowdown suggests potential headwinds or slowdowns in various sectors of the economy.
However, US consumer prices have shown resilience, with the Personal Consumption Expenditures (QoQ) Price Index for Q1 increasing at a 3.7% annual rate. This exceeded both market expectations of 3.4% and the previous reading of 2.0%, indicating prevailing inflationary pressures that could influence Federal Reserve (Fed) monetary policy decisions.
On the Kiwi's side, Friday's ANZ-Roy Morgan Consumer Confidence slipped to 82.1 in April, from the previous reading of 86.4. This has marked its lowest level since 2008. Despite this decline, New Zealand's consumer confidence remains relatively elevated. Additionally, Stats NZ reported a trade surplus in March, driven by exports reaching a 10-month high while imports fell to a 2-month low. The decrease in imports reflects a sluggish economy, as both households and businesses grapple with the impact of high interest rates.
Looking ahead, market attention is now focused on the US Personal Consumption Expenditures (PCE) Price Index data for March, slated for release on Friday. This data is expected to garner significant interest from investors as they assess its implications for inflationary pressures and potential effects on US monetary policy.
-
25.04.2024 21:52NZD/USD Price Analysis: Bears back off, potential trend reversal on cards tied to 20-day SMA recovery
- The daily chart reveals a bearish bias for the NZD/USD pair underlined by its positioning below major SMAs.
- For bullish traction to take place, buyers must reclaim control over the 20-day SMA SMAs.
- Indicators on the daily chart recovered.
The NZD/USD pair stands at 0.5949, registering daily gains on Thursday’s session. The prevailing outlook, as presented on the daily chart, shows a strong bearish control as the Kiwi continues to trade below the significant Simple Moving Averages (SMAs). Minor upticks visible in the short term do not suggest a meaningful trend reversal. For a bullish revival, bears must cede control to the buyers who would then need to gain the upper hand over the key 20-day SMA to start talking.
On the daily chart, The Relative Strength Index (RSI) for the NZD/USD pair continues within a negative trend territory. However, some signals of possible market correction exist as the RSI values hint at upward momentum. Simultaneously, the Moving Average Convergence Divergence (MACD) shows rising green bars, indicating buyers are gradually edging in against the sellers, lending positive momentum to the market.
NZD/USD daily chart
Moving on to the hourly chart, the RSI also persists in a negative trend, but the latest hour displays an upswing, carrying the indicator above the 50 mark which, paired with decreasing red bars on the MACD histogram, might suggest a short-term trend reversal or correction.
NZD/USD hourly chart
Assessing the overall landscape, the NZD/USD is in a definitive downtrend, underpinned by its position below the 20, 100, and 200-day Simple Moving Averages (SMAs). This situation suggests a prolonged bearish momentum as both short-term and long-term traders are selling the pair. Thursday's price movement raises another red flag as an attempted recovery by buyers has been rejected at the 20-day SMA at the 0.5960 level, suggesting a lack of bullish conviction and the potential for further downside. With these considerations, the outlook remains tilted in favor of sellers.
-
25.04.2024 11:10NZD/USD Price Analysis: Extends winning spell to 0.5960
- NZD/USD rises to 0.5960 as US Dollar exhibits a weak footing ahead of US Q1 GDP data.
- The consensus shows that the US economy expanded by 2.5% in the January-March period.
- The New Zealand Dollar moves higher on improved demand for risk-perceived currencies.
The NZD/USD pair extends its winning streak for the fourth trading session on Thursday. The Kiwi asset movers higher to 0.5960 as the US Dollar falls further amid concerns over United States economic outlook due to a sharp decline in new business inflows in April, showed by S&P Global preliminary PMI report. The US Dollar Index (DXY), which tracks the US Dollar’s value against six major currencies, drops to 10-day low near 105.50.
Downside move in the US Dollar has improved demand for risk-sensitive currencies. However, the market sentiment remains uncertain as investors turn attention to the preliminary US Q1 GDP data, which will be published at 12:30 GMT. The US economy is projected to have grown at a moderate pace of 2.5% against 3.4% growth witnessed in the final quarter of the last year.
Going forward, investors will also watch the US core Personal Consumption Expenditure Price Index (PCE) data for March, which is a Fed’s preferred inflation measure. The inflation measures is estimated to have grown steadily by 0.3% on a month-on-month basis. This will influence speculation for Federal reserve (Fed) rate cuts, which are currently anticipated from the September meeting.
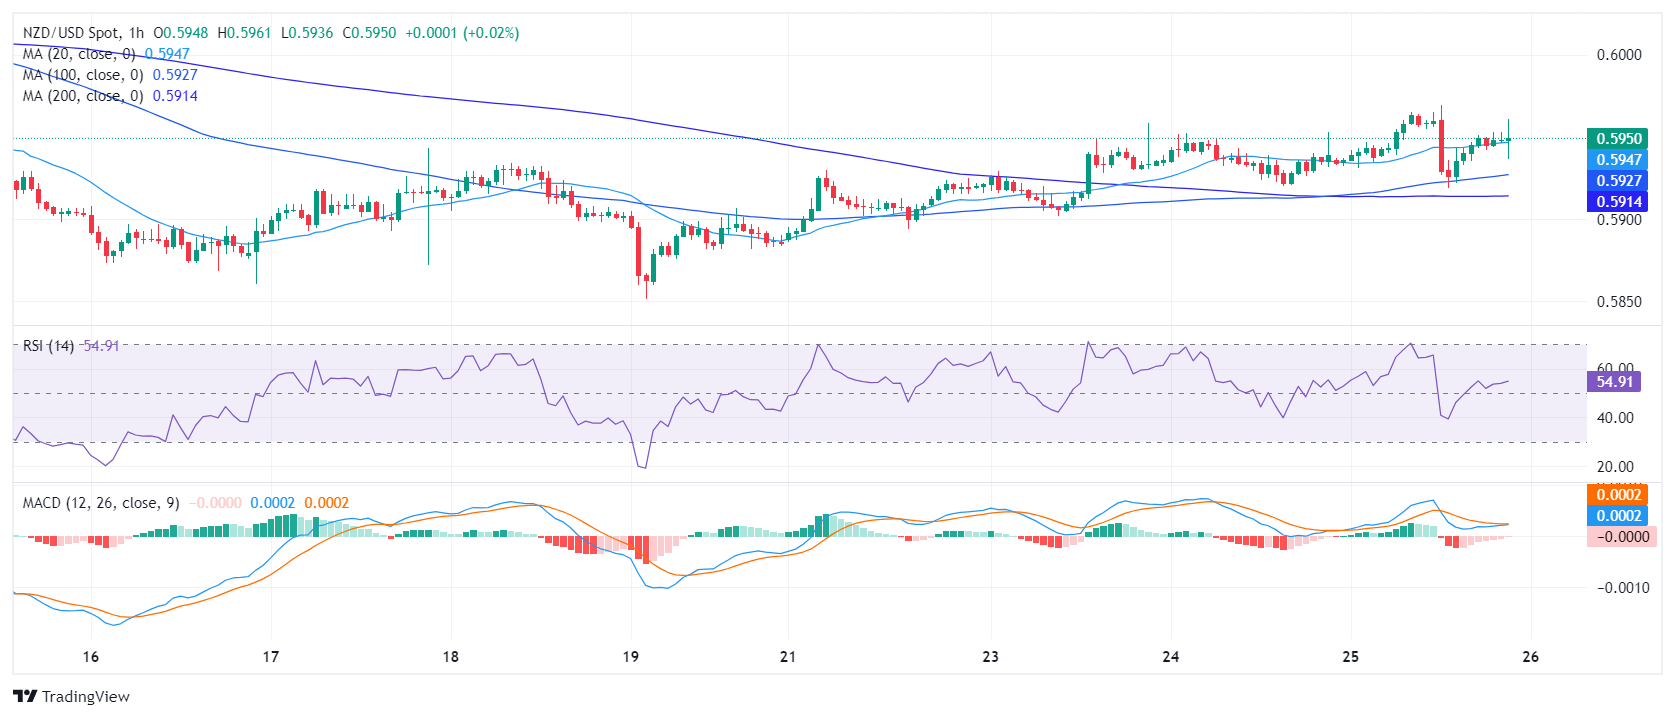
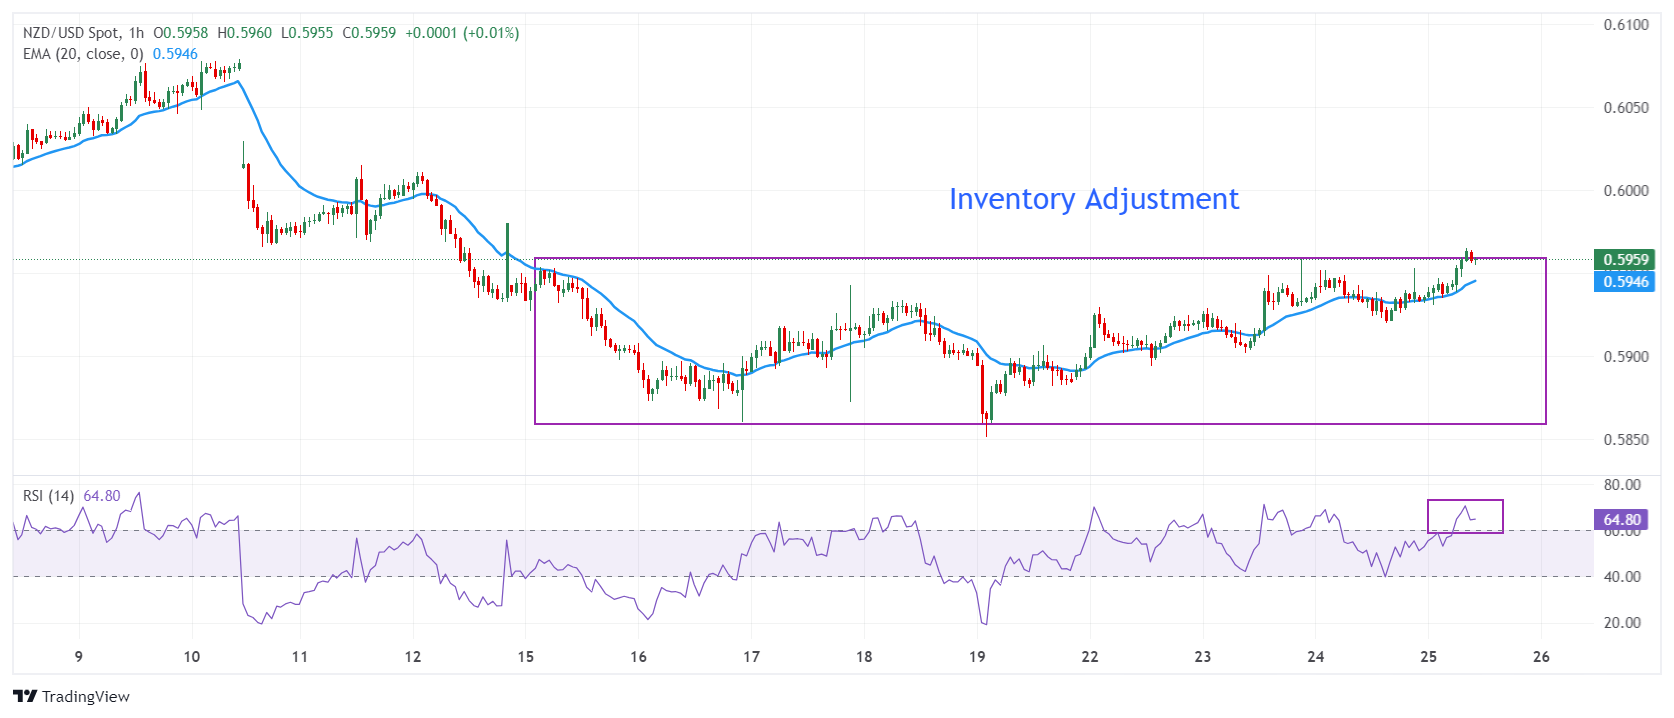
NZD/USD trades close to the upper-end of the inventory adjustment phase in which Kiwi positions are exchanged between institutional investors and retail participants. It is difficult to designate the phase as “accumulation” or “distribution” before a decisive break. The Kiwi asset is expected to deliver a decisive move after the release of the US Q1 GDP data.
Upward-sloping 20-period Exponential Moving Average (EMA) at 0.5947 signifies a bullish near-term appeal for the New Zealand Dollar.
The 14-period Relative Strength Index (RSI) rises above 60.00, suggesting a fresh upside momentum has been triggered.
Further upside above the psychological resistance of 0.6000 will drive the asset towards April 4 high around 0.6050 and the round-level resistance of 0.6100.
On the contrary, a fresh downside would appear if the asset breaks below April 16 low at 0.5860. This would drag the asset toward 8 September 2023 low at 0.5847, followed by the round-level support of 0.5900
NZD/USD hourly chart
-
25.04.2024 04:47NZD/USD rises to near 0.5950 on improved risk appetite
- NZD/USD gains momentum as investors express optimism regarding the de-escalation of tensions between Israel and Iran.
- The higher US Treasury yields could help in limiting the losses of the US Dollar.
- US GDP Annualized (Q1) is expected to grow at a slower rate in the first quarter.
The NZD/USD pair moves in the positive direction, trading around 0.5940 during the Asian session on Thursday. The risk-sensitive New Zealand Dollar (NZD) gains momentum as risk appetite improves. Investors are optimistic about the resolution of conflicts between Iran and Israel, following a statement by an Iranian official suggesting no immediate plans for retaliation against Israeli airstrikes, as reported by Reuters.
The China Securities Journal reported on Tuesday that the People's Bank of China (PBoC) plans to reduce the Medium-term Lending Facility (MLF) rate to decrease funding costs during the next MLF rate setting scheduled for May 15. Lower MLF rates in China could stimulate economic activity and boost consumer spending, which may lead to increased demand for New Zealand goods and services in the Chinese market.
The US Dollar Index (DXY), which measures the US Dollar (USD) against six major currencies, depreciated following mixed manufacturing data from the United States (US). However, the Greenback's losses were somewhat offset by slight gains in US Treasury yields.
According to the US Department of Commerce's report on Wednesday, US Durable Goods Orders rose 2.6% month-over-month (MoM) in March, surpassing the previous reading of 0.7% and beating the estimated 2.5%. However, core goods, excluding transportation, increased 0.2% MoM, falling short of the expected 0.3%.
On Thursday, the preliminary Gross Domestic Product Annualized (Q1) data for the United States (US) is set to be released, with expectations of a growth rate slowdown. These GDP figures will offer insights into the strength of the US economy and could influence future actions by the Federal Reserve (Fed).


© 2000-2024. All rights reserved.
This site is managed by Teletrade D.J. LLC 2351 LLC 2022 (Euro House, Richmond Hill Road, Kingstown, VC0100, St. Vincent and the Grenadines).
The information on this website is for informational purposes only and does not constitute any investment advice.
The company does not serve or provide services to customers who are residents of the US, Canada, Iran, The Democratic People's Republic of Korea, Yemen and FATF blacklisted countries.
Making transactions on financial markets with marginal financial instruments opens up wide possibilities and allows investors who are willing to take risks to earn high profits, carrying a potentially high risk of losses at the same time. Therefore you should responsibly approach the issue of choosing the appropriate investment strategy, taking the available resources into account, before starting trading.
Use of the information: full or partial use of materials from this website must always be referenced to TeleTrade as the source of information. Use of the materials on the Internet must be accompanied by a hyperlink to teletrade.org. Automatic import of materials and information from this website is prohibited.
Please contact our PR department if you have any questions or need assistance at pr@teletrade.global.
transfers