- Analytics
- News and Tools
- Quotes
- Chart and quotes for GBPUSD
CFD Trading Rate Great Britain Pound vs US Dollar (GBPUSD)
| Date | Rate | Change |
|---|
Related news
-
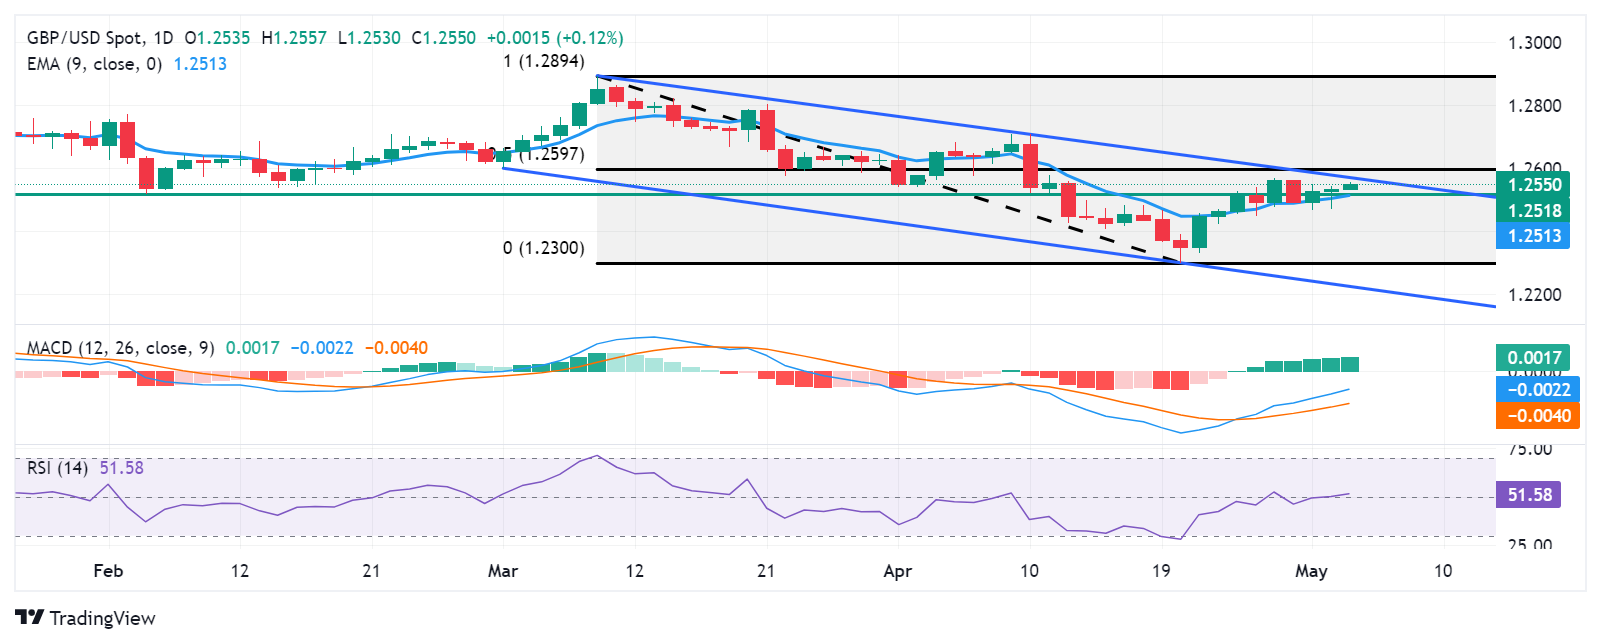
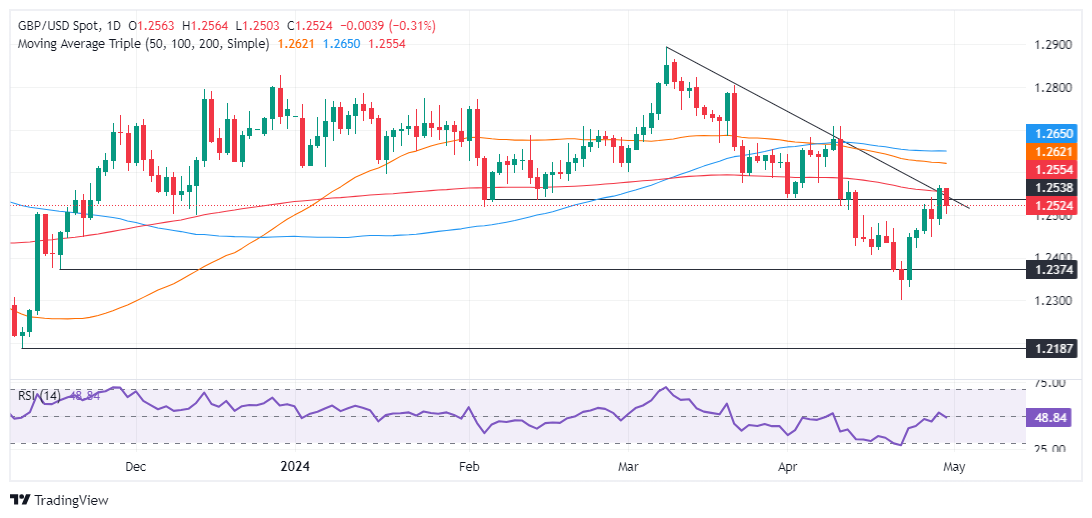
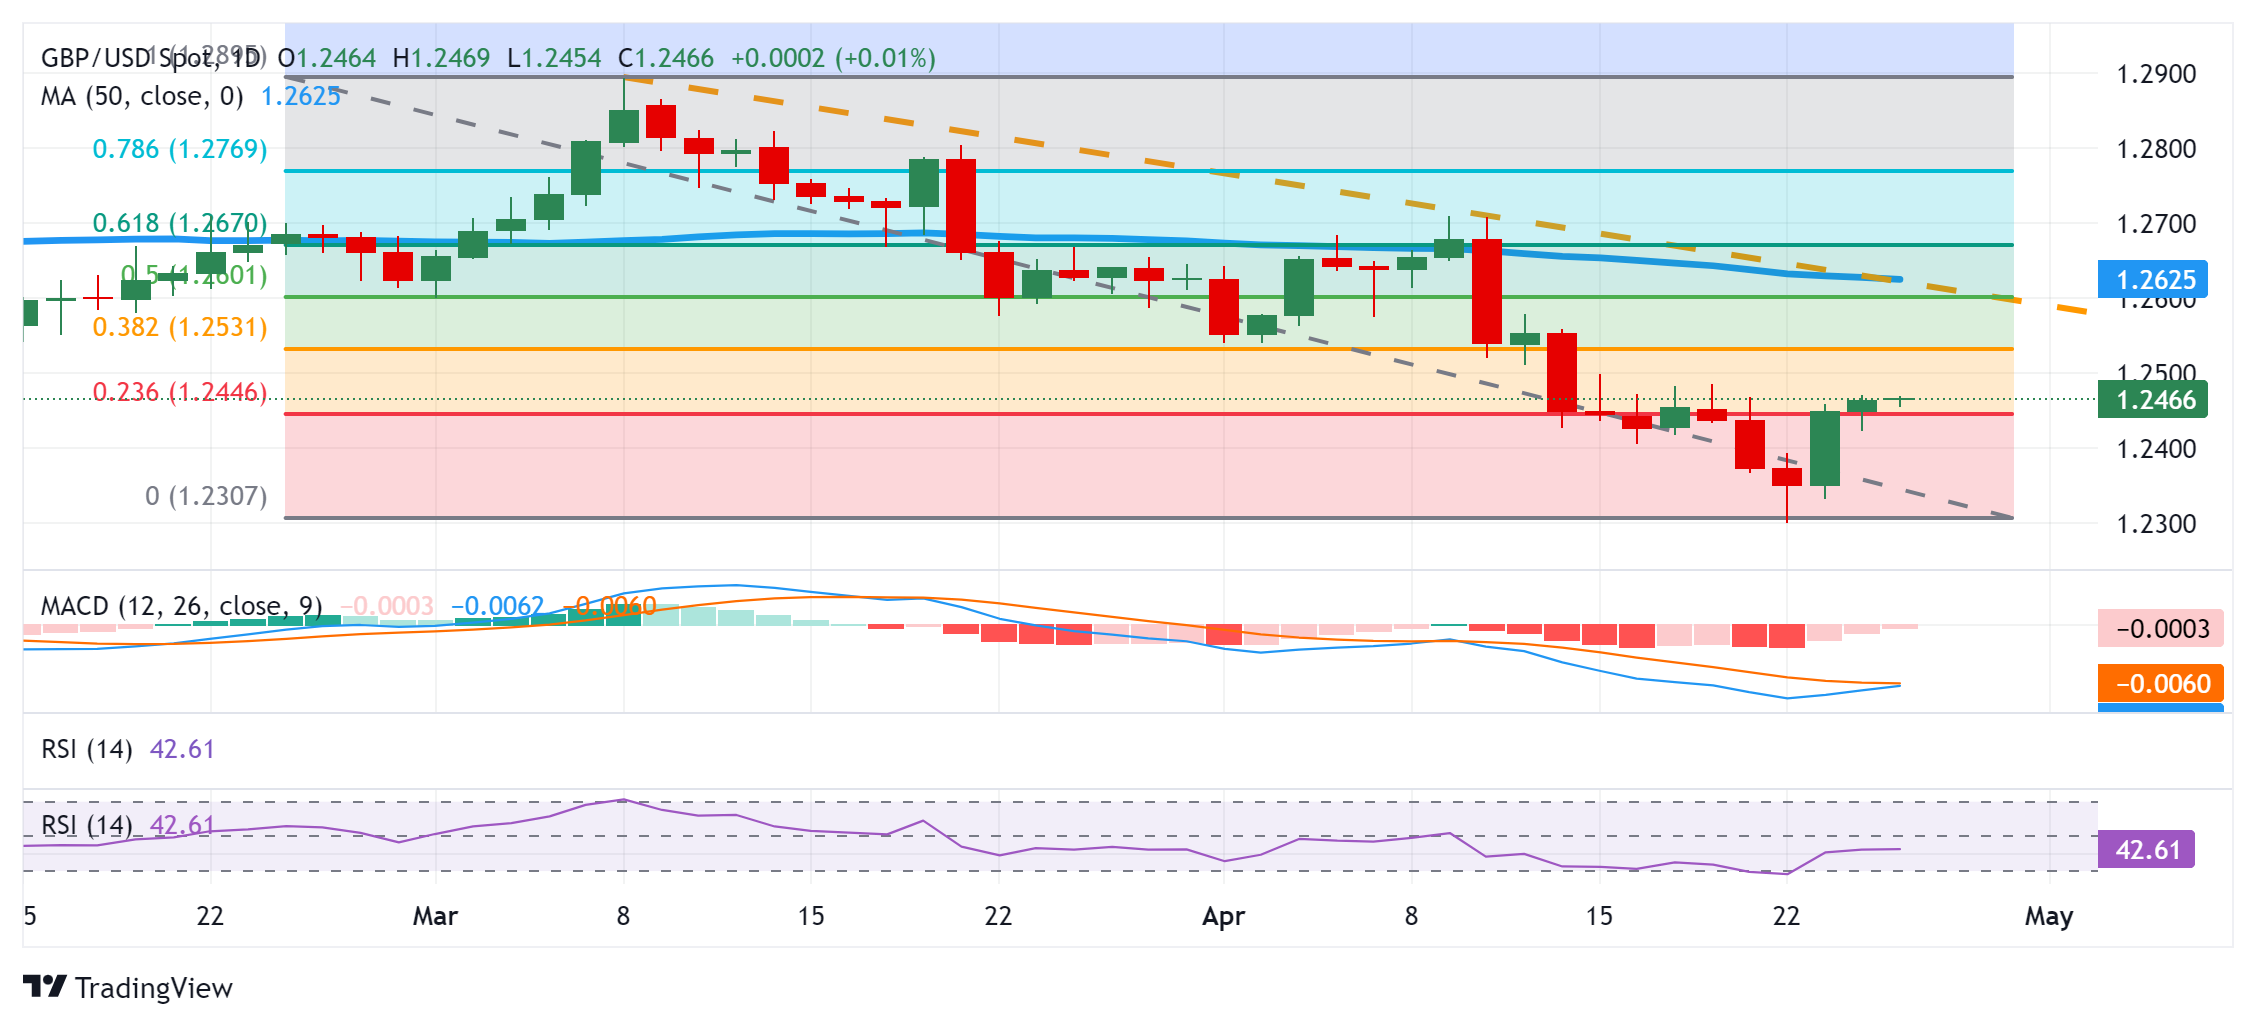
03.05.2024 06:06GBP/USD Price Analysis: Moves above 1.2550 to test the channel’s upper boundary
- GBP/USD could test the immediate throwback support at the 1.2518 level and the nine-day EMA at 1.2514.
- The momentum indicator MACD could offer a clear bullish direction once it breaks above the centerline.
- The pair could test the upper boundary of the descending channel around 1.2570 level.
GBP/USD extends its gains for the third successive session on Friday, trading around 1.2550 during the Asian session. The pair consolidates within the descending channel on a daily chart, with the 14-day Relative Strength Index (RSI) moving above the 50-level. indicating the weakening of a bearish bias.
Additionally, the Moving Average Convergence Divergence (MACD) indicates a momentum shift as it is positioned above the signal line but below the centerline. This momentum indicator could confirm a clear direction for the GBP/USD pair once it breaks above the centerline.
The GBP/USD pair could test the immediate throwback support at the 1.2518 level, aligned with the nine-day Exponential Moving Average (EMA) at 1.2514. The next support appears at the psychological level of 1.2500. A break below this level could exert pressure on the pair to navigate the region around the six-month low of 1.2300.
On the upside, the immediate resistance appears at the upper boundary of the descending channel around the level of 1.2570 followed by the 50% retracement level at 1.2597 level, plotting between the range of 1.2894 and 1.2300.
GBP/USD: Daily Chart
-
02.05.2024 23:06GBP/USD trades on a stronger note 1.2530, all eyes on US NFP data
- GBP/USD holds positive ground near 1.2540 on the weaker USD on Friday.
- The Fed held interest rates steady on Wednesday.
- The BoE is expected to leave rates unchanged for the sixth time in a row at its meeting next week.
The GBP/USD pair trades on a stronger note around 1.2540 amid the softer US Dollar (USD) on Friday during the early Asian session. The US Federal Reserve (Fed) Chair Jerome Powell delivered a modest dovish message after the meeting on Wednesday, which weighs on the Greenback. However, the ongoing backdrop of elevated inflation and robust growth in the US should keep the Fed on hold and maintain the higher-for-longer narrative, which might support the USD. Later in the day, the US S&P Global Services PMI will be due, along with the US employment data for April.
The Fed decided to leave its key interest rate steady at the highest level in more than two decades, in the range of 5.25%–5.5%, where it has stood since last July. The US central bank acknowledged the worsening inflation outlook, citing that there has been a lack of further progress toward the Fed's 2% inflation target in recent months.
Fed’s Powell emphasized that it’s unlikely that the next policy rate move will be a hike, adding that rate cut timing will depend on the data and that the unexpected weakening in the labor market could warrant a cut. Investors will closely monitor the US April Nonfarm Payrolls (NFP) on Friday. In the case of weaker-than-expected data, this could exert further selling pressure on the USD and create a tailwind for the GBP/USD pair.
On the other hand, the Bank of England (BoE) will announce its interest rate decision next week. The BoE is anticipated to hold interest rates steady at 5.25% for the sixth time in a row, while the markets have fully priced in the first rate cut in September. Market players will take more cues from the inflation outlook and cues about when the BoE will start cutting interest rates. -
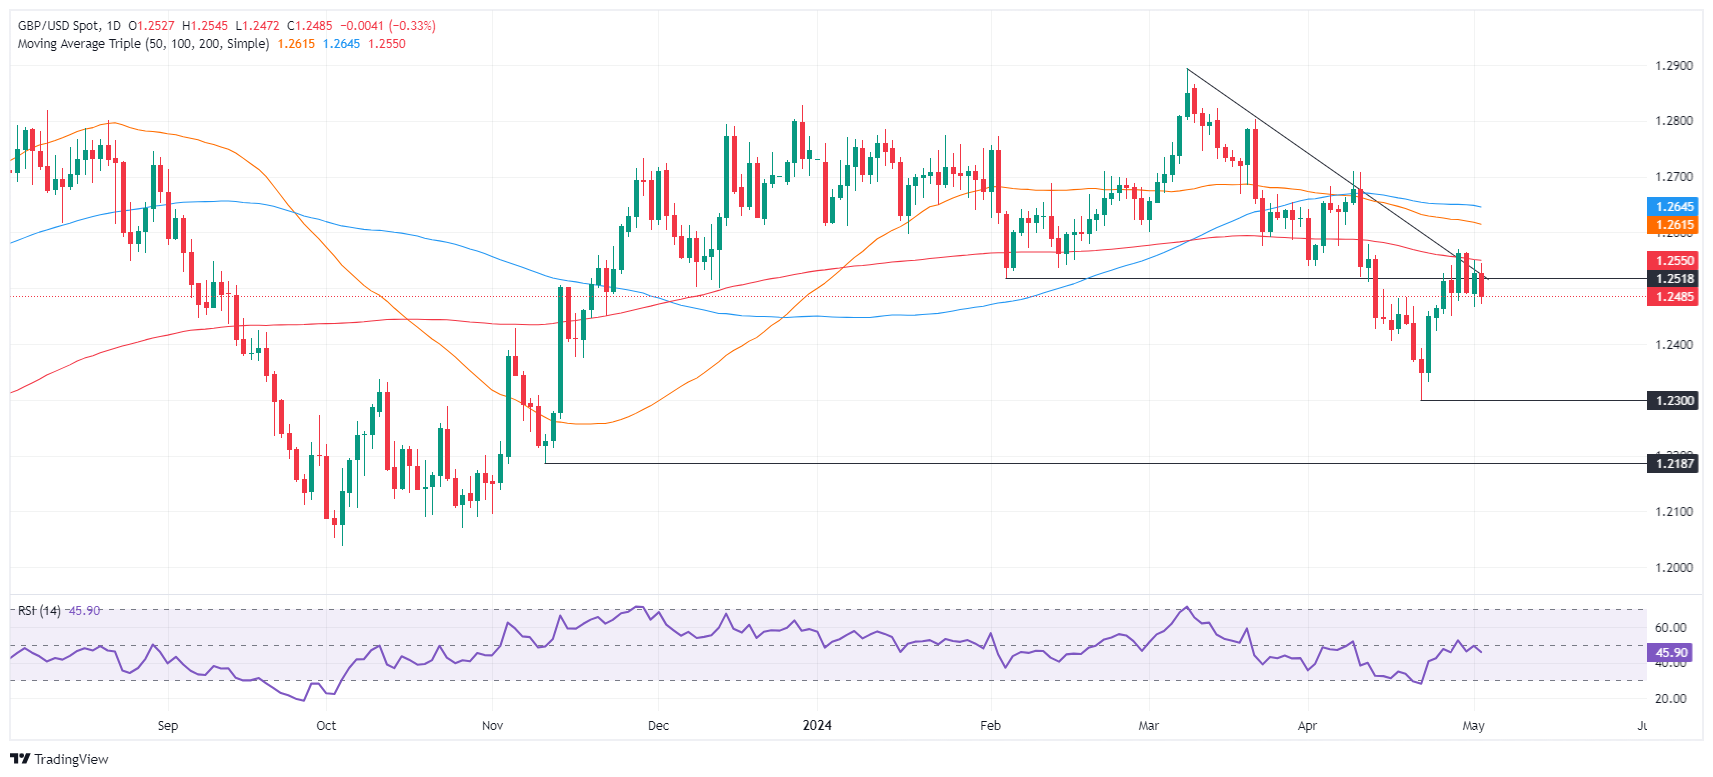
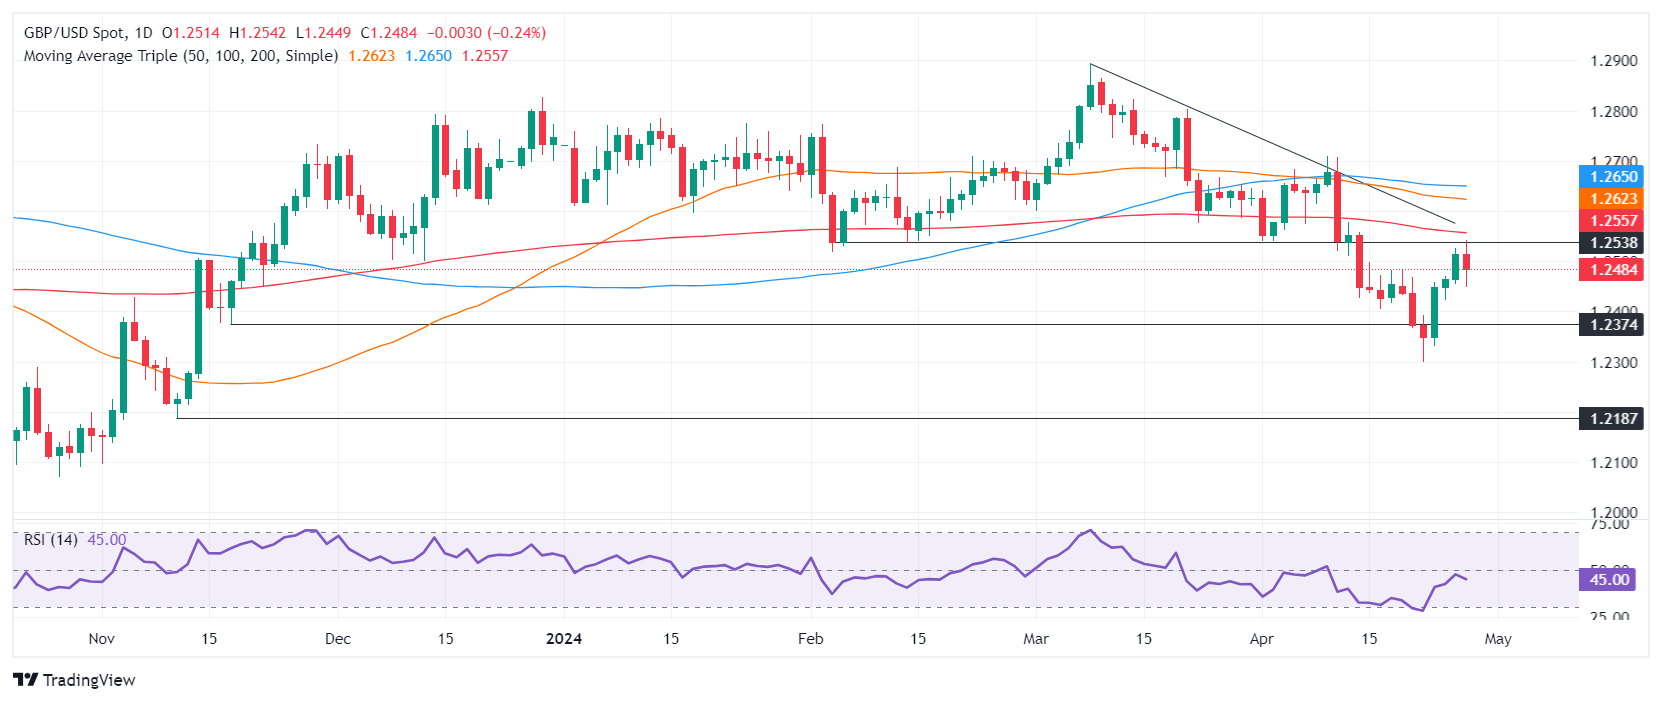
02.05.2024 14:57GBP/USD Price Analysis: Tumbles below crucial 1.2500 as bears move in
- GBP/USD drops 0.30%, US Dollar rises on positive US trade and labor data.
- The GBP/USD struggles below 200-DMA at 1.2550, trending down.
- RSI indicates bearish momentum; sellers control the market.
- Recovery above 1.2500 could retest 200-DMA, with resistance at 1.2569 and 50-DMA at 1.2613.
The Pound Sterling tumbled in early trading during the North American session, dropping below the 1.2500 figure amid renewed US Dollar strength. Data from the United States showed that the Balance of Trade deficit tightened while the labor market remained tight, as revealed by the Initial Jobless Claims report. The GBP/USD trades at 1.2488, down 0.30%.
GBP/USD Price Analysis: Technical outlook
From a technical standpoint, the GBP/USD is showing a neutral to downward bias. This is a result of buyers failing to breach the significant resistance at the 200-day moving average (DMA) at 1.2550. This failure has further intensified the major’s drop below the 1.2500 figure, potentially paving the way for a test of the latest cycle low seen at 1.2299, the April 22 low.
Momentum points to a continuation of the downtrend, as the Relative Strength Index (RSI) turned bearish on April 30. As of writing, it aims downward, meaning sellers remain in charge.
On the other hand, if buyers reclaim 1.2500, they must reclaim the 200-DMA ahead of testing the April 29 high at 1.2569. Once cleared, the next stop would be the 1.2600 mark, followed by the 50-DMA at 1.2613. Further gains are seen above the 100-DMA at 1.2644.
GBP/USD Price Action – Daily Chart
-
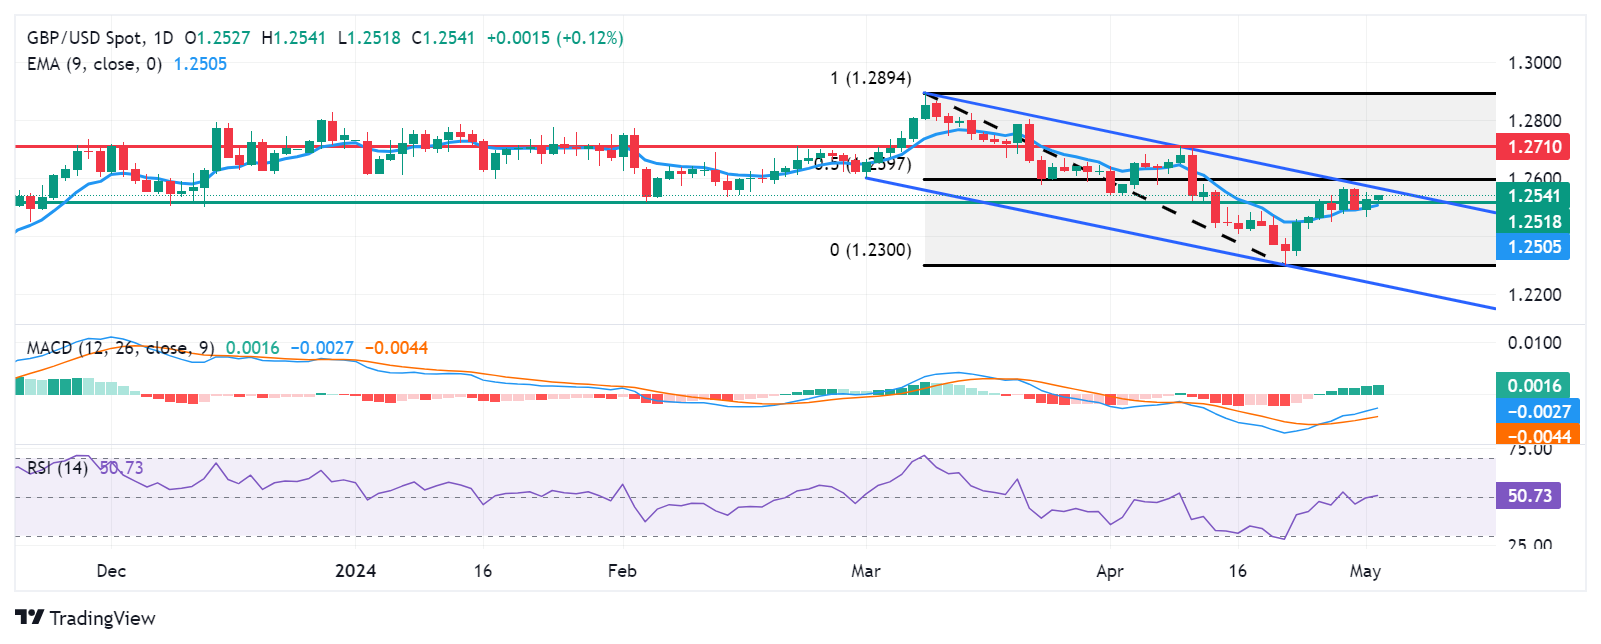
02.05.2024 06:17GBP/USD Price Analysis: Advances to near 1.2550 with expectations of a momentum shift
- GBP/USD gains ground as technical indicators suggest a momentum shift for the pair.
- The momentum indicator could confirm a weakening of the bearish bias once it breaks above the centerline.
- The pair could meet the immediate barrier at the upper boundary of the descending channel around 1.2570 level.
GBP/USD extends its gains for the second successive session on Thursday, trading around 1.2530 during the Asian session. The pair consolidates within the descending channel on a daily chart, with the 14-day Relative Strength Index (RSI) positioning on the 50-level. A further increase will indicate the weakening of a bearish bias.
Additionally, the Moving Average Convergence Divergence (MACD) indicates a momentum shift as it is positioned above the signal line but below the centerline. This momentum indicator could confirm the weakening of the bearish bias once it breaks above the centerline.
The GBP/USD pair could test the immediate throwback support at the 1.2518 level, followed by the nine-day Exponential Moving Average (EMA) at 1.2504 and the psychological level of 1.2500. A break below this level could exert pressure on the pair to navigate the region around the six-month low of 1.2300, followed by the lower boundary of the descending channel around the level of 1.2240.
On the upside, the immediate resistance appears at the upper boundary of the descending channel around the level of 1.2570 followed by the 50% retracement level at 1.2597 level, plotting between the range of 1.2894 and 1.2300.
A breakthrough above the latter could support the GBP/USD pair to explore the area around the pullback resistance at the 1.2710 level.
GBP/USD: Daily Chart
-
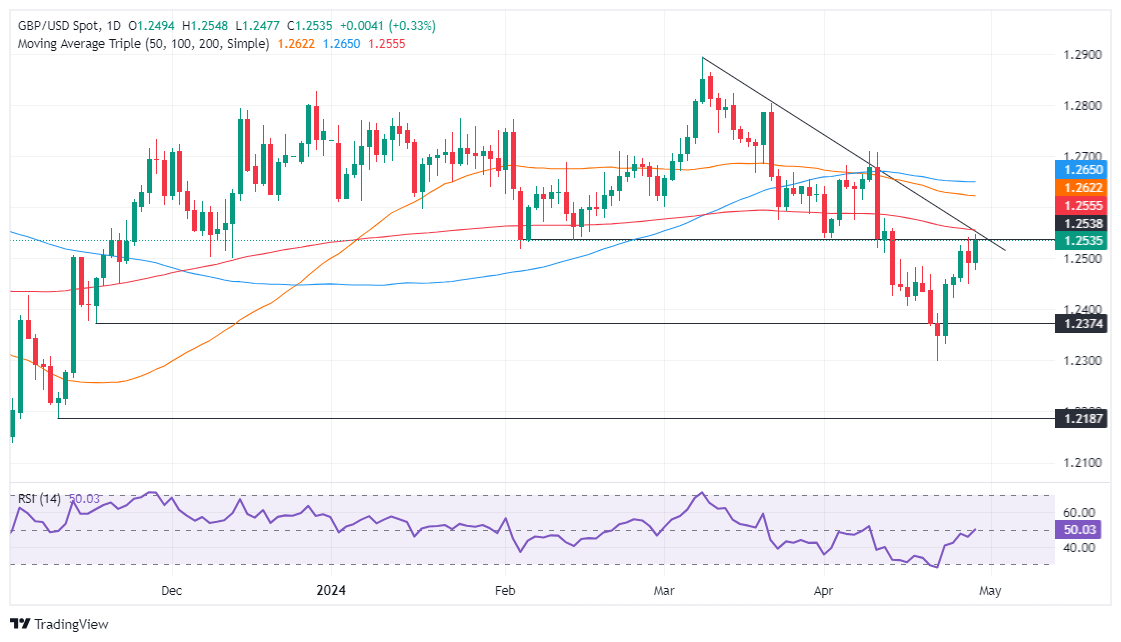
01.05.2024 23:12GBP/USD gains traction above 1.2500, Fed keeps rates steady
- GBP/USD trades on a stronger note around 1.2535 amid the weaker USD on Thursday.
- The Fed maintained rates unchanged in a 5.25%–5.50% range, as widely expected.
- Financial markets expect the Bank of England (BoE) to cut borrowing costs in the June or August meetings.
The GBP/USD pair gains traction near 1.2535 on Thursday during the early Asian session. The uptick of the major pair is supported by the sharp decline of the US Dollar (USD) after the US Federal Reserve (Fed) left its interest rate unchanged.
As widely anticipated, the US central bank kept its benchmark rate in a target range of 5.25%–5.50% at its May meeting on Wednesday, its highest level in more than two decades. The US Fed did not expect it would be appropriate to cut the interest rate until the central bank gain greater confidence that inflation was moving sustainably to its 2% target.
Furthermore, Fed Chair Jerome Powell said during the press conference, “I think it’s unlikely that the next policy rate move will be a hike.” These comments spark a modest dovish reaction in the markets, which weighs on the Greenback and creates a tailwind for the GBP/USD pair. Amidst the persistence of elevated inflation and the robust economy, financial markets see only one rate cut in November, according to the CME FedWatch. The central bank has also announced that it will now reduce its bond portfolio more slowly. The Fed will reduce their monthly holdings in US Treasury securities from $60 billion to $25 billion, starting in June
On the other hand, investors expect the Bank of England (BoE) to cut borrowing costs in the June or August meetings, as BoE Governor Andrew Bailey said he is confident that headline inflation will return to 2% in April. However, BoE Chief Economist Huw Pill warned last week that there were greater risks from cutting the interest rate too quickly, rather than too late. His remarks provide some support for the Pound Sterling (GBP). -
01.05.2024 18:21GBP/USD fluctuates as Federal Reserve hold rates, plans to slow balance sheet reduction
- GBP/USD trades between 1.2480 and 1.2512, reacting to the Federal Reserve's decision to hold rates unchanged.
- The Fed adopts a more balanced approach to achieving employment and inflation targets, noting a stall in progress towards the 2% inflation goal.
- The Fed will slow the pace of reduction of its securities holdings in June.
The GBP/USD seesaws after the Federal Reserve held rates unchanged but announced that it would slow the pace of its balance sheet reduction beginning in June. The major trades volatile within the 1.2480/1.2512 range at the time of writing,
Summary of monetary policy statement
Fed officials commented on its monetary policy statement that the risks to achieving employment and inflation goals “have moved toward better balance over the past year.” They acknowledged that despite inflation having been trending lower, “there has been a lack of further progress toward the Committee’s 2 percent inflation objective.”
Regarding the balance sheet reduction, Fed officials noted, “Beginning in June, the Committee will slow the pace of decline of its securities holdings by reducing the monthly redemption cap on Treasury securities from $60 billion to $25 billion. The Committee will maintain the monthly redemption cap on agency debt and agency mortgage-backed securities at $35 billion and will reinvest any principal payments in excess of this cap into Treasury securities.”
GBP/USD Reaction to Federal Reserve’s decision
Initially, the GBP/USD edged towards its daily high of 1.2512 before retreating beneath 1.2500. Due to the lack of follow-through, the pair could be testing the lows of the day at 1.2466 if the Fed Chairman Jerome Powell delivers some hawkish remarks. The next key support level beneath that would be the April 26 low at 1.2448, followed by the 1.2400 figure. On the upside lies the 200-day moving average (DMA) at 1.2552.
GBP/USD Price Action – Hourly Chart

-
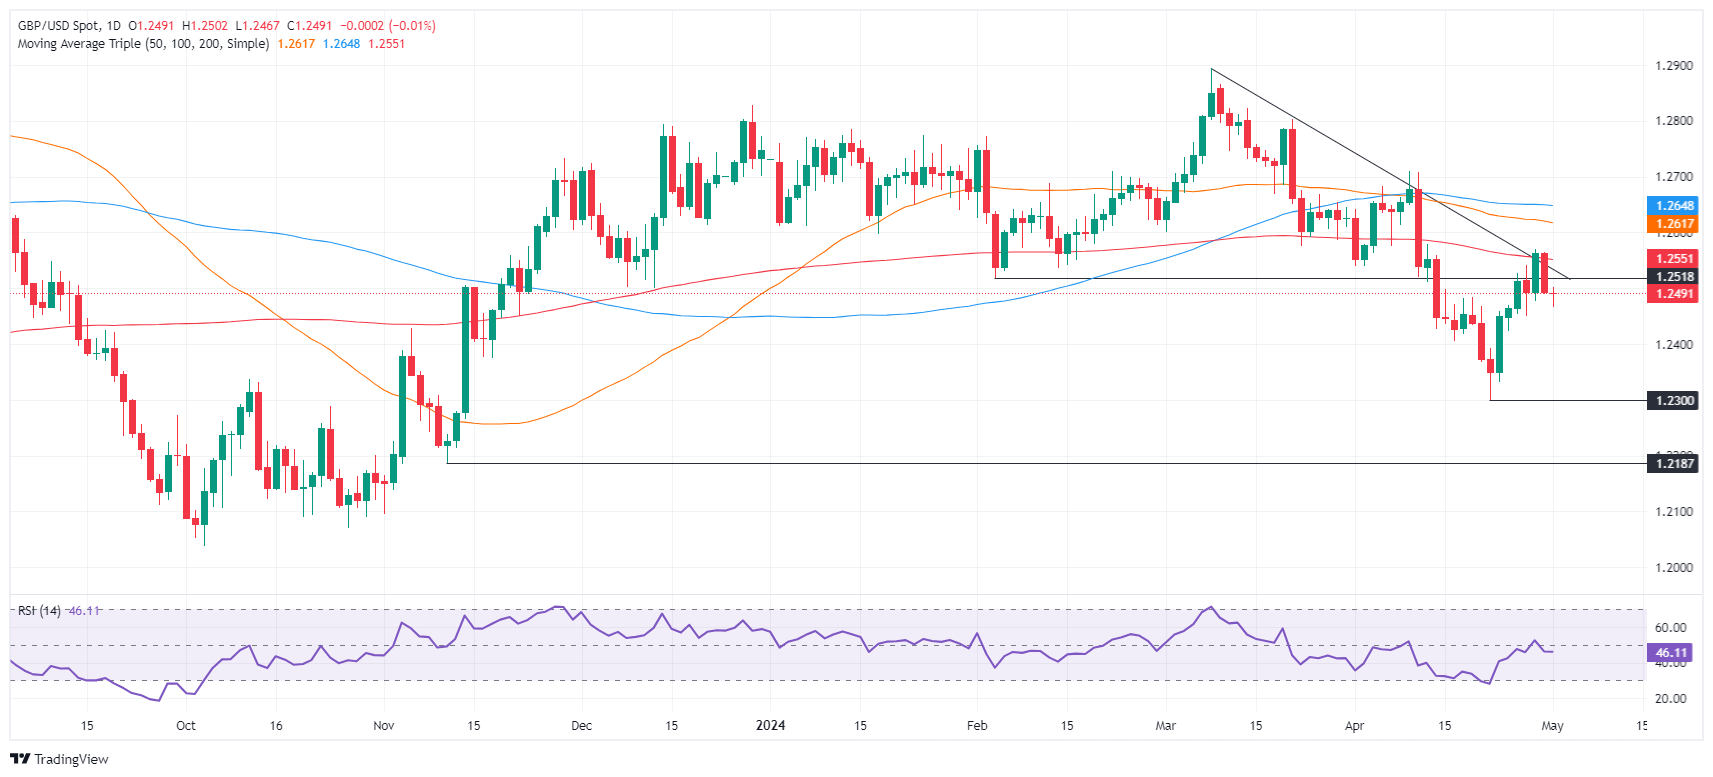
01.05.2024 14:33GBP/USD Price Analysis: Wavers below 1.2500 as bearish harami looms
- GBP/USD remains steady, slightly down by 0.05% following mixed US PMI data from S&P Global and ISM.
- The two-candle chart pattern, the bearish harami suggests further downside is seen.
- Key support levels lie at the April 29 low of 1.2474 could lead to retesting the yearly low at 1.2299.
The Pound Sterling is virtually unchanged against the US Dollar following the release of mixed Purchasing Managers Index (PMI) data from S&P Global and the Institute for Supply Management (ISM). The data showed that the economy is slowing down, amid higher interest rates set by the Federal Reserve. The GBP/USD seesaws around 1.2486, down 0.05%.
GBP/USD Price Analysis: Technical outlook
The GBP/USD remains downward biased despite registering an upward impulse that lifted the exchange rate from yearly lows of 1.2299 to April’s high of 1.2569. the advance was capped by strong resistance provided by the 200-day moving average (DMA) at 1.2552, triggering a two-candle bearish formation – bearish harami. This pattern needs a confirmation past the April 29 low of 1.2474, which would exacerbate a test of the latest swing low of 1.2299.
On the other hand, if buyers achieve a daily close above 1.2500, subsequent gains are seen if they challenge the 200-DMA. Once surpassed, the next stop would be the 1.2600 mark.
GBP/USD Price Action – Daily Chart
-
30.04.2024 23:19GBP/USD holds below 1.2500 ahead of Fed rate decision
- GBP/USD trades on a weaker note near 1.2490 on Wednesday.
- US Fed is anticipated to hold rates steady in its 5.25%–5.50% range for the sixth straight meeting on Wednesday.
- The dovish remarks of the BoE weigh on the Cable.
The GBP/USD pair holds below 1.2490 during the early Asian session on Wednesday. The downtick of the major pair is supported by the stronger US Dollar (USD) amid the cautious mood ahead of the US Federal Reserve's (Fed) interest rate decision later on Wednesday.
On Tuesday, the US Conference Board's (CB) Consumer Confidence dropped to 97.0 in April from 103.1 in the previous reading, the lowest level since July 2022. Meanwhile, the Chicago Purchasing Managers' Index fell to 37.9 in April from 41.4 in March, below the market consensus of 44.9. This figure registered the lowest level since November 2022. Finally, the US Employment Cost Index (ECI) rose by 1.2% QoQ in Q1 2024 from a 0.9% rise in Q4 of 2023, beating the estimation of 1%.
The US Fed is widely expected to hold rates steady for the sixth straight meeting on Wednesday. JPMorgan and Goldman Sachs anticipate the first cut in July, while Wells Fargo doesn’t expect the first cut until September. Investors are now pricing in nearly 44% odds that the Fed will cut the rate in September, down from 60% at the beginning of the week, according to the CME FedWatch Tool. Market players will take more cues from Fed Chair Jerome Powell's Press Conference. The hawkish tone from the Fed might boost the Greenback and weigh on the GBP/USD pair.
On the other hand, the dovish stance of the Bank of England (BoE) exerts some selling pressure on the Pound Sterling (GBP). BoE Governor Andrew Bailey is confident about cooling down inflation in the UK and sees market expectations for two or three rate cuts this year. Financial markets have priced in the first rate cut from the BoE in August, with 50 basis points (bps) expected. -
30.04.2024 14:57GBP/USD Price Analysis: Drops below 200-DMA, at cross-roads to resume downtrend
- GBP/USD declines 0.36% from its daily peak, under pressure from indications of rising US inflation.
- The pair struggles above the 200-day moving average at 1.2564, hinting at potential further declines.
- Support levels are seen at: November 14, 2023, high of 1.2506; breaching this could lead to further support tests at 1.2448 and the year-to-date low of 1.2299.
- A recovery above the 200-DMA could reignite bullish momentum, aiming for 1.2600, with additional resistance at the 50-DMA and 100-DMA at 1.2619 and 1.2645.
The Pound Sterling reverses its course against the US Dollar, after extending its gains past the 200-day moving average (DMA). However, data from the United States (US), showing that inflation could be picking up, as shown by the Employment Cost Index (ECI), bolstered the Greenback. Therefore, the GBP/USD trades at 1.2517 down by some 0.36%, after hitting a daily high of 1.2563.
GBP/USD Price Analysis: Technical outlook
The GBP/USD is neutral biased, though failure to cling above the 200-DMA at 1.2564 might open the door for a pullback, with traders eyeing a test of the November 14, 2023, high at 1.2506. In the event of a drop below that level, further downside is seen at the April 26 intermediate support at 1.2448, before the major plunges to the year-to-date (YTD) low of 1.2299.
On the other hand, if the pair edges above the 200-DMA that would pave the way for testing 1.2600. Once surpassed, key resistance levels emerge. The 50-DMA is up next at 1.2619, followed by the 100-DMA at 1.2645. Subsequent gains are seen above those levels, exacerbating a rally toward 1.2700.
GBP/USD Price Action – Daily Chart
-
29.04.2024 23:04GBP/USD consolidates its gains above 1.2550, investors await Fed rate decision
- GBP/USD takes a breather around 1.2560 in Tuesday’s early Asian session.
- The US Fed is expected to hold rates steady at its May meeting on Wednesday.
- Investors reduce their bets on BoE rate cuts, which support the Cable.
The GBP/USD pair consolidates its gains near 1.2560 after flirting with the key 200-day SMA and three-week highs in the 1.2550-1.2560 zone during the early Asian session on Tuesday. The recovery of the major pair is supported by a falling US Dollar Index (DXY) to 105.65. On Wednesday, the Federal Open Market Committee's (FOMC) interest rate decision will take center stage ahead of the release of April’s Nonfarm Payrolls (NFP) on Friday.
The US Federal Reserve (Fed) is widely anticipated to hold rates steady at a more than two-decade high after their meeting on Wednesday. Investors will take more cues from the tone of the meeting and Chair Jerome Powell’s press conference. Financial markets expect only one Fed rate cut in 2024, below the roughly six quarter-point cuts they expected at the beginning of the year.
The recent US GDP growth numbers and hotter-than-expected inflation data might convince the Fed to hold the rate higher for longer to become confident inflation is moving toward the central bank’s 2% target. The hawkish stance of the Fed might lift the Greenback and cap the upside of the GBP/USD pair in the near term.
On the other hand, the Pound Sterling (GBP) gains traction amid mixed guidance from Bank of England (BoE) policymakers over the inflation outlook. Investors reduce their bets on BoE rate cuts, which provide some support to the Cable. In the absence of top-tier economic data releases from the UK, the USD price dynamics will continue to play a key role in influencing the GBP/USD pair.
-
29.04.2024 14:44GBP/USD Price Analysis: Climbs above 1.2500, with bulls targeting 200-DMA
- GBP/USD rises, rebounding from 1.2474 amid rumors impacting the US Dollar.
- Currently, GBP/USD tests the 200-day moving average at 1.2555, showing a neutral to slight bearish outlook.
- Breaking above the 200-DMA may target 1.2600, with potential further gains to 1.2621 and 1.2645.
- Failure to exceed the 200-DMA could prompt a retest of the 1.2500 support.
The Pound Sterling advanced sharply against the US Dollar in early trading during Monday’s North American session after hitting a daily low of 1.2474. Rumors of an intervention by Japanese authorities to propel the Japanese Yen (JPY) weighed on the Greenback, which is tumbling against most G8 FX currencies. Therefore, the GBP/USD trades at 1.2534, gaining 0.36%.
GBP/USD Price Analysis: Technical outlook
From a technical standpoint, the GBP/USD is neutral-biased, though tilted to the downside. It remains below the key 200-day moving average (DMA) at 1.2555, which delineates an asset's bullishness or bearishness. However, buyers are gathering momentum as the Relative Strength Index (RSI) punches above the 50-midline level.
With that context, if buyers achieve a daily close above the 200-DMA, that will expose the 1.2600 figure. Further upside is seen past the 50-DMA at 1.2621, followed by the 100-DMA at 1.2645. Once those levels are surpassed, the 1.2700 mark is up next.
Conversely, failure at the 200-DMA adds pressure on Sterling, which could drag the GBP/USD exchange rate beneath the 1.2500 mark. A breach of the latter will expose the April 24 low at 1.2422, followed by the April 22 low at 1.2299.
GBP/USD Price Action – Daily Chart
-
29.04.2024 01:49GBP/USD holds positive ground above 1.2500 on weaker US Dollar, Fed rate decision looms
- GBP/USD trades on a positive note around 1.2520 amid weaker USD on Monday.
- The recent US PCE inflation data dialed back their expectation of when the Federal Reserve (Fed) will start cutting interest rates.
- Investors increased their bets that the BoE will start cutting rates in June.
The GBP/USD pair holds positive ground near 1.2520 on Monday during the early Asian session. The uptick of the major pair is supported by the softer US Dollar (USD) below the 106.00 psychological mark. Investors will closely monitor the Federal Open Market Committee (FOMC) interest rate decision and Press Conference on Wednesday.
The US Federal Reserve (Fed) is expected to leave the interest rate unchanged in its current 5.25%–5.5% range on Wednesday. The US economy remains strong, and inflation has started to turn higher. On Friday, the US Bureau of Economic Analysis showed the Core Personal Consumption Expenditures (PCE) Price Index rose 2.8% YoY in March. These reports have triggered speculation that the first cut might not come until September.
The Fed policymakers noted that rate cuts are not coming in the next several months as inflation was stickier than expected and remains above the Fed’s 2% target. The higher-for-longer stance from the US central bank might provide some support to the Greenback and cap the downside of the GBP/USD pair.
On the other hand, investors raise their bets that the Bank of England (BoE) will start lowering borrowing costs in its June meeting. The BoE Governor Andrew Bailey said during the press conference after the last monetary policy meeting that two or three rate cuts this year are not "unreasonable." A dovish shift in the BoE remarks might lead to a weaker Pound Sterling (GBP) and create a headwind for the pair. -
26.04.2024 16:37GBP/USD Price Analysis: Tumbles below 1.2500 as bears cut bulls hopes short
- GBP/USD registers a decline of 0.27%, influenced by US inflation data that suggests the Federal Reserve may delay rate cuts.
- The pair's recent inability to break the 200-day moving average at 1.2557 highlights its downward bias, with support levels now in focus.
- Potential for further losses if the 'dark cloud cover' candlestick pattern forms, targeting 1.2400 and possibly extending to the YTD low of 1.2300.
During the mid-North American session, the Pound Sterling retreats and registers losses against the US Dollar, slumping below 1.2500. Data from the United States showed that inflation is picking up, which would deter Fed intentions from cutting interest rates. The GBP/USD trades at 1.2481, down 027%.
GBP/USD Price Analysis: Technical outlook
Although the GBP/USD closed three days of consecutive gains, it remains downward biased, as buyers failed to crack stir resistance at the 200-day moving average (DMA) at 1.2557. That exposed the 1.2500 figure, which was surrendered by fundamental news.
If the GBP/USD finishes Friday’s session at around the 1.2480, that will form a ‘dark cloud cover,’ opening the door for further losses. The next support would be 1.2400, followed by the year-to-date (YTD) at 1.2300.
On the other hand, if buyers lift the spot price above 1.2500, that would open the door to challenge the 200-DMA.
GBP/USD Price Action – Daily Chart
-
26.04.2024 00:31GBP/USD trades on a softer note below 1.2530 ahead of US PCE data
- GBP/USD snaps the three-day winning streak near 1.2502 in Friday’s early Asian session.
- The US economy grew at a slower pace of 1.6% in Q1 2024, compared to 3.4% in the previous reading.
- The expectation that the BoE will cut rates before the US Fed might exert some selling pressure on the GBP.
The GBP/USD pair trades on a weaker note around 1.2502 during the early Asian trading hours on Friday. The modest rebound of the US Dollar (USD) weighs on the major pair despite weaker US GDP growth numbers. The US Personal Consumption Expenditures (PCE) Price Index data on Friday will be in the spotlight.
On Thursday, the US economy grew at a slower pace of 1.6% in the first quarter (Q1) of 2024, compared to 3.4% in the previous reading. This figure came in weaker than the market expectation of 2.5%. However, prices have remained sticky, with the data on Thursday revealing the Personal Consumption Expenditures Price Index in Q1 climbing at a 3.4% annual rate, above the Fed's 2% target. The Greenback has dropped to two-week lows near mid-105.00 after the release of weaker-than-expected Q1 GDP growth and a hotter-than-expected inflation reading.
According to the CME FedWatch tool, financial markets have priced in less than 10% odds that the US Federal Reserve (Fed) will cut interest rates in June, while the probability of a September rate cut dropping below 58%. Investors will take more cues from another inflation report on Friday. The US PCE is expected to show an increase of 0.3% MoM in both headline and core PCE figures. On an annual basis, the headline PCE and Core PCE figures are estimated to show a rise of 2.6% and 2.7% YoY, respectively.
On the GBP’s front, the Bank of England (BoE) Governor Andrew Bailey and other BoE policymakers stated that inflation in the United Kingdom dropped in line with the central bank's expectations and the risk of elevated inflation had reduced, paving the way for a rate cut. The market anticipates that the UK central bank will wait until next quarter to lower borrowing costs, and it will begin before the US Fed. This, in turn, might cap the upside of the Pound Sterling (GBP).
-
25.04.2024 19:43GBP/USD Price Analysis: Extends recovery above 1.2500, but bears loom around 200-DMA
- GBP/USD gains over 0.40%, rebounding from daily lows after US Q1 economic growth underperforms expectations.
- Mixed signals from the US economy support Sterling's rise.
- Technical outlook: Key resistance at 1.2559 with potential to target April 9 high at 1.2709 if upward momentum continues.
The Pound Sterling resumed its advance against the US Dollar, climbing more than 0.40% and trading at 1.2518. During the day, the GBP/USD bounced off daily lows of 1.2450 following the release of mixed economic data from the United States. The US economy in Q1 2024 grew below estimates, which would warrant easing monetary policy. But prices edging up spurred investors' reaction to priced-out rate cuts in 2024.
GBP/USD Price Analysis: Technical outlook
The GBP/USD is aiming up sharply, though it remains bearishly biased. Although the major remains far from the latest cycle high, if buyers regain some key resistance levels, that would ultimately expose the April 9 high at 1.2709, the latest cycle high.
Therefore, the GBP/USD first resistance would be the 200-day moving average (DMA) at 1.2559. A breach of the latter will expose the 1.2600 figure, followed by the 50 and 100-DMAs, each a 1.2624 and 1.2647. Once those levels are surpassed, the April 9 high would be up next.
On the other hand, if GBP/USD slumps below 1.2500, that would keep the downtrend intact and pave the way to re-test the year-to-date (YTD) low of 1.2299.
GBP/USD Price Action – Daily Chart
-
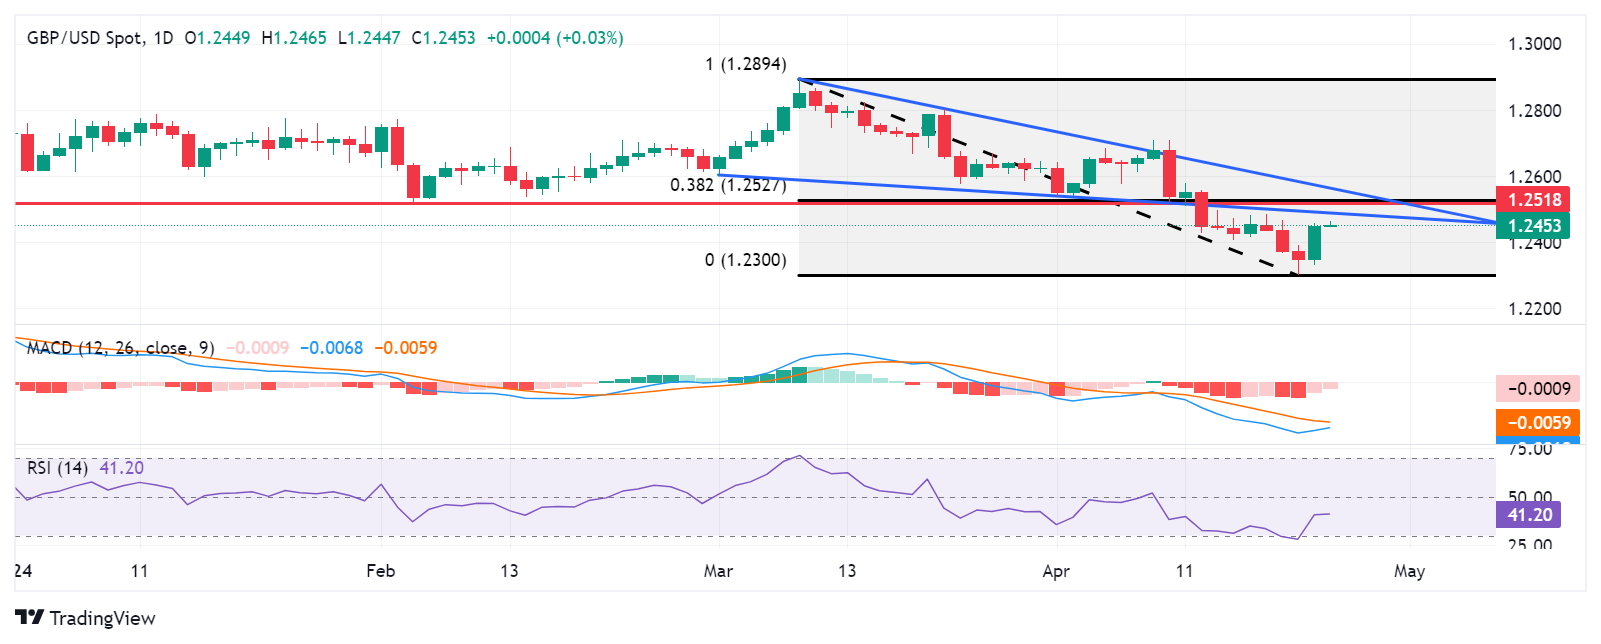
25.04.2024 04:44GBP/USD Price Analysis: Acceptance above 23.6% Fibo. favors bulls ahead of US Q1 GDP
- GBP/USD struggles to attract follow-through buying and trades in a narrow range on Thursday.
- Reduced Fed rate cut bets and speculations about more aggressive BoE easing act as a headwind.
- The technical setup warrants some caution before positioning for any further appreciating move.
The GBP/USD pair consolidates its strong recovery gains registered over the past two days, from the 1.2300 mark or the YTD low set earlier this week and oscillates in a range during the Asian session on Thursday. Spot prices currently trade near the 1.2465 region, unchanged for the day as traders await more cues about the Federal Reserve's (Fed) rate-cut path before placing fresh directional bets.
Hence, the focus will remain glued to important US macro data – the Advance Q1 GDP report later today and the Personal Consumption Expenditures (PCE) Price Index on Friday. In the meantime, expectations that the Fed will delay cutting interest rates in the wake of sticky inflation continue to act as a tailwind for the US Dollar (USD). Apart from this, speculations about more aggressive policy easing by the Bank of England (BoE) undermine demand for the British Pound (GBP) and act as a headwind for the GBP/USD pair.
From a technical perspective, acceptance above the 23.6% Fibonacci retracement level of the March-April downfall favors bullish traders and supports prospects for a further appreciating move. Hence, some follow-through strength beyond the 1.2500 psychological mark, en route to the 1.2530-1.2535 region or the 38.2% Fibo. level, looks like a distinct possibility. That said, oscillators on the daily chart are still holding in the negative territory, suggesting that the latter should act as a headwind and cap the upside for the GBP/USD pair.
On the flip side, the 1.2425 area now seems to protect the immediate downside ahead of the 1.2400 round figure. Some follow-through selling could drag the GBP/USD pair back towards the 1.2350 intermediate support en route to the 1.2300 mark, or the YTD low touched on Tuesday. A convincing break below the latter will be seen as a fresh trigger for bearish traders and pave the way for an extension of the recent downtrend from the March swing high. Spot prices might then slide to the 1.2245 area before dropping to the 1.2200 mark.
GBP/USD daily chart
-
24.04.2024 23:05GBP/USD snaps the two-day winning streak above 1.2450, eyes on US GDP data
- GBP/USD trades on a weaker note around 1.2460 in Thursday’s early Asian session.
- The US Durable Goods Orders rose 2.6% in March, compared to the 0.7% increase (revised from 1.4%) in February.
- The BoE is expected to wait until next quarter to lower borrowing costs, according to analysts from a Reuters poll.
- The US advanced Q1 GDP growth numbers will be in the spotlight on Thursday.
The GBP/USD pair snaps the two-day winning streak near 1.2460 amid the modest rebound of the US Dollar (USD) on Thursday during the early Asian session. The release of the US Gross Domestic Product (GDP) for the first quarter (Q1) will take center stage on the day. Also, the usual weekly Initial Jobless Claims and Pending Home Sales will be due.
On Wednesday, US Durable Goods Orders improved by 2.6%, or $7.3 billion, to $283.4 billion in March, compared to the 0.7% increase (revised from 1.4%) in February. The increase in overall orders was the biggest since November 2023, according to the US Census Bureau. Meanwhile, Durable Goods Orders ex-transportation increased by 0.2%, while new orders excluding defense rose 2.3% in March. Both figures came in weaker than expected. Nonetheless, these reports did not have a significant impact on the US Dollar Index (DXY).
Several US Federal Reserve (Fed) officials and Fed Chair Jerome Powell emphasized that rate cuts aren’t coming in the coming months as inflation remains stickier than expected. The hawkish comments and the higher-for-longer stance from US Federal Reserve (Fed) officials have boosted the Greenback and created a headwind for the GBP/USD pair.
On the other hand, the markets anticipate that the Bank of England (BoE) will wait until next quarter to lower borrowing costs, according to median forecasts in a Reuters poll. The BoE Governor Andrew Bailey and other BoE officials stated that inflation in the United Kingdom declined in line with the central bank's expectations and the risk of elevated inflation had reduced, paving the way for a rate cut. The speculation is that the UK Central Bank will begin its easing cycle before the US Fed drags the Pound Sterling (GBP) lower and caps the downside of the major pair. -
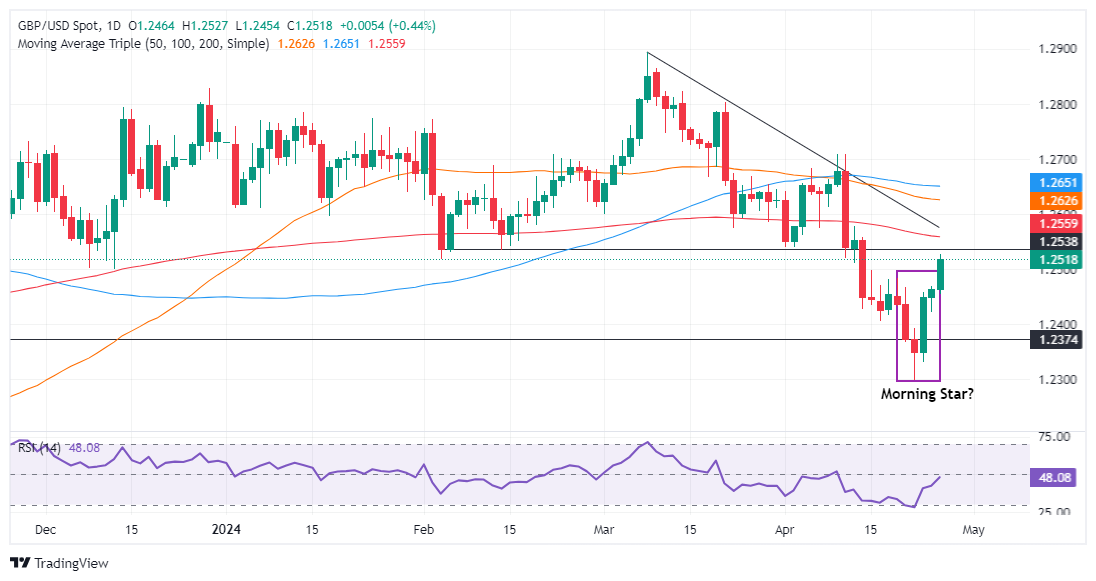
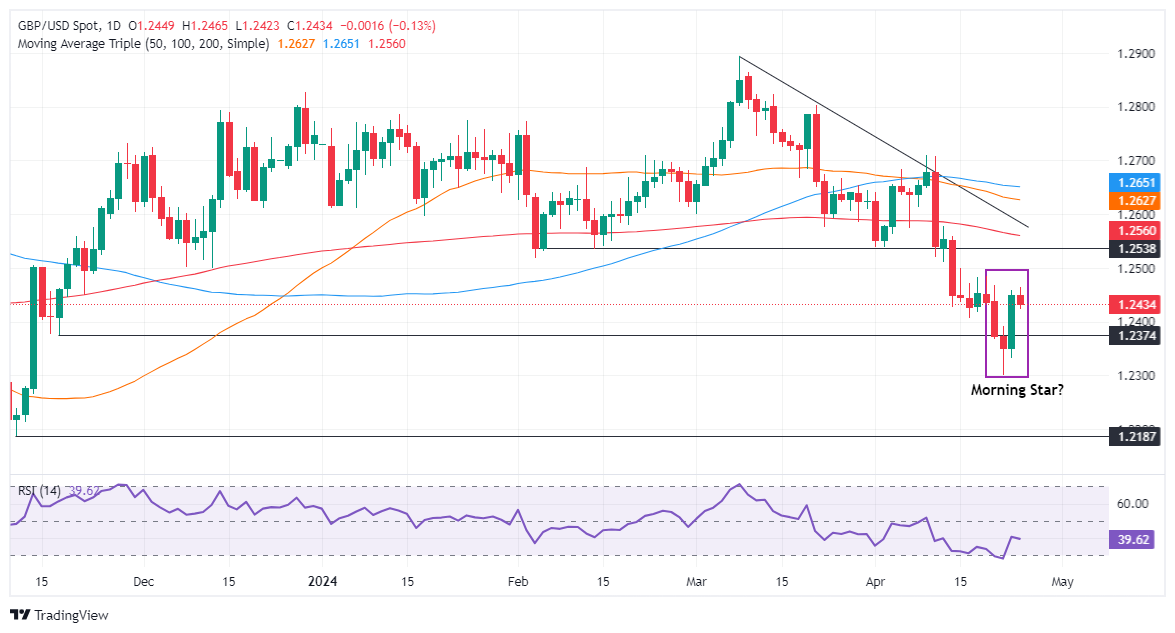
24.04.2024 14:47GBP/USD Price Analysis: Poised to resume downtrend, despite ‘morning star’ formation
- GBP/USD dips slightly as higher US Treasury yields bolster the US Dollar, following upbeat US data.
- Technical analysis shows GBP/USD at a pivotal point, with the potential to rise toward 1.2500 if it breaks past the April 23 high of 1.2458.
- Key downside risks include a retreat to 1.2400 and possibly further to the April 22 low of 1.2299 if current resistance holds firm.
The Pound Sterling is experiencing slight losses against the US Dollar, largely due to the influence of high US Treasury yields that are bolstering the Greenback. This trend was fueled by the release of economic data, which showed that Durable Goods exceeded expectations, leading to a surge in US yields and a favorable environment for the USD. The GBP/USD is currently trading at 1.2444, reflecting a 0.04% decrease.
GBP/USD Price Analysis: Technical outlook
After forming a ‘morning star,’ the GBP/USD is set to continue to print gains, but traders must decisively clear the April 23 high at 1.2458, which would pave the way toward 1.2500. Up next, the first crucial resistance level would be the 200-day moving average (DMA) at 1.2561, followed by 1.2600.
On the other hand, if GBP/USD remains constrained by the April 23 high, that could pave the way for a retracement to 1.2400. A decisive break would expose April 22 low at 1.2299, which, once surpassed, could open the door to test an upslope support trendline drawn from March 2023 lows that pass at around 1.2250/60.
GBP/USD Price Action – Daily Chart
-
24.04.2024 05:10GBP/USD Price Analysis: Rises to near 1.2450 despite the bearish sentiment
- GBP/USD tests the major level of 1.2450 despite the bearish sentiment shown by the technical analysis.
- The pair continues to trade below the pullback resistance level at 1.2518, positioned near the lower boundary of the descending triangle.
- The breach into the descending channel around the level of 1.2490 may lead to a weakening of the bearish sentiment.
GBP/USD has been on the rise for the second consecutive day, trading around 1.2450 in Asian trading on Wednesday. However, the pair is still below the pullback resistance at 1.2518, which coincides with the lower boundary of the descending triangle at 1.2510. Furthermore, the 14-day Relative Strength Index (RSI) is below the 50 level, indicating a bearish sentiment.
Additionally, the Moving Average Convergence Divergence (MACD) confirms this bearish trend, with the MACD line below the centerline and the signal line. Looking ahead, GBP/USD could encounter significant support around the psychological level of 1.2400. If this level is breached, the pair may test the five-month low of 1.2300.
On the upside, breaching the descending triangle around the level of 1.2490, along with surpassing the psychological level of 1.2500, could potentially weaken the bearish sentiment. Further resistance is anticipated around the pullback resistance level at 1.2518 and the 38.2% Fibonacci retracement level at 1.2527, drawn between 1.2894 and 1.2300.
A breakthrough above the latter resistance region might signify a shift towards a bullish sentiment. In such a scenario, GBP/USD could aim to test the upper boundary of the descending triangle around 1.2565.
GBP/USD: Daily Chart
-
23.04.2024 23:14GBP/USD posts modest gains above 1.2450, BoE policymaker dampens hopes of summer rates cut
- GBP/USD trades on a stronger note near 1.2450 amid softer USD on Wednesday.
- US flash S&P Global Manufacturing and Services PMI came in weaker than expectations in April.
- BoE’s Pill said inflation must be squeezed out of the UK economy and cautioned against cutting too soon.
The GBP/USD pair recovers to 1.2450 on Wednesday during the early Asian session. The downbeat US April PMI data and increasing appetite for the risk-linked space exert some selling pressure on the US Dollar (USD). Later in the day, the US Durable Goods Orders and weekly Mortgage Applications will be released.
Business activity in the United States slowed in April to a four-month low owing to lower demand, according to the S&P Global report on Tuesday. The flash Manufacturing PMI came in weaker than the expectation, dropping to 49.9 in April from 51.9 in the previous reading. Meanwhile, the Services PMI declined to 50.9 from 51.7, below the market consensus of 52.0. Finally, the Composite PMI, which tracks both the manufacturing and services sectors, fell to 50.9 in April from 52.1 in March. The Greenback has attracted some sellers in response to the US economic data.
The Federal Reserve (Fed) officials look for signs that the economy is ebbing enough to bring inflation down further, even though the data in recent weeks showed hotter-than-expected inflation and employment readings. The US central bank will schedule the monetary policy meeting next week, and markets expect the Fed to leave its policy rate unchanged in the current 5.25%–5.50% range. Several Fed policymakers signaled at least one rate cut this year and indicated that monetary policy needs to be restrictive for longer. This, in turn, continues to lift the USD and cap the upside of GBP/USD.
On the other hand, the speculation that the Bank of England (BoE) will cut interest rates in summer declined as the UK chief economist reiterated the need for “restrictive” monetary policy. On Tuesday, BoE Chief Economist Huw Pill said that easing in headline inflation was not enough of a reason to ease policy, adding that there were greater risks from cutting the rates too quickly, rather than too late. These comments provide some support to the Pound Sterling (GBP) against the USD.


© 2000-2024. All rights reserved.
This site is managed by Teletrade D.J. LLC 2351 LLC 2022 (Euro House, Richmond Hill Road, Kingstown, VC0100, St. Vincent and the Grenadines).
The information on this website is for informational purposes only and does not constitute any investment advice.
The company does not serve or provide services to customers who are residents of the US, Canada, Iran, The Democratic People's Republic of Korea, Yemen and FATF blacklisted countries.
Making transactions on financial markets with marginal financial instruments opens up wide possibilities and allows investors who are willing to take risks to earn high profits, carrying a potentially high risk of losses at the same time. Therefore you should responsibly approach the issue of choosing the appropriate investment strategy, taking the available resources into account, before starting trading.
Use of the information: full or partial use of materials from this website must always be referenced to TeleTrade as the source of information. Use of the materials on the Internet must be accompanied by a hyperlink to teletrade.org. Automatic import of materials and information from this website is prohibited.
Please contact our PR department if you have any questions or need assistance at pr@teletrade.global.
transfers