- Analytics
- News and Tools
- Quotes
- Chart and quotes for AUDJPY
CFD Trading Rate Australian Dollar vs Japanese Yen (AUDJPY)
| Date | Rate | Change |
|---|
Related news
-
02.02.2024 11:59AUD/JPY edges higher to near 96.80 after rebounding from two-month lows, US NFP eyed
- AUD/JPY recovers from a two-month low at 95.50 recorded on Thursday.
- A Reuters Poll expects RBA to maintain its current interest rate of 4.35% in the February meeting.
- The previous week’s foreign investment might have supported the Japanese Yen.
AUD/JPY continues to gain ground, recovering from the two-month low at 95.50 observed in the previous session. The cross trades higher around 96.80 during the European session on Friday. The Australian Dollar (AUD) has found support from an improved Australian money market, contributing to the strength of the AUD/JPY cross.
Furthermore, the better-than-expected Producer Price Index (PPI) data from Australia underpinned the Aussie Dollar, subsequently underpinning the AUD/JPY cross. The Australian Bureau of Statistics has released the PPI (YoY) for the fourth quarter, reporting an improvement with a growth rate of 4.1%, surpassing the previous growth of 3.8%.
On Thursday, a Reuters Poll showed an expectation that the Reserve Bank of Australia (RBA) could maintain the current interest rate of 4.35% in its upcoming February meeting. Furthermore, former RBA board member Warwick McKibbin suggested that the Australian cash rate may remain around 4.5% for an extended period.
The Australian Dollar has faced challenges, as bond traders have increased their expectations of early interest rate cuts by the Reserve Bank of Australia (RBA) following an unexpectedly weak quarterly inflation report. Futures markets are fully pricing in 50 basis points reductions in 2024, with the first adjustment anticipated in August.
The Bank of Japan's (BoJ) hawkish stance has provided support for the Japanese Yen (JPY). Additionally, the escalated geopolitical tensions in the Middle East might have driven the investors towards the safe-haven Japanese Yen, consequently capping the advances of the AUD/JPY cross.
The Japanese Yen might have gained support from the influx of foreign investment. For the week ending January 26, Foreign Bond Investment in Japan recorded inflows of ¥382.9 billion, a significant turnaround from the previous week's outflows of ¥43.5 billion. Additionally, Foreign Investment in Japanese Stocks rebounded during the same week, rising to ¥720.3 billion compared to the previous week's ¥287 billion.
-
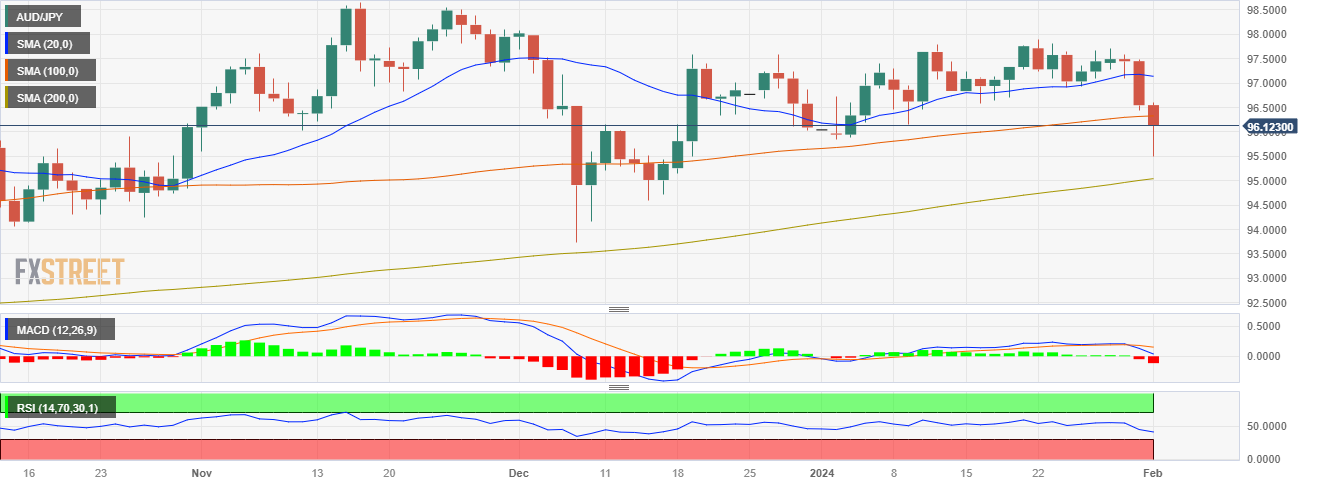
01.02.2024 19:41AUD/JPY Price Analysis: Slips below the 100-day SMA, outlook turns negative
- The AUD/JPY is experiencing a downward shift at 96.18, seeing a 0.23% loss.
- Indicators on the daily chart show a negative outlook as the cross now trades below the 20 and 100-day SMA.
- Four-hour chart indicators are consolidating after hitting oversold conditions.
On Thursday's session, the AUD/JPY experienced a downturn, hovering at 96.18 after hitting a its lowest level since mid December near 95.50. The daily chart conveys a bearish hue with the sellers gaining substantial ground. Meanwhile, the four-hour chart indicators seem to have enter in a consolidation phase, following a dip into oversold territories.
In the daily chart perspective, the leading indicators signal an inclined selling momentum. The Relative Strength Index (RSI) is charting a downward trajectory indicating bearish strength, especially within a negative zone. This is echoed by the Moving Average Convergence Divergence (MACD) which prints a surge in red bars, indicating increasing bearish pressure. Furthermore, the cross fell below the 100-day Simple Moving Average (SMA), a strong resistance which strengthens the case for the sellers .
Inspecting the shorter-term dynamics from the four-hour chart, it appears the bearish tendency seems to be leveling off. Indicators have moved to a stable phase after previously registering oversold conditions. The RSI in particular, maintains a flat formation in a negative territory, indicating a momentary pause in downward momentum. Additionally, the MACD also show flat red bars indicating growth in short-term selling pressure, though at a decreasing rate.
AUD/JPY daily chart
AUD/JPY levels to watch
-
01.02.2024 04:41AUD/JPY drops to four-week low, bears look to seize control below 100-day SMA
- AUD/JPY drifts lower for the third straight day and seems vulnerable to sliding further.
- Softer domestic inflation lifts August RBA rate cut bets and undermines the Aussie.
- The BoJ’s hawkish tilt, along with geopolitics, benefits the JPY and exerts pressure.
The AUD/JPY cross remains under some selling pressure for the third straight day on Thursday and drops to a nearly one-month low, during the Asian session. Spot prices currently trade around the 96.20-96.15 area, with bears now looking to extend the downward trajectory further below the 100-day Simple Moving Average (SMA).
The Australian Dollar (AUD) continues to be undermined by softer domestic consumer inflation figures released on Wednesday, which reaffirmed expectations that the Reserve Bank of Australia's (RBA) tightening cycle is over. In contrast, the Bank of Japan (BoJ) last week signalled that conditions for phasing out huge stimulus and pulling short-term rates out of negative territory were falling into place. This, along with the risk of a major escalation of geopolitical tensions in the Middle East, turns out to be a key factor behind the safe-haven Japanese Yen's (JPY) relative outperformance and exerts downward pressure on the AUD/JPY cross.
Bulls, meanwhile, seem rather unimpressed by a private-sector survey, which showed that China's factory activity expanded at a steady pace for the third straight month in January. In fact, China's Caixin Manufacturing PMI remains unchanged at 50.8 in January as compared to market expectations for a downtick to 50.6. This, however, does little to benefit the China-proxy Aussie. Apart from this, weakness below the 100-day SMA suggests that the path of least resistance for the AUD/JPY cross is to the downside. Hence, a subsequent decline back towards retesting the YTD trough, around the 95.85 region, now looks like a distinct possibility.
Technical levels to watch


© 2000-2024. All rights reserved.
This site is managed by Teletrade D.J. LLC 2351 LLC 2022 (Euro House, Richmond Hill Road, Kingstown, VC0100, St. Vincent and the Grenadines).
The information on this website is for informational purposes only and does not constitute any investment advice.
The company does not serve or provide services to customers who are residents of the US, Canada, Iran, The Democratic People's Republic of Korea, Yemen and FATF blacklisted countries.
Making transactions on financial markets with marginal financial instruments opens up wide possibilities and allows investors who are willing to take risks to earn high profits, carrying a potentially high risk of losses at the same time. Therefore you should responsibly approach the issue of choosing the appropriate investment strategy, taking the available resources into account, before starting trading.
Use of the information: full or partial use of materials from this website must always be referenced to TeleTrade as the source of information. Use of the materials on the Internet must be accompanied by a hyperlink to teletrade.org. Automatic import of materials and information from this website is prohibited.
Please contact our PR department if you have any questions or need assistance at pr@teletrade.global.
transfers