- Analytics
- News and Tools
- Quotes
- Chart and quotes for AUDJPY
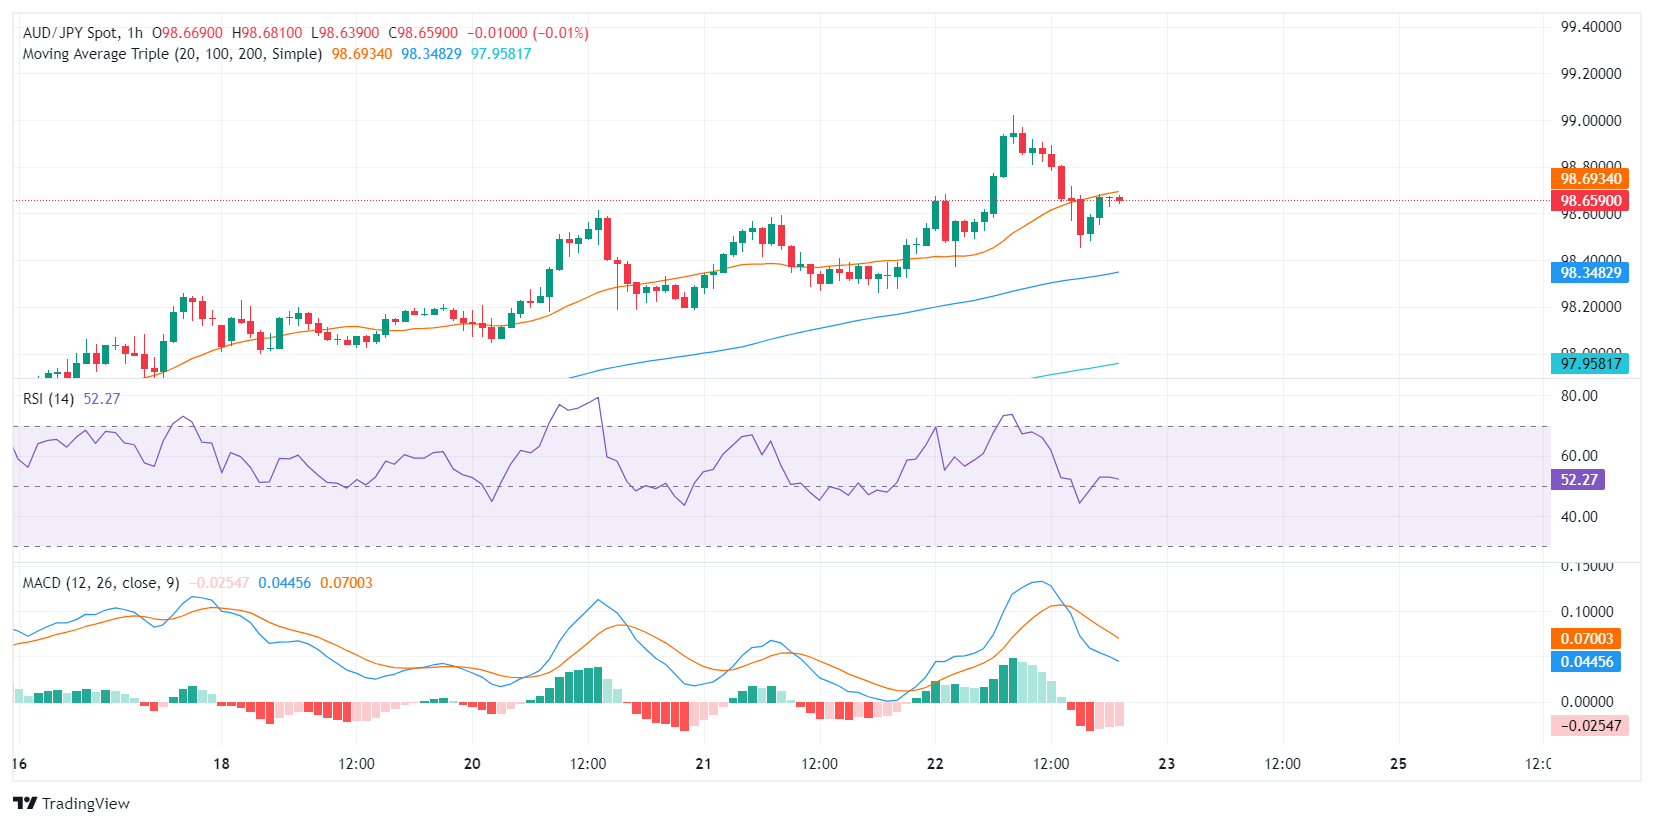
CFD Trading Rate Australian Dollar vs Japanese Yen (AUDJPY)
| Date | Rate | Change |
|---|
Related news
-
13.03.2024 09:04AUD/JPY expands gains after recovering intraday losses, stretches higher to near 97.70
- AUD/JPY extends its gains for the second successive session on Wednesday.
- Australia's ASX 200 tracked the Wall Street gains overnight, shrugging off the stronger US Inflation data.
- Japanese firms have agreed to the demands for pay hikes of 5.85% in 2024.
AUD/JPY reverses its intraday losses and trades in positive territory for the second consecutive day on Wednesday, reaching levels near 97.70 during the European session. The AUD/JPY cross initially faced challenges during the Asian trading hours as the Japanese Yen (JPY) strengthened on market speculation suggesting that the Bank of Japan (BoJ) is considering an interest rate hike in March.
Moreover, the outcome of Japan's spring wage negotiations reveals that most firms have agreed to the wage rise demands put forth by the trade unions. Additionally, Japan's Chief Cabinet Secretary Yoshimasa Hayashi expressed his desire to witness widespread wage hikes across the economy.
Bank of Japan (BoJ) Governor Kazuo Ueda mentioned scrutinizing the wage talk outcome, as well as other data and information from our hearings, in making policy decisions. Ueda will consider tweaking the negative rate, YCC, and other monetary easing tools if the sustained achievement of our price target comes into sight.
The Australian Dollar (AUD) received upward support on Wednesday on higher S&P/ASX 200 Index, which has risen for the second consecutive day, following gains on Wall Street overnight. However, lower commodities' prices might have put pressure on the Aussie Dollar.
Concerns about a decrease in demand from China have led to a decline in iron ore futures. Additionally, there has been an increase in maintenance activities on blast furnaces among mills this week, indicating a potential decline in hot metal output.
-
12.03.2024 18:00AUD/JPY Price Analysis: Bulls recover traction, recovery may be incoming
- The selling pressure dominates the daily chart, but indicators recovered on Tuesday.
- The hourly chart also depicts an improvement hinting at a potential recovery.
- With the operating above key SMAs, a longer-term bullish sentiment could potentially override recent bearish tendencies.
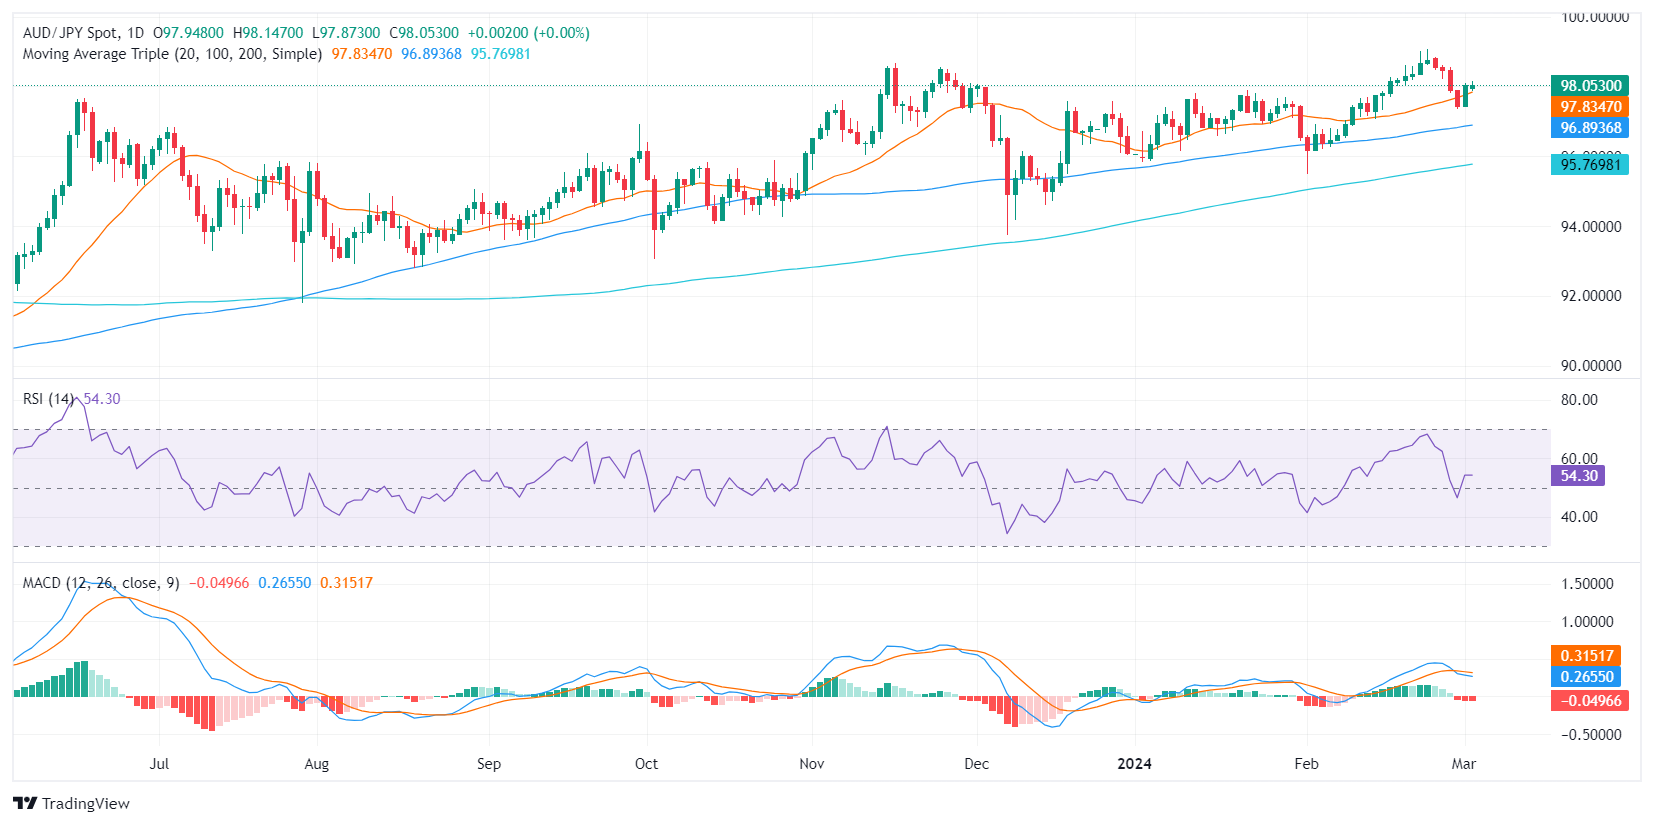
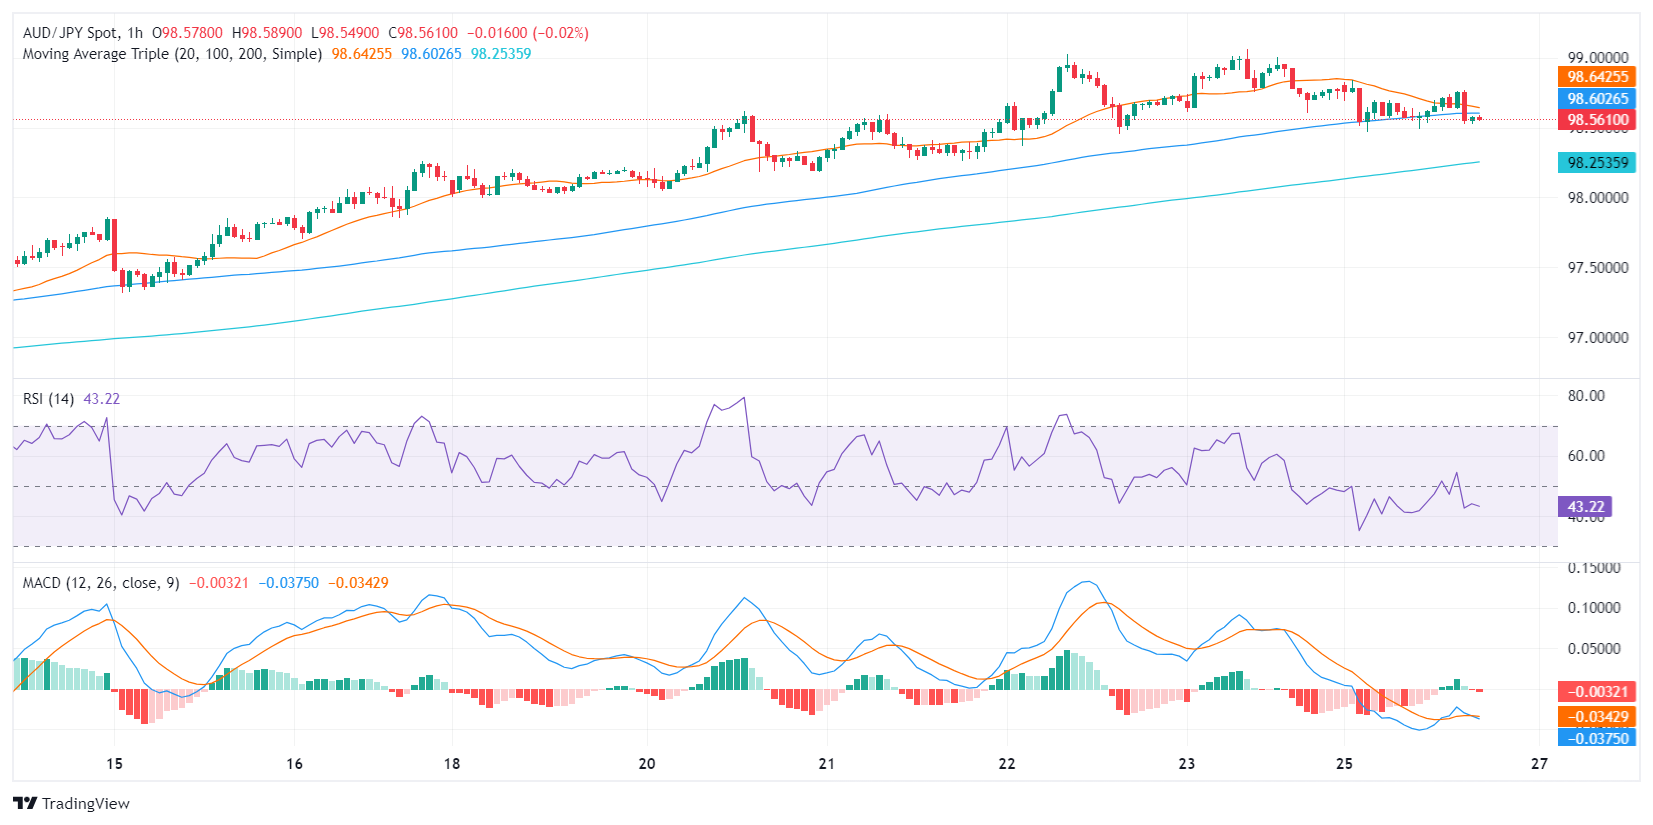
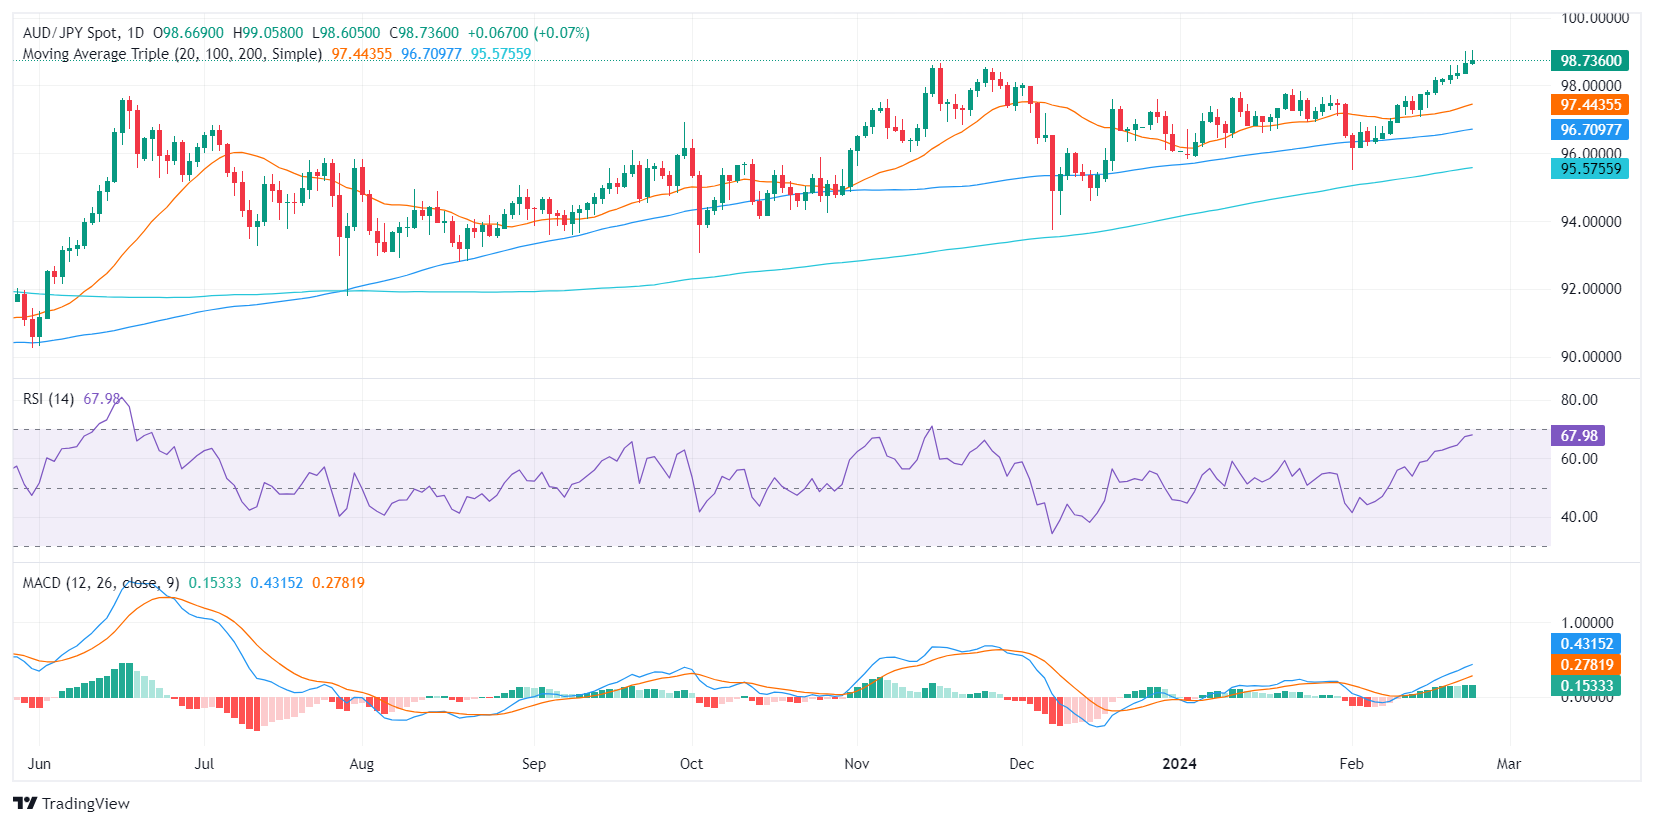
The AUD/JPY pair is trading at 97.477, showing a gain of 0.31%. Despite the gains, selling pressure seems to dominate in the short term but the overall trend remains bullish. Indicators are improving in the hourly chart.
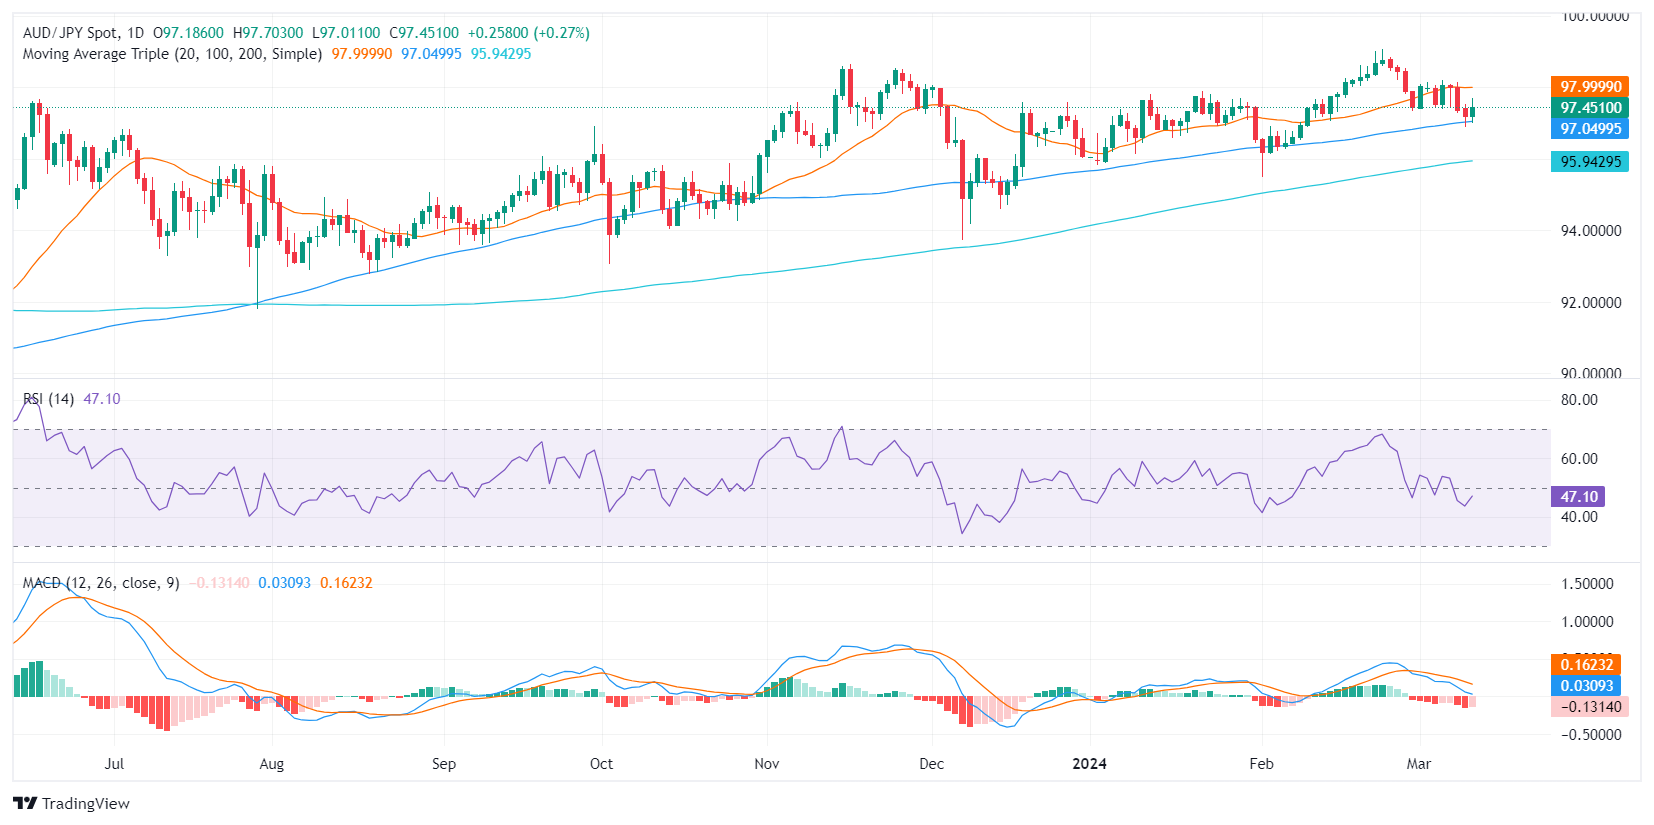
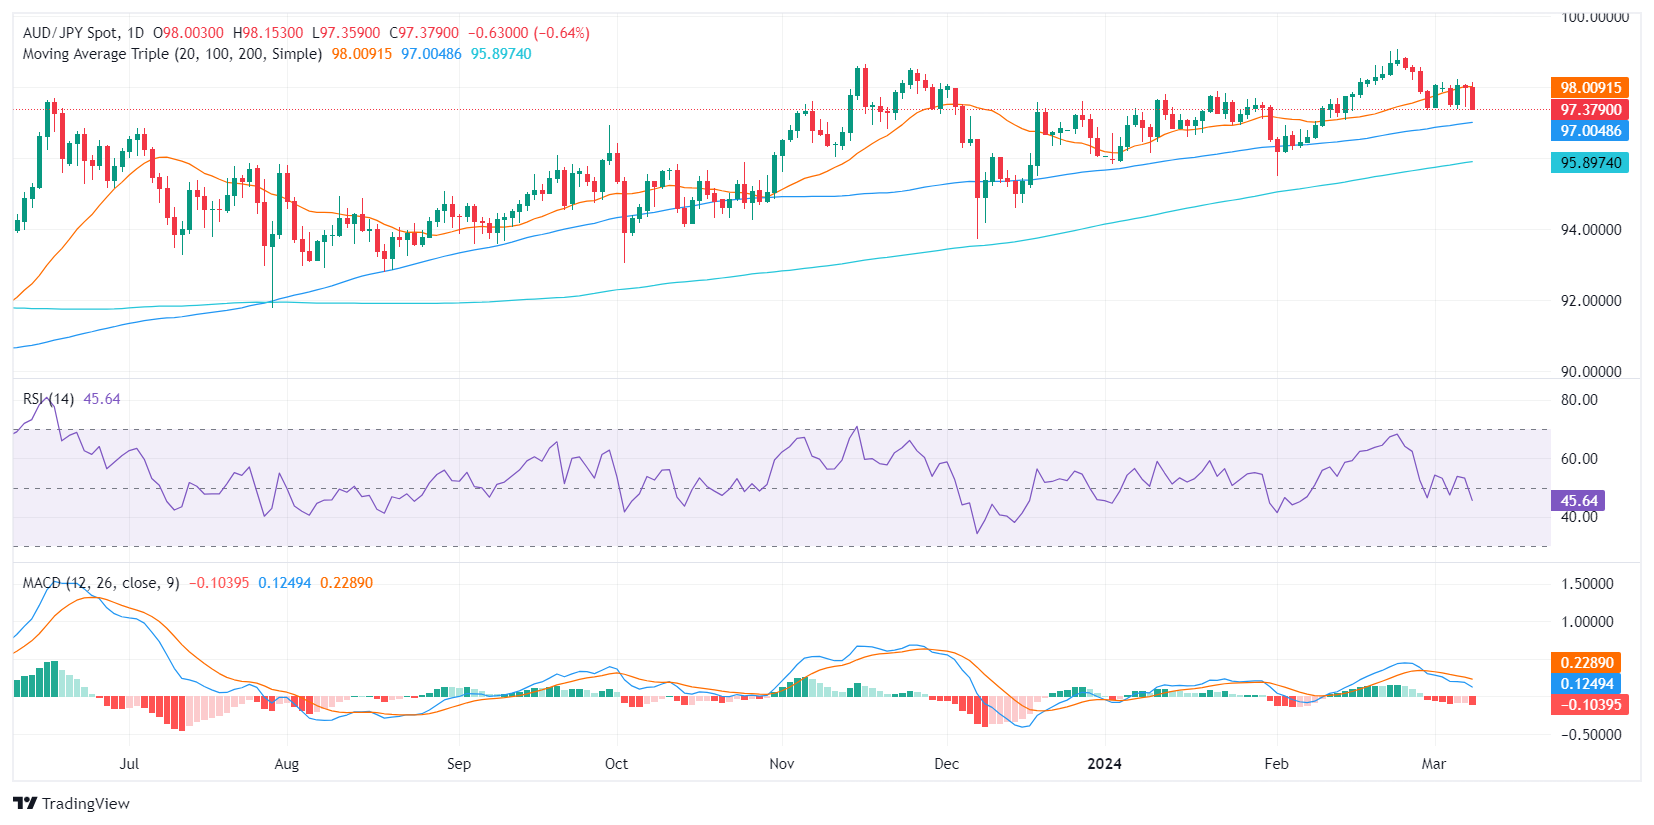
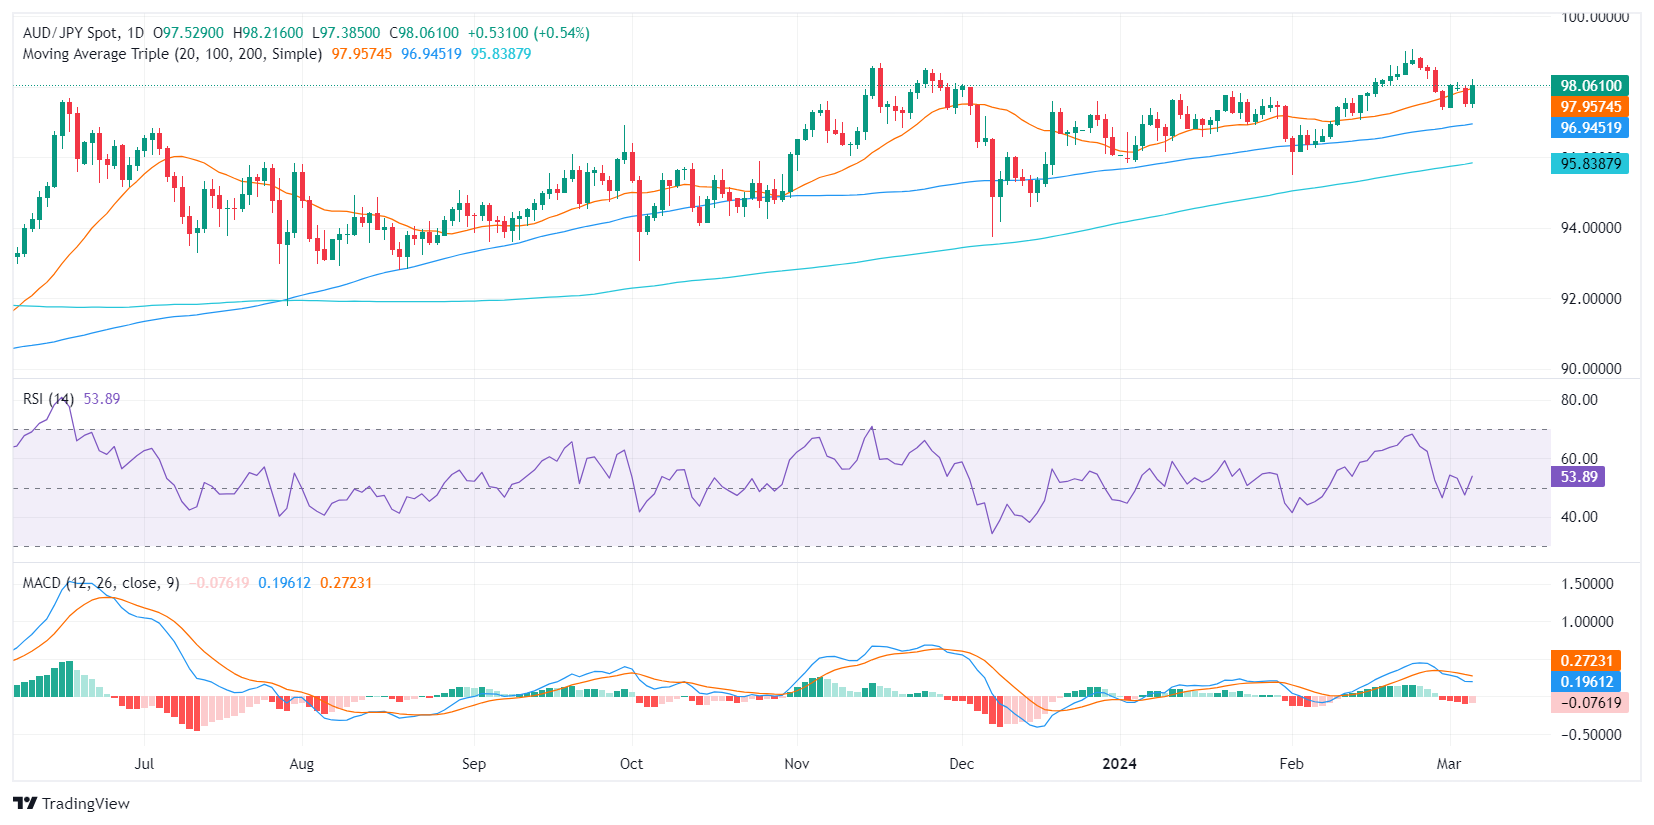
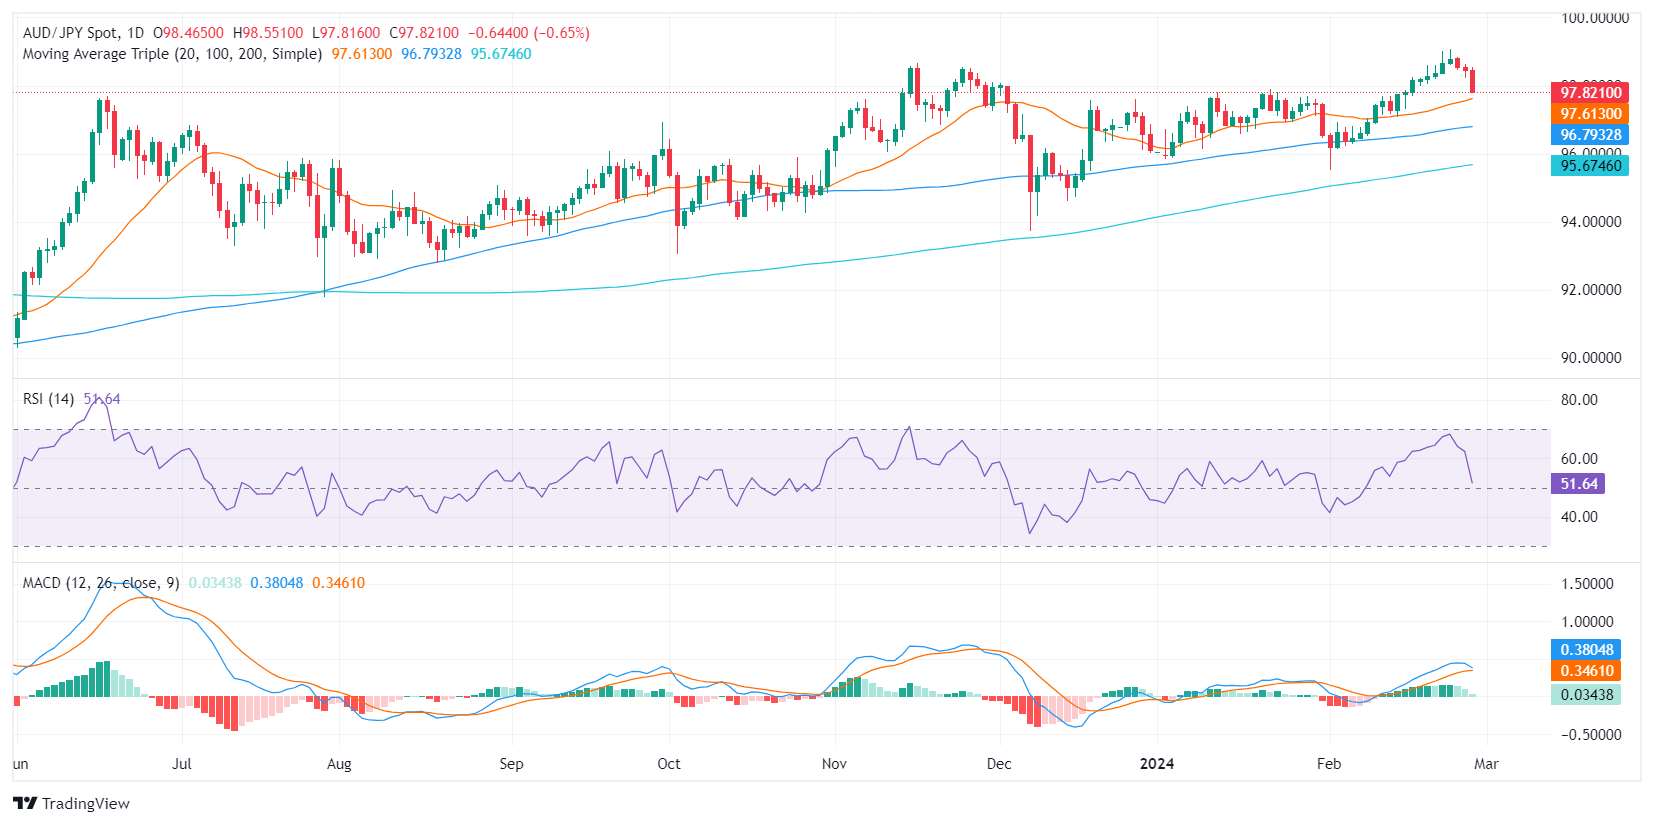
Based on the indicators of the daily chart, the AUD/JPY pair shows a negative momentum as the Relative Strength Index (RSI) is currently in negative territory. Its rising slope however, suggests that the buyers are recovering The declining red bars in the Moving Average Convergence Divergence (MACD) histogram further emphasize this bearish momentum, signaling that sellers currently dominate the market but with a weakened grip.
AUD/JPY daily chart
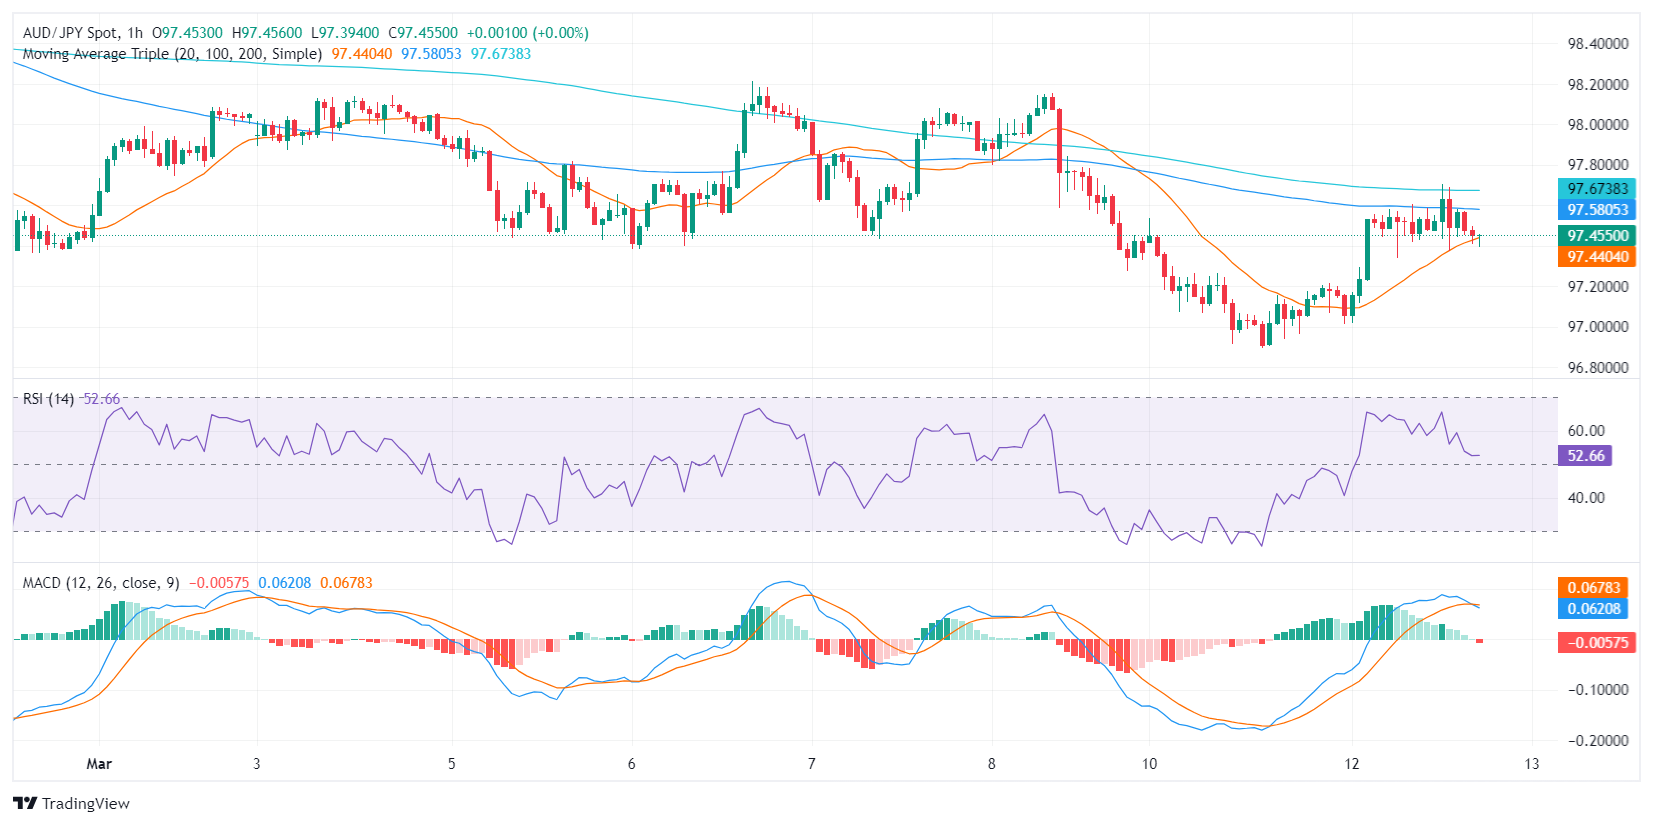
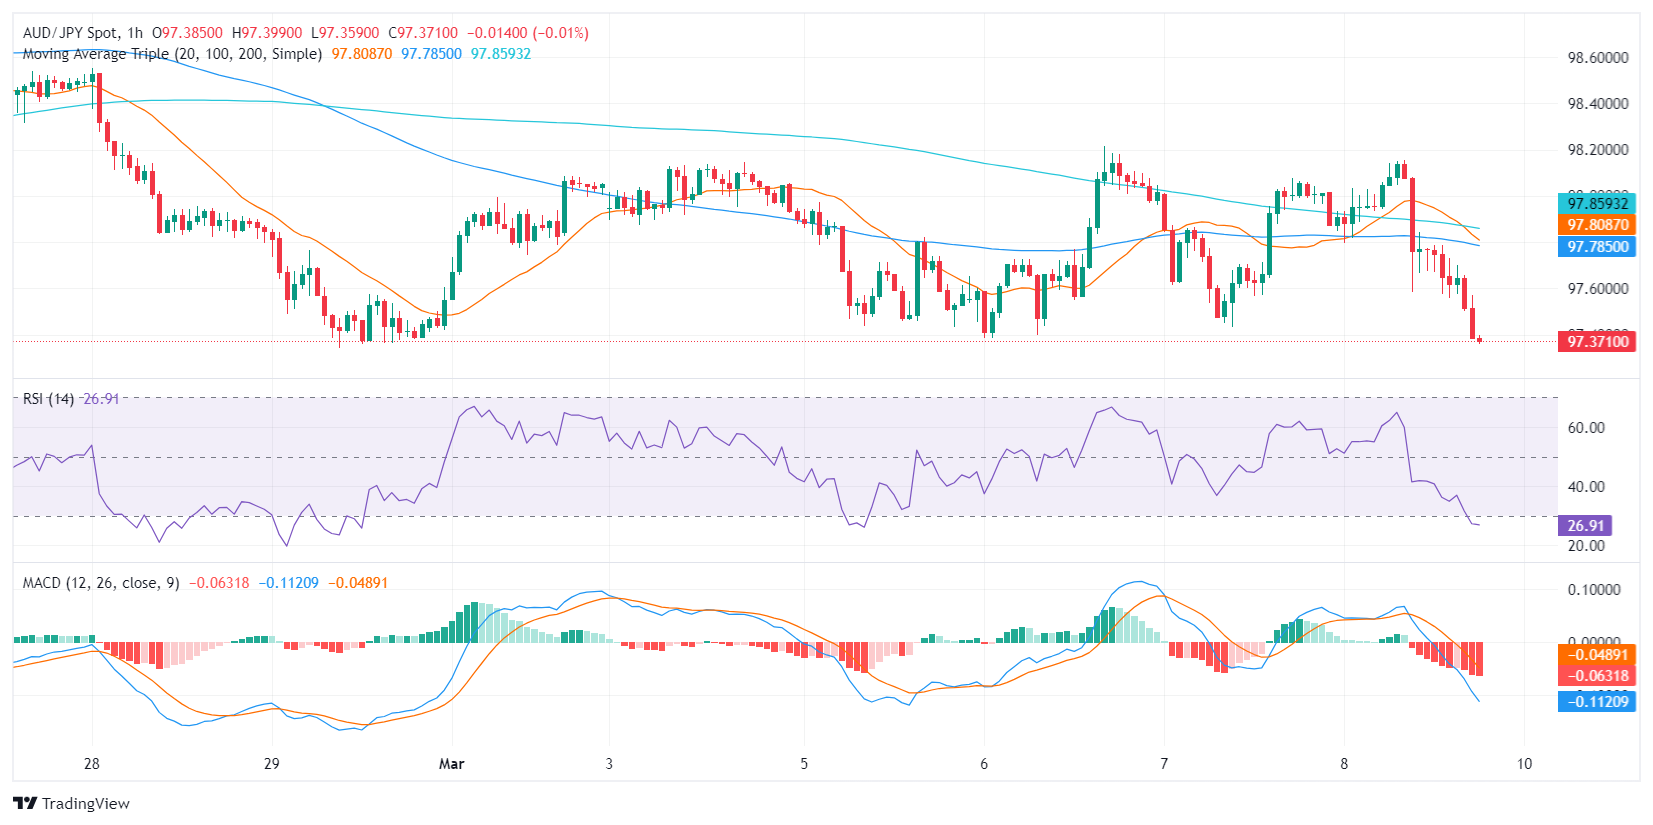
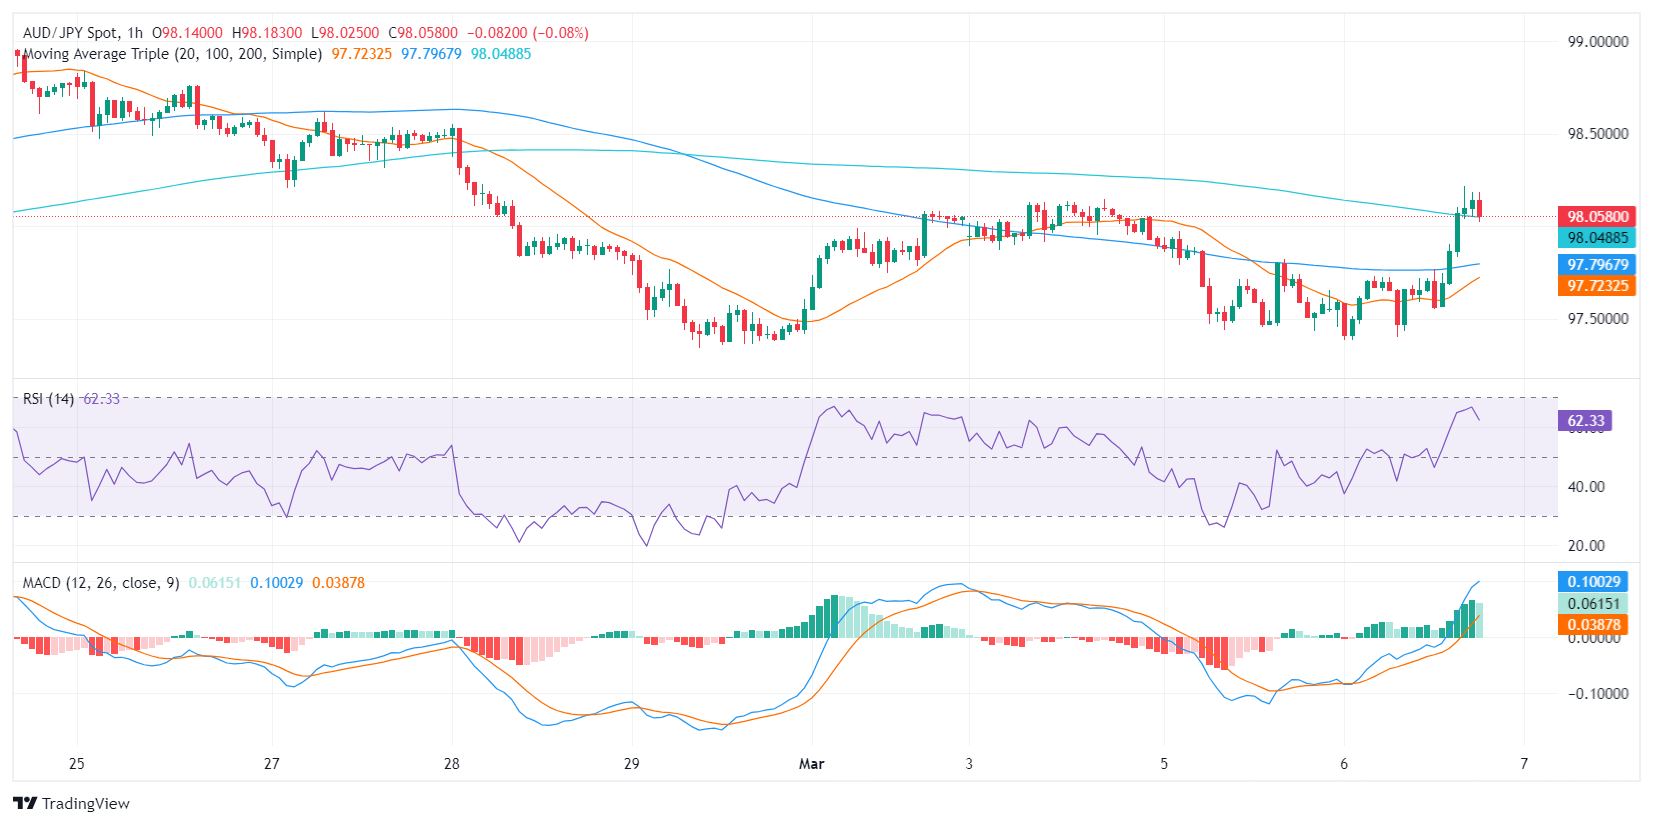
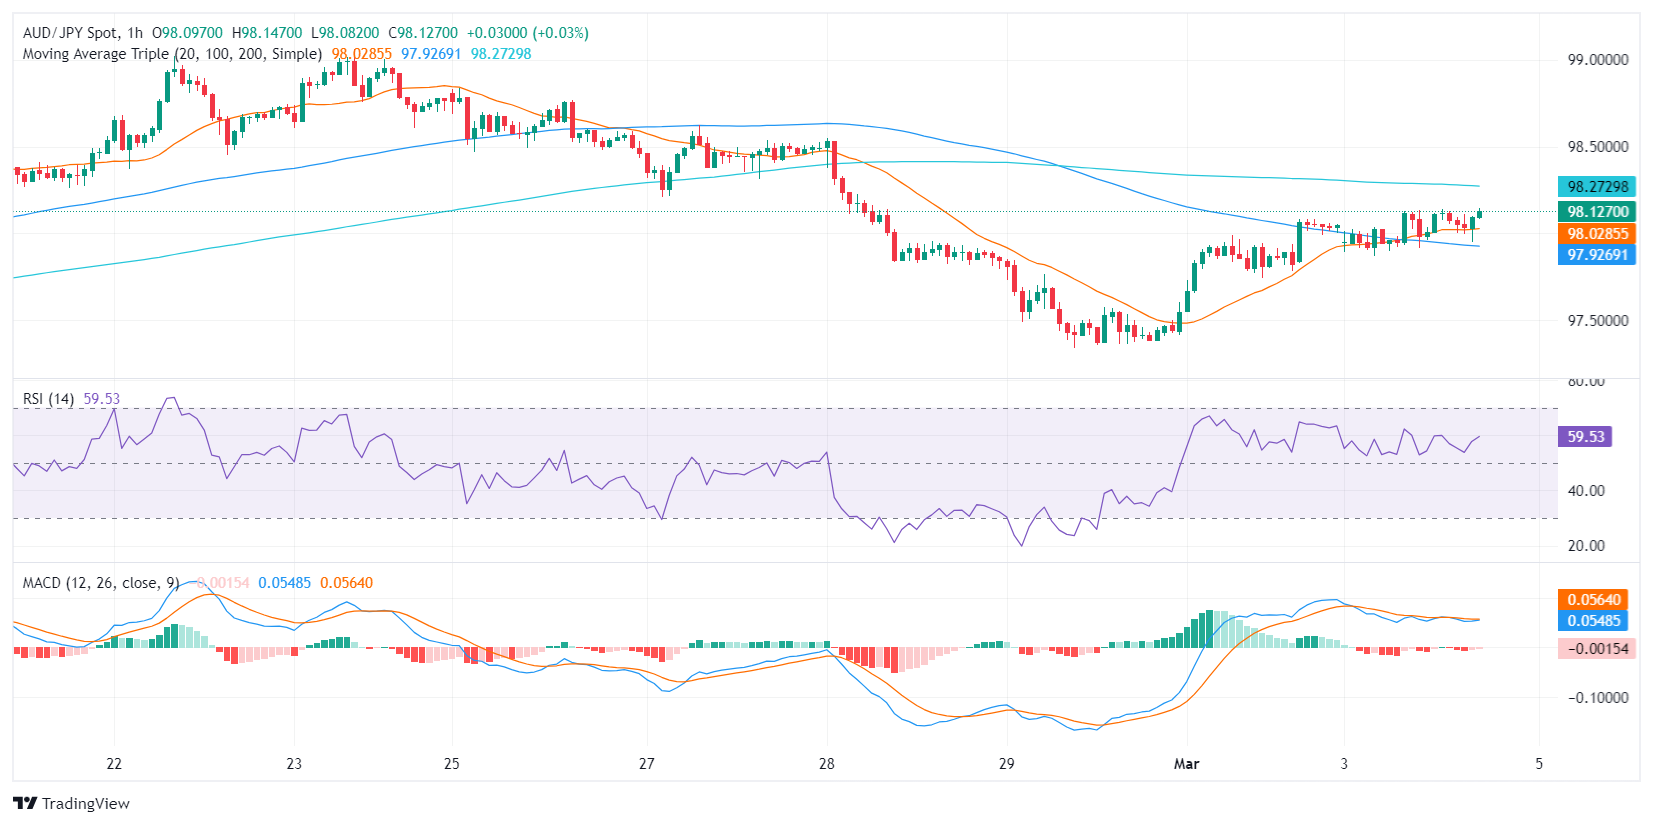
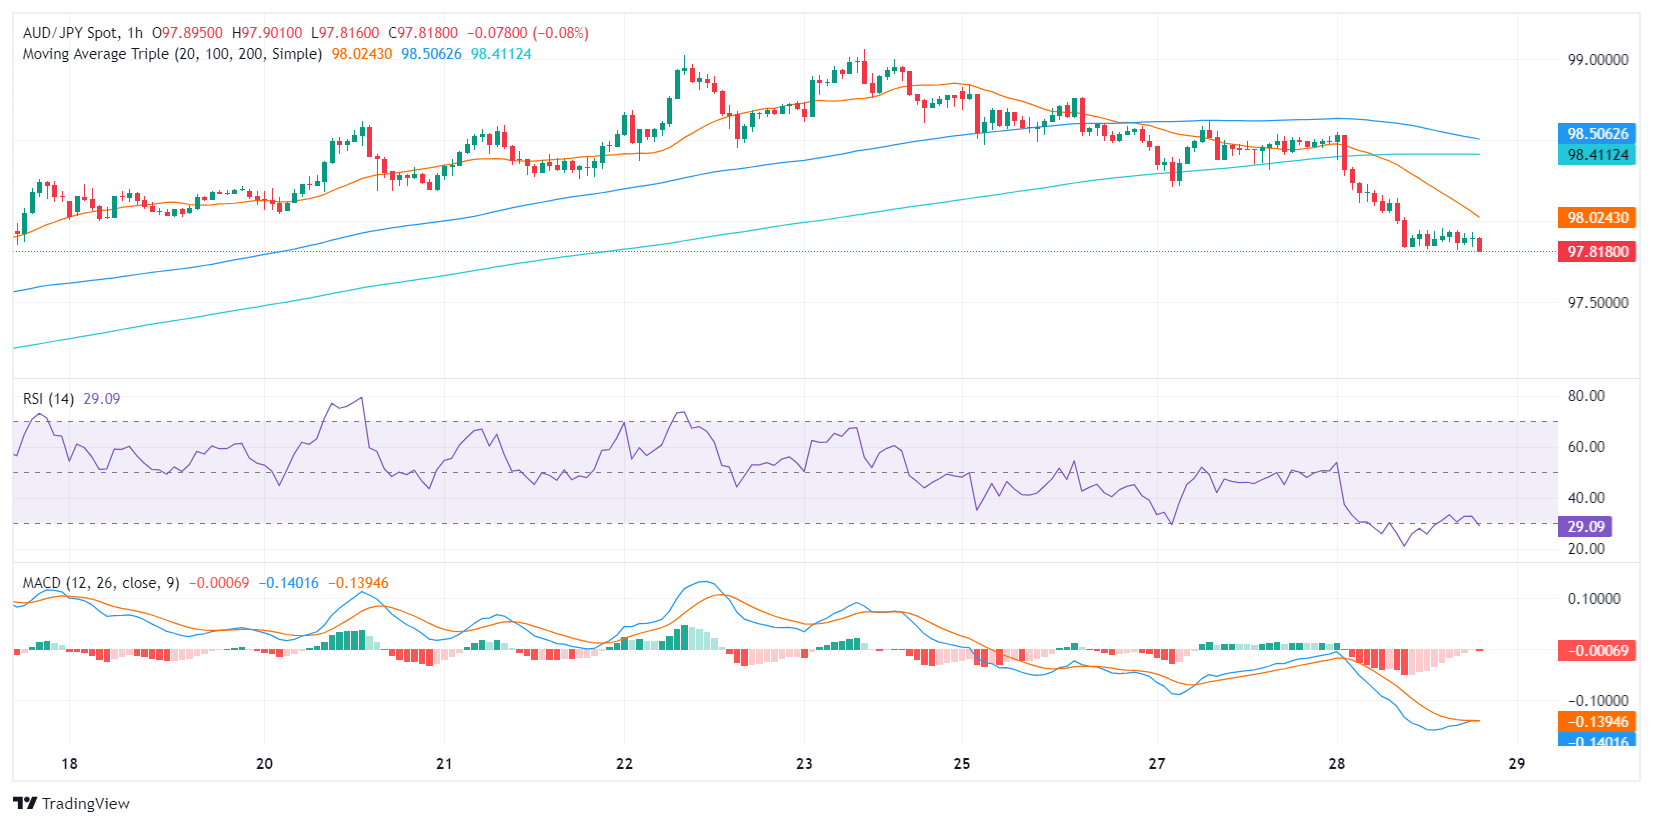
Transitioning to the hourly chart, the RSI stands in positive territory, illustrating a recovery in recent hours. The MACD histogram on the other hand printed a red bar, indicating that the resurge might be short-lived.
AUD/JPY hourly chart
Looking at the broader context, despite the short-term negative outlook, the AUD/JPY remains bullish as it trades above its 100, and 200-day Simple Moving Averages (SMAs). This suggests that the longer-term positive trend could still overshadow recent bearish movements. That being said, the buyers shouldn’t relax and must recover the 20-day average to resume its upward path.
-
11.03.2024 18:22AUD/JPY Price Analysis: Bears consolidate after hitting oversold conditions in the hourly chart
- The hourly RSI recovered after bottoming at oversold conditions.
- The negative outlook is more evident on the daily chart with bears threatening the 100-day SMA.
- As long as the bulls hold above the 100 and 200-day SMAs, the overall trend will remain bullish.
In Monday's session, the AUD/JPY pair commenced the week with a drop of 0.50%, trading around the 96.97 level. Bears are in command for the short term, but their momentum seems to fade. On the broader scale, the outlook remains bullish
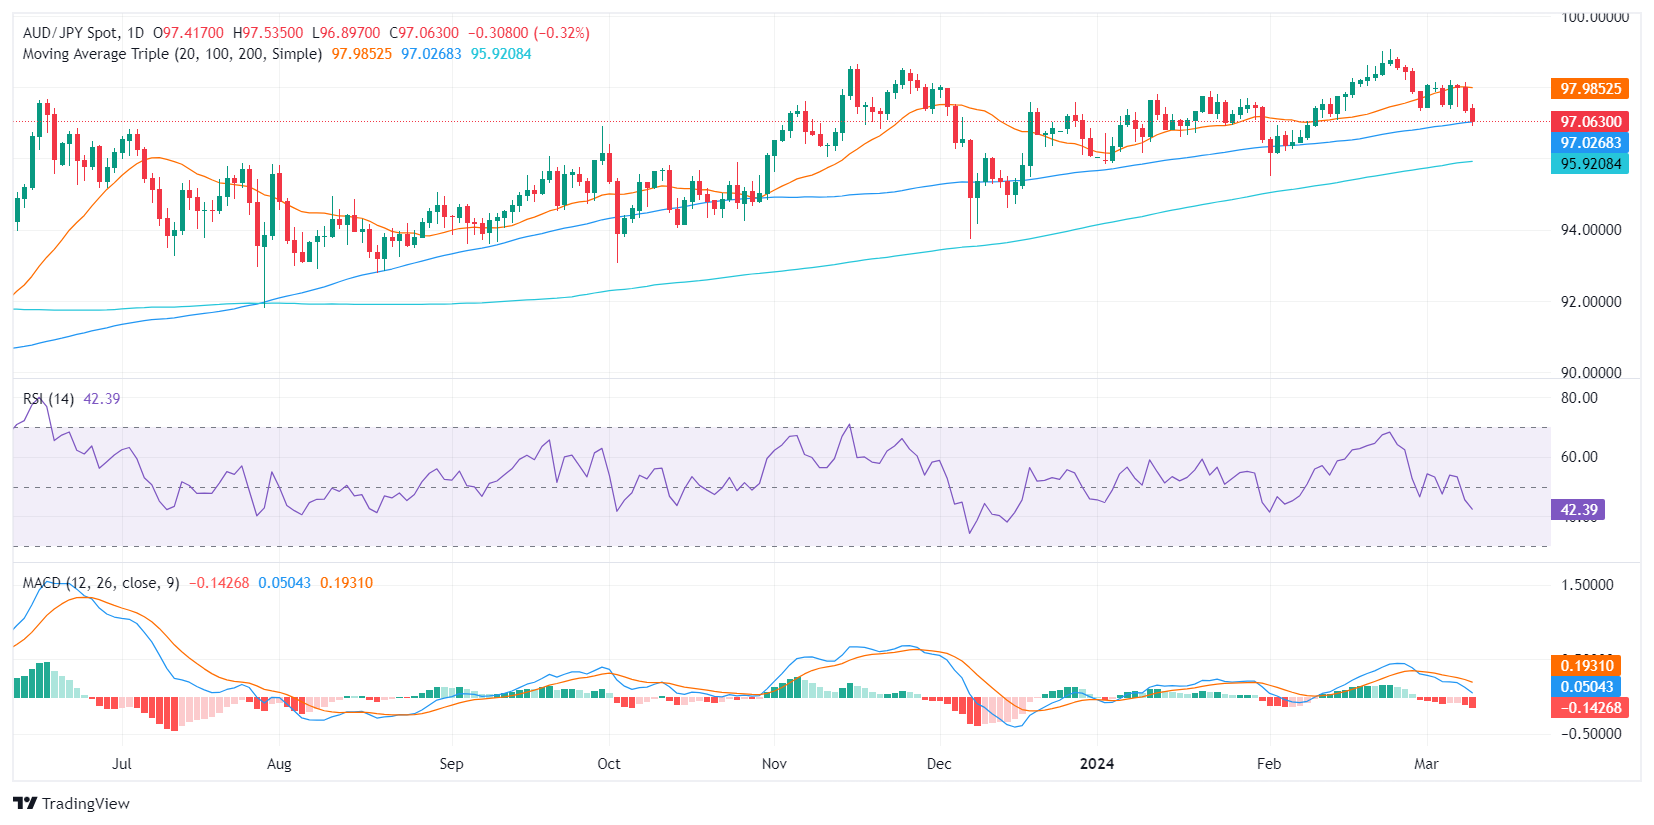
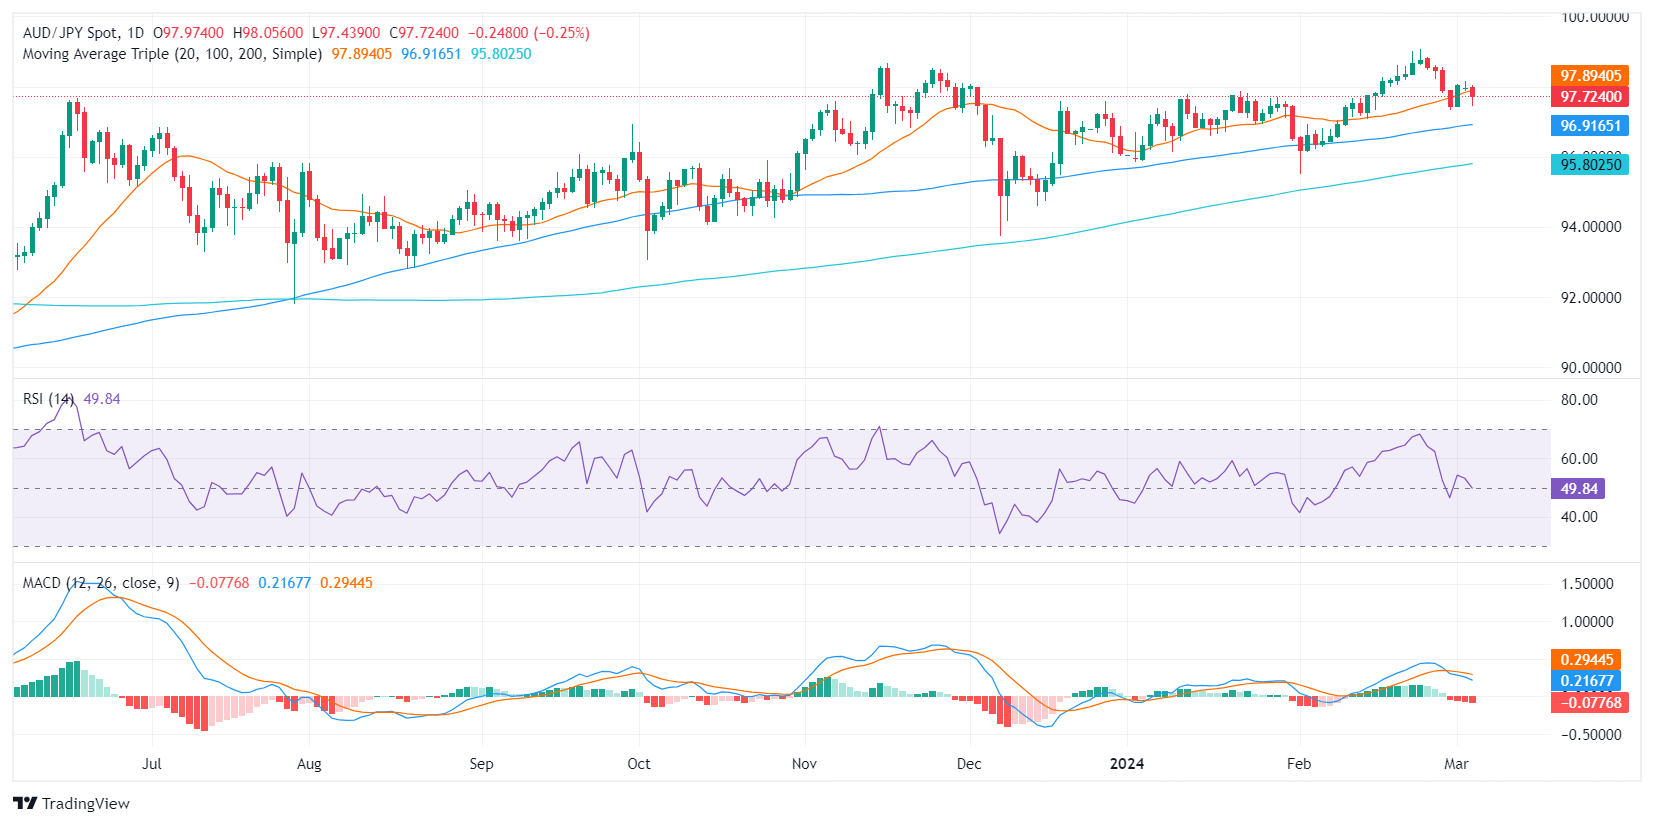
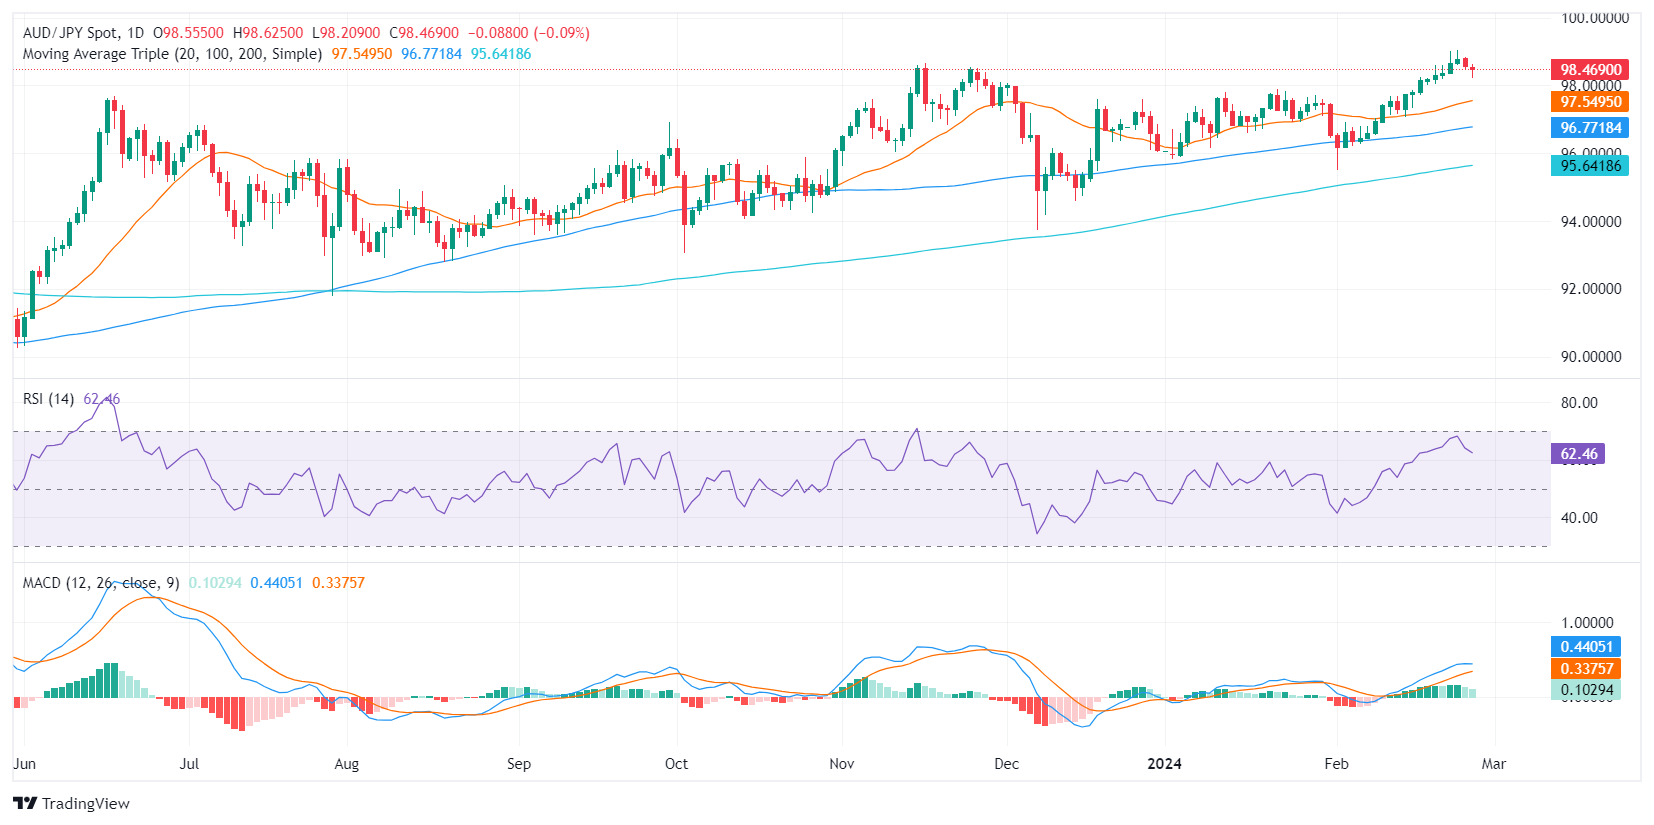
The AUD/JPY pair on the daily chart shows a negative outlook. The Relative Strength Index (RSI) remains deep in negative territory and seems to be en route to the oversold region. Meanwhile, the Moving Average Convergence Divergence (MACD) depicts rising red bars, suggesting an increased bearish momentum.
AUD/JPY daily chart
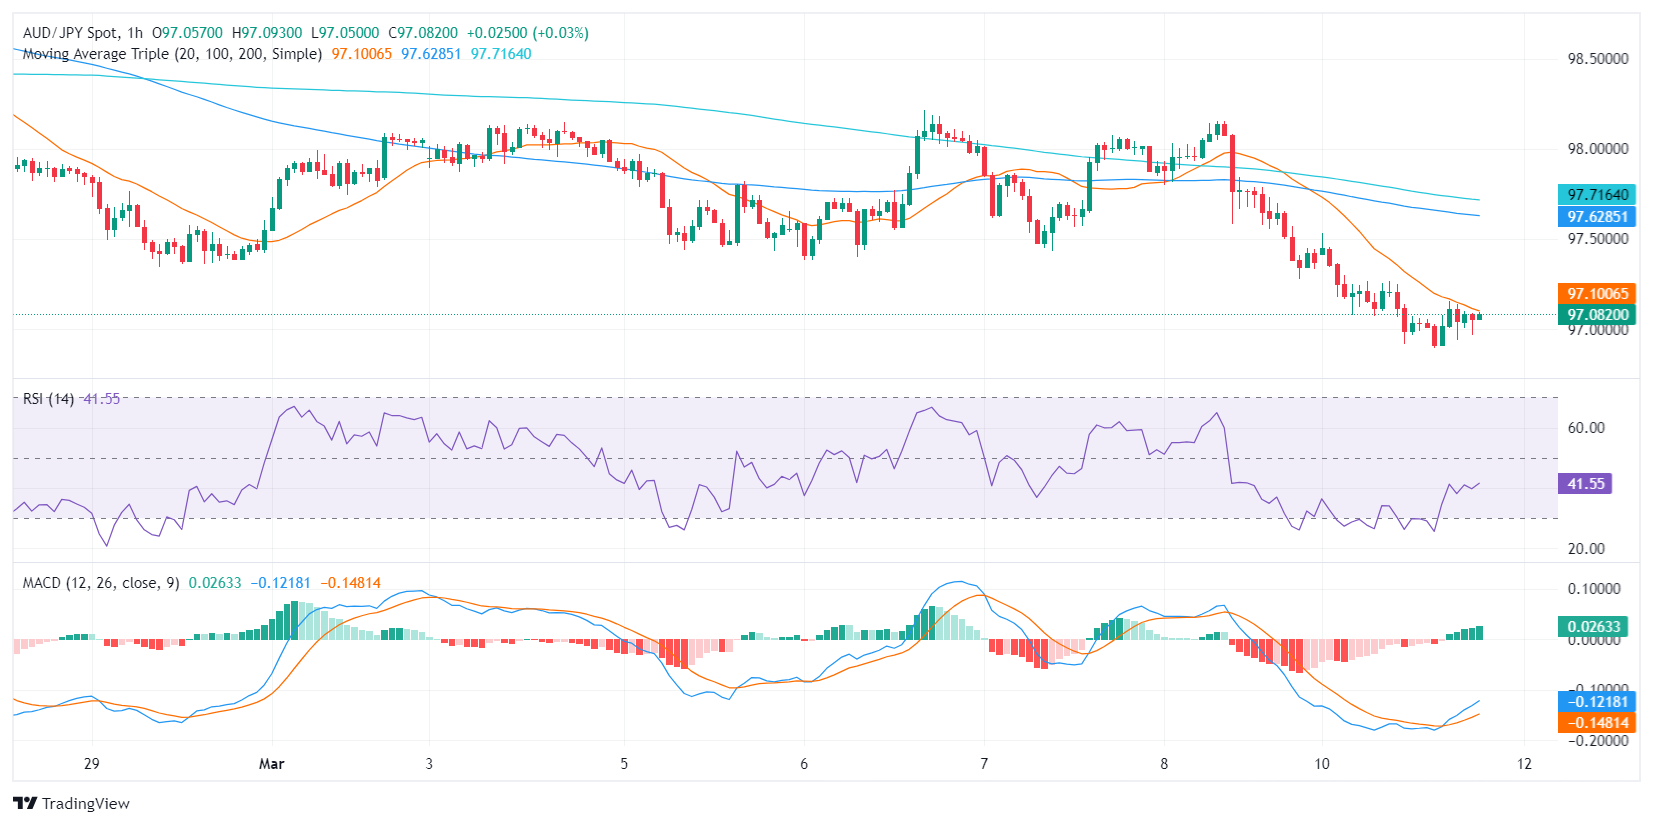
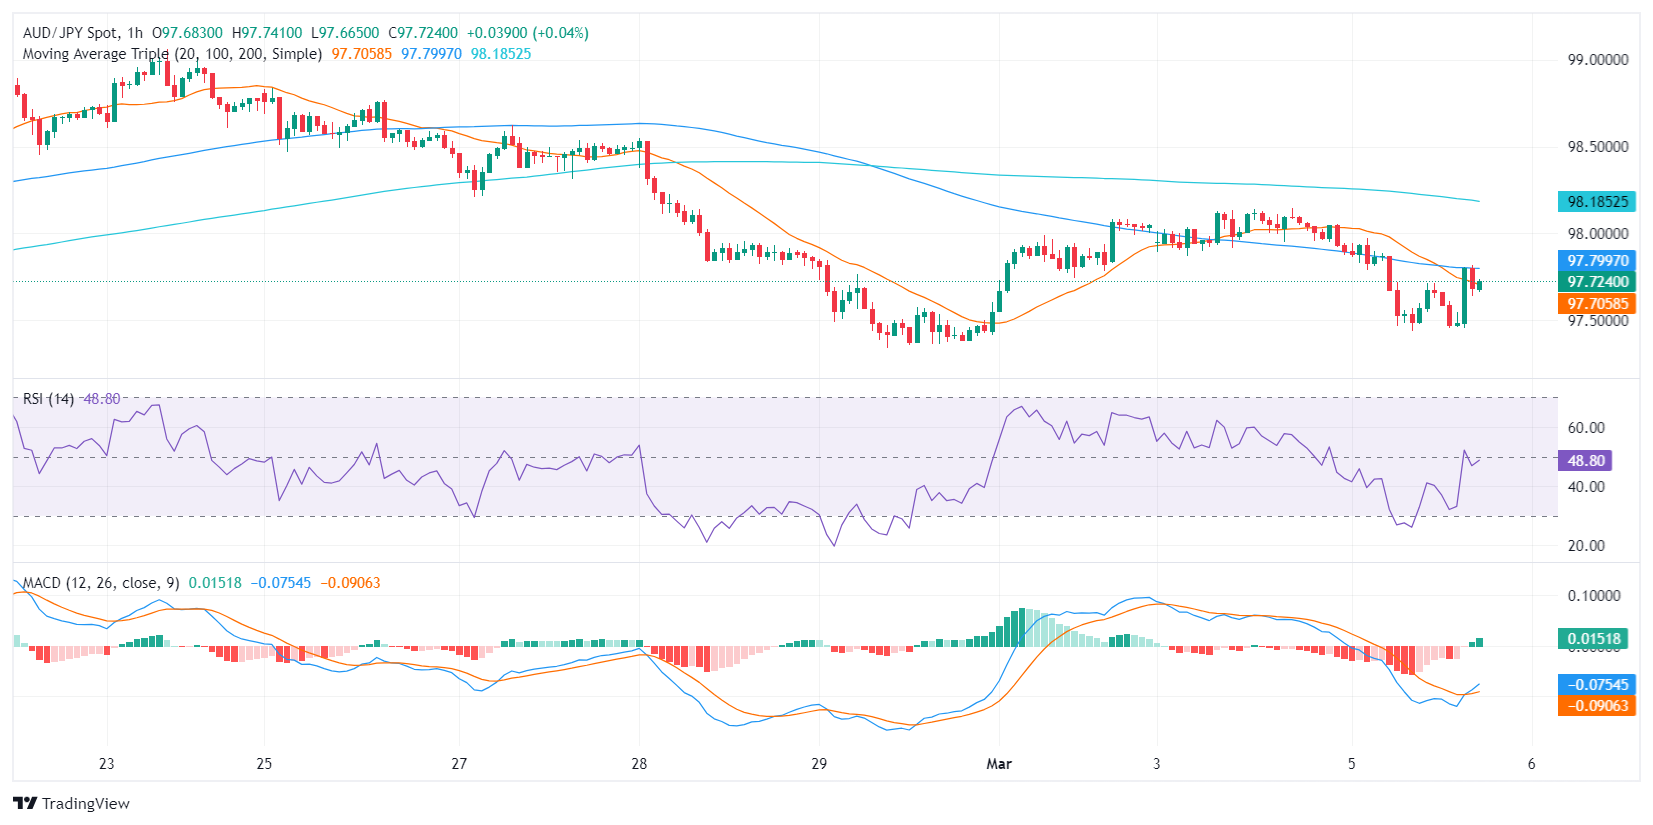
Shifting to the hourly chart, the RSI jumped back from a low of 30 as bears seemed to be consolidating their movements. The hourly MACD presents green bars on the rise, indicating a surge in positive momentum.
AUD/JPY hourly chart
In conclusion, despite the short-term dominance of the bears, the selling momentum seems to be waning. This would give the buyers a chance to make an upward move. Meanwhile, the broader scale outlook, considering the pair's position above its 100 and 200-day SMAs, emphasizes overall bullish control despite trading below the 20-day average.
-
08.03.2024 18:17AUD/JPY Price Analysis: Bearish pressure intensifies, potential short-term rebound signalled
- The hourly chart portrays the RSI in the oversold territory, signaling a potential short-term rebound.
- On a broader perspective, the AUD/JPY remains above the main SMAs, indicating long-term bullish sentiment.
- The daily RSI is also in negative territory, showing increasing selling pressure.
- In the next sessions, the sellers may take a step back to consolidate their movements.
In Friday's session, the AUD/JPY pair is now trading at 97.49, demonstrating a loss of 0.38%. While the pair is currently dominated by sellers, oversold conditions seen on the hourly chart suggest that the pair may see some upside in the short term to consolidate.
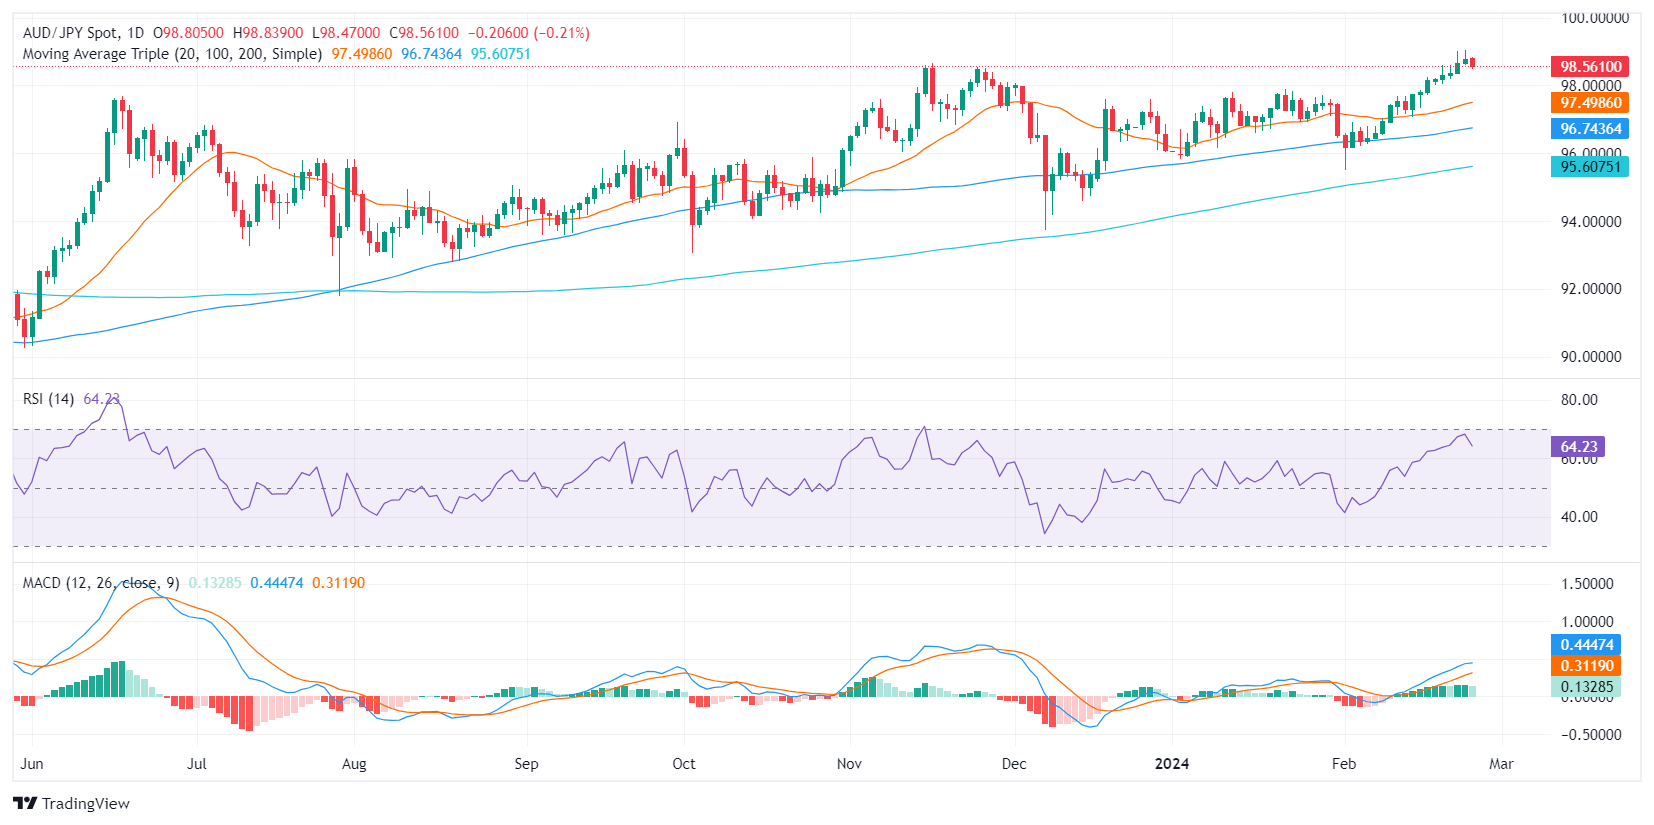
Analyzing the daily chart, the pair's Relative Strength Index (RSI) sits in negative territory, showcasing stronger selling momentum. In line with that, the Moving Average Convergence Divergence (MACD) histogram shows increasing negative momentum with rising red bars. Despite the ongoing bearish tendency, the pair manages to stay above the 100 and 200-day Simple Moving Averages (SMAs), which signifies a favorable condition for the bulls overall.
AUD/JPY daily chart
Zooming to the hourly chart, the RSI is currently located in the oversold territory, contrasting sharply with the daily chart, suggesting a possible short-term rebound due to oversold conditions. Likewise, the MACD illustrates increasing negative momentum on the hourly chart, aligning with the daily analysis. Despite differing conditions outlined in the hourly and daily charts, both depict dominant bearish forces, with bulls maintaining their stance in the broader spectrum and with the possibility of a bullish rebound in the short term.
AUD/JPY hourly chart
-
07.03.2024 17:53AUD/JPY Price Analysis: Bullish momentum builds, divergence risks loom
- A neutral outlook is seen on the daily chart.
- The hourly chart for AUD/JPY paints a different picture, showcasing mounting buying pressure.
The AUD/JPY pair is currently trading at 97.99, showcasing slight losses. The currency pair is experiencing a delicate dynamic between short-term buyers, who are starting to become more active, while on the daily chart, the outlook is mixed. However, the overall trend remains bullish as the pair hovers above key Simple Moving Averages (SMAs) of 20,100 and 200 days.
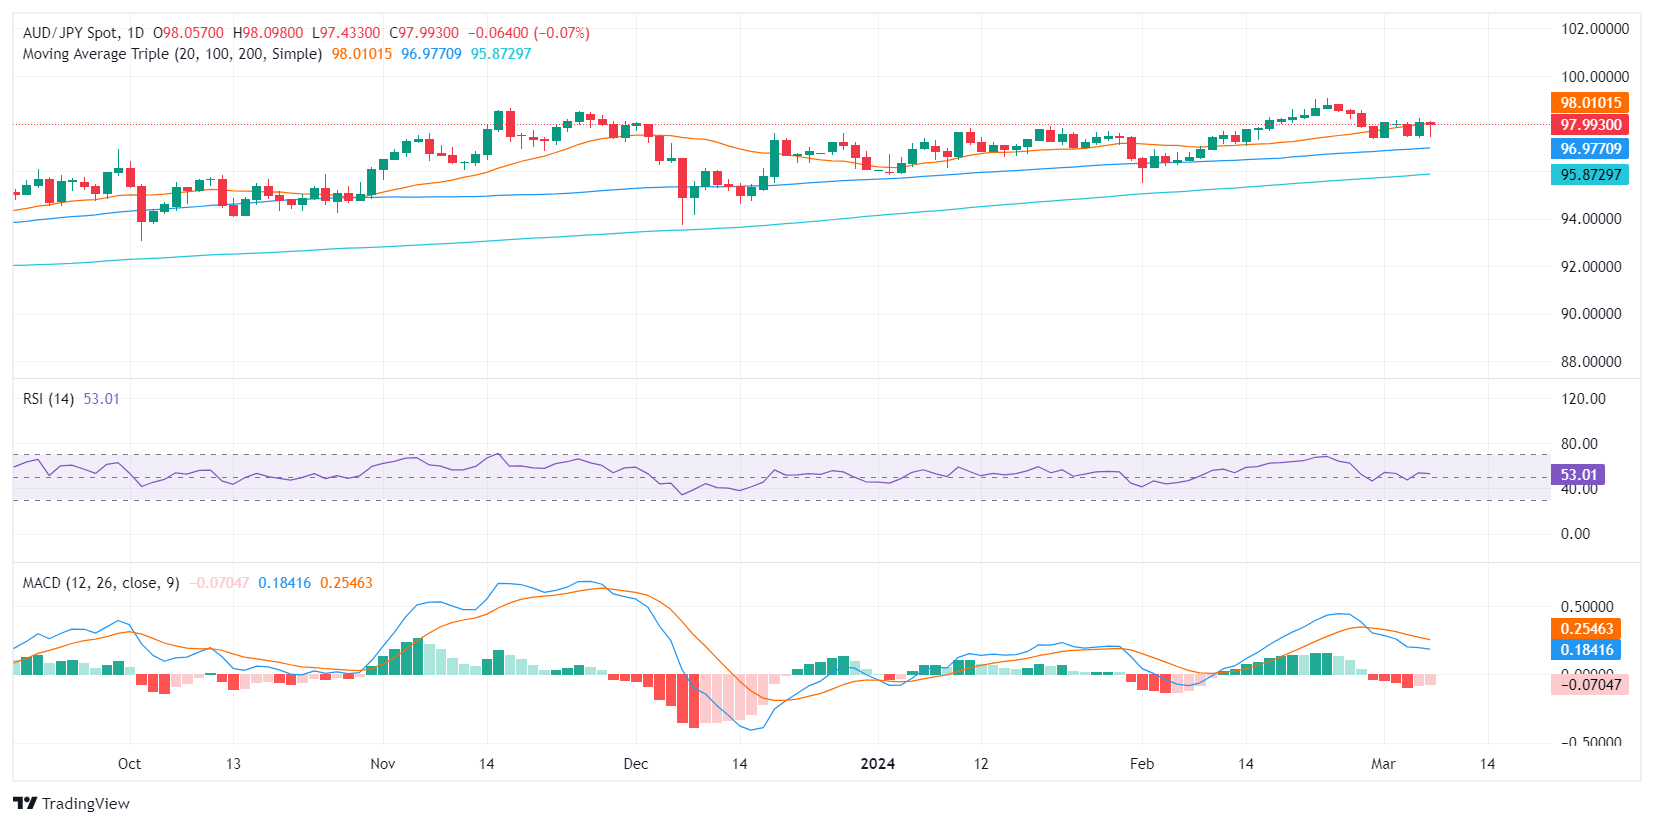
On the daily chart, the AUD/JPY pair is displaying a neutral momentum, underpinned by the Relative Strength Index (RSI) falling to negative territory this week. However, a slight increase was observed in the latest reading, suggesting a balanced market. Moreover, the fading red bars of the Moving Average Convergence Divergence (MACD) histogram indicate softening bearish momentum, casting doubt on the durability of the latest bearish move.
AUD/JPY daily chart
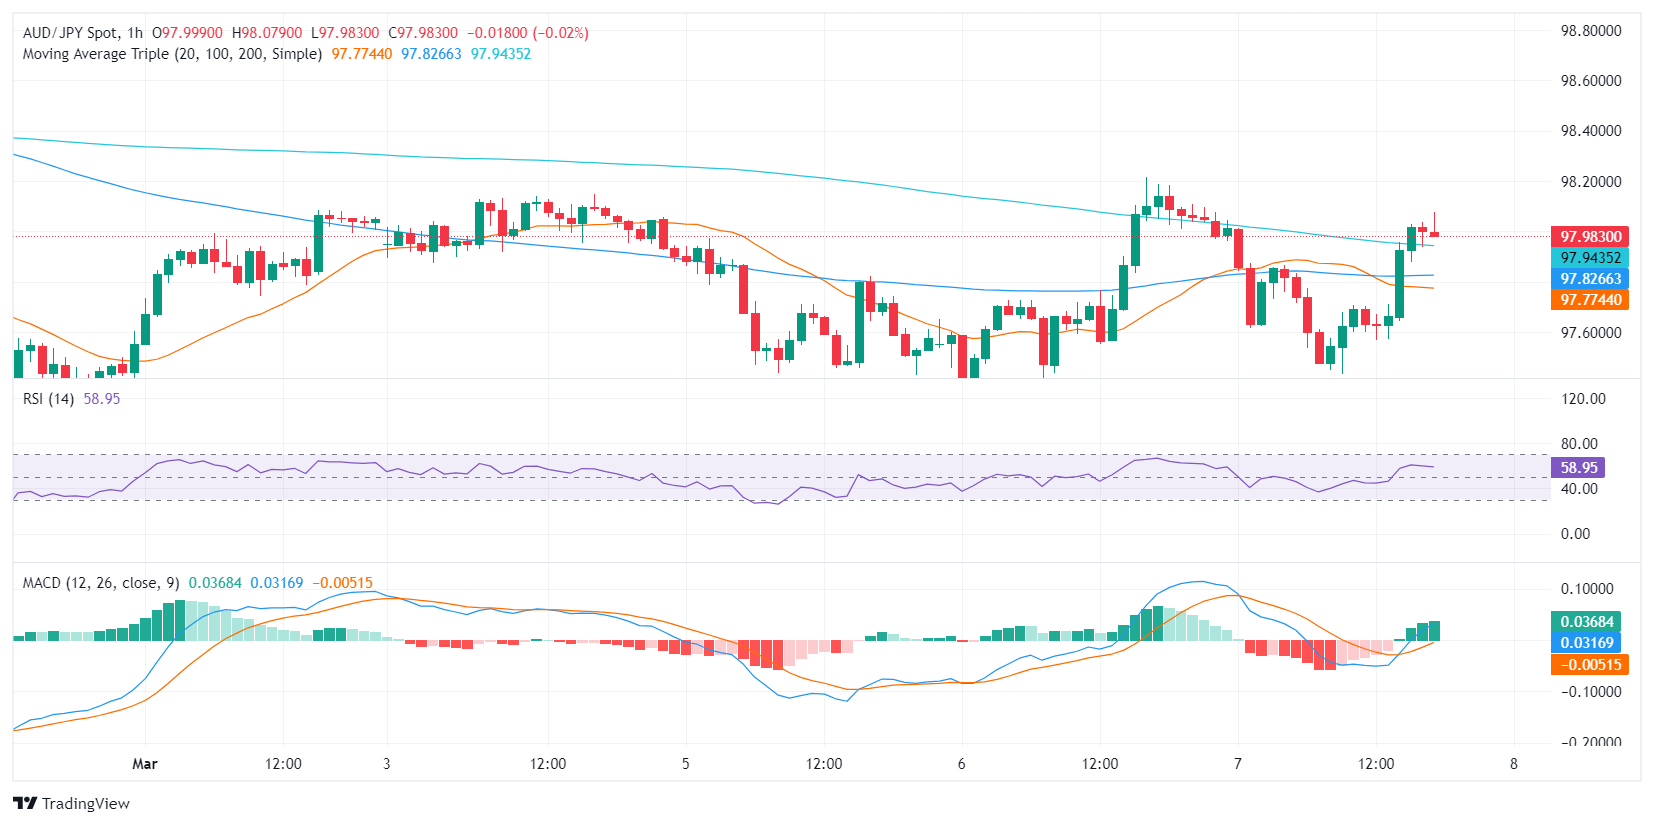
Taking a look at the AUD/JPY hourly chart, an interesting contrast comes into the picture. The recent positivity in the hourly Relative Strength Index (RSI), now within positive territory, underscores the mounting buying pressure at a granular level. Additionally, the rising green bars on the MACD histogram reveal escalating bullish momentum in this shorter timeframe, dispelling the cloud of bearishness cast by the daily chart.
AUD/JPY hourly chart
When combining daily and hourly views, it appears that the AUD/JPY is about to experience a period of consolidation after hitting multi-year highs in late February.
-
07.03.2024 09:25AUD/JPY depreciates on expectations of BoJ lifting negative rates, hangs near 97.50
- AUD/JPY loses ground on hawkish comments from BoJ officials on Thursday.
- Traders await the Japanese GDP Annualized due on Friday to gain further cues on the economy.
- Aussie Trade Balance (MoM) increased to 11,027M in February, lower than the expected 11,500M.
AUD/JPY plunges to near 97.50 during the European session on Thursday, retracing its recent gains registered in the previous session. The AUD/JPY cross lost ground after Bank of Japan (BoJ) Governor Kazuo Ueda mentioned that it is "fully possible to seek an exit from stimulus while striving to achieve the 2% inflation target." He also said that the extent of rate hikes would be determined by the situation at the time if negative rates are lifted.
BoJ policy board member Junko Nakagawa highlighted that the possibility of achieving the 2% inflation target sustainably is gradually improving. Nakagawa stressed the importance of scrutinizing data analysis duration for policy decisions. Additionally, Tuesday's data showed a rebound in the Tokyo Consumer Price Index (CPI) from a 22-month low in February. This has reignited discussions about the Bank of Japan potentially exiting the negative interest rates regime, thus bolstering the Japanese Yen against other currencies.
On the other side, the Australian Trade Balance showed that the surplus fell short of expected. The monthly data showed that the surplus increased to 11,027M in February, from 10,743M prior. The market expectation was an increase to 11,500M. Aussie Imports (MoM) increased by 1.3% in February, from the previous figure of 4.8%. Monthly Exports grew by 1.6%, exceeding the previous rise of 1.5%.
Australia's economy expanded less than expected in the fourth quarter, as shown by the latest Gross Domestic Product (GDP) data released on Wednesday. These softer numbers support the case for the Reserve Bank of Australia (RBA) to adopt an easing bias, which weakens the Australian Dollar (AUD) and, consequently, undermines the AUD/JPY cross.
Additionally, the positive Chinese Trade Balance data likely boosted the Australian Dollar, given Australia's close business ties with China. Additionally, the optimistic outlook for the Chinese economy could hinder the Japanese economy, thereby weakening the JPY and restricting losses in the AUD/JPY cross. China's Trade Balance for February surged to $125.16 billion, surpassing expectations of $103.7 billion and the previous figure of $75.34 billion. Additionally, year-on-year imports and exports increased by 3.5% and 7.1%, respectively. Japanese GDP Annualized for the fourth quarter of 2023 will be eyed on Friday.
-
06.03.2024 19:31AUD/JPY Price Analysis: Bullish momentum signaled through short-term consolidation is on the horizon
- Building momentum is indicated by the RSI on the daily chart.
- The hourly chart also strengthens the positive outlook, with the presence of bullish momentum but hinting at a slight wobble.
- The pair recovered the 20-day SMA affirming the continued bullish sentiment.
During Wednesday's session, the AUD/JPY edged higher. The strength of the buyers primarily on the daily chart fuels this bullish sentiment. However, the hourly chart flashes signs of short-term contention, suggesting a potential consolidation for the rest of the session.
On the daily chart, the AUD/JPY pair indicates some bullish momentum. The Relative Strength Index (RSI) has moved into positive territory, which marks an upbeat momentum, with its latest reading standing slightly above the midpoint. Simultaneously, the Moving Average Convergence Divergence (MACD) histogram printing flat red bars indicates a decreasing bearish momentum in the short term.
AUD/JPY daily chart
Switching to the hourly chart, the RSI is treading in the positive region, confirming the bullish daily scenario. However, the index seems to be consolidating after nearing overbought conditions earlier in the session. In addition, the MACD histogram reveals decreasing green bars, suggesting the bullish momentum is waning on the hourly chart.
AUD/JPY hourly chart
In conclusion, both the daily and hourly charts suggest a bullish momentum, notwithstanding the short-term signs of a pullback. Given the pair's position being above the 20,100,200-day SMAs, the overall trend remains in favor of the buyers, unless a significant shift in momentum is seen.
-
06.03.2024 09:35AUD/JPY sticks to gains near 97.60 after recovering daily losses
- AUD/JPY recovers intraday losses on improved S&P/ASX 200 Index.
- Aussie GDP grew by 0.2% in Q4 2023, against the anticipated 0.3%.
- Attendees of the BoJ could advocate for lifting negative interest rates in the March meeting.
AUD/JPY reverses its daily losses on the improved ASX 200 Index and moves into the positive territory on Wednesday. The cross hovers around 97.60 during the European trading hours. During the Asian hours, the AUD faced downward pressure as the S&P/ASX 200 Index encountered challenges, reflecting a sell-off in technology stocks on Wall Street and lower mining stocks.
Despite softer-than-expected Gross Domestic Product (GDP) (Q4), the Australian Dollar remained relatively unaffected. The GDP grew by 0.2% quarter-on-quarter in the fourth quarter of 2023, slightly below market expectations of no change at 0.3%. However, on a year-on-year basis, GDP expanded by 1.5%, surpassing the expected 1.4%, albeit falling short of the previous growth of 2.1%.
The AUD/JPY cross could encounter resistance following reports from Jiji Press suggesting that attendees of the upcoming Bank of Japan (BoJ) policy meeting on March 19 may advocate for "lifting negative interest rates." However, BoJ Governor Kazuo Ueda expressed skepticism on Friday regarding the sustainability of Japanese inflation reaching the 2% target. With the unexpected possibility of a recession, the BoJ may delay its plans for monetary policy tightening.
According to Reuters, an unnamed source indicates that the BoJ is likely to maintain its forecast for a moderate economic recovery but may revise its assessment of consumption and factory output at the March meeting.
Tuesday’s data showed a rebound in the Tokyo Consumer Price Index (CPI) from a 22-month low in February. This development has reignited discussions about the possibility of the Bank of Japan (BoJ) exiting the negative interest rates regime, which, in turn, has bolstered the Japanese Yen.
-
05.03.2024 18:22AUD/JPY Price Analysis: Bears consolidate after hitting oversold conditions on the hourly chart
- The AUD/JPY is trading down at 97.73 with losses in Tuesday’s session.
- Despite operating above the main SMAs, indicating long-term bullish sentiment, the short-term scenario is dominated by selling pressure.
- The daily RSI remaining pointing down, and MACD depicting an increase in red bars both signal growing selling momentum.
For Tuesday's session, AUD/JPY is exchanging hands at a level of 97.73, recording a minor decline of 0.19%. Despite the selling exertion evident on the daily chart, there appears to be a broader remains bullish as the pair continues trading above its main Simple Moving Averages (SMAs).
On the daily chart, the Relative Strength Index (RSI) for AUD/JPY remains in negative territory, while, the Moving Average Convergence Divergence (MACD) histogram is rising with red bars, indicating an increase in negative momentum.
AUD/JPY daily chart
Turning to the hourly chart, the RSI dipped into oversold territory earlier in the session, suggesting a strong bearish outlook very short term, and now the index recovered near its midline point suggesting that sellers are taking a breather. This view is corroborated by the rising green bars of the MACD.
AUD/JPY hourly chart
Overall, the AUD/JPY pair seems to be under selling pressure in the short term despite the broader bullish context suggested by its position above the 100 and 200-day SMAs. For the rest of the session, the pair may continue correcting oversold conditions hit earlier in the session.
-
04.03.2024 18:08AUD/JPY Price Analysis: Bullish sentiment persists, indicators point to weak momentum
- The AUD/JPY is trading at 98.04, marking a 0.12% gain during Monday's session.
- The RSI on both daily and hourly charts is in the positive zone, but momentum is limited.
- The overall trend remains bullish as the buyers recovered the 20-day SMA.
In Monday's session, the AUD/JPY pair is trading at 98.04, reflecting a 0.12% gain. Despite a slight decrease in buying momentum, there's an overall moderate bullish sentiment dominating the market as indicators seem to recover after recent declines.
On the daily chart, the AUD/JPY pair's Relative Strength Index (RSI) is currently in positive territory, indicating that buyers have had the edge recently after diving below 50. Despite slight decreases in the latest readings, there's still a moderate bullish momentum. The Moving Average Convergence Divergence (MACD) histogram shows flat red bars, suggesting a loss in positive momentum but a still mildly bullish sentiment in the market.
AUD/JPY daily chart
Switching to the hourly chart, the RSI values present a similar picture, hovering in the positive territory, and the MACD histogram continues with red decreasing bars, indicating a loss in selling momentum but a flattened buying traction. The readings imply that the pair is experiencing similar dynamics on a shorter-term scale.
AUD/JPY hourly chart
By contrasting the daily and hourly charts, indicators suggest a consistent bullish momentum, albeit with decreased intensity. Despite the short-term neutral-to-negative outlook, the pair's position above the 20, 100, and 200-day Simple Moving Averages (SMAs) reinforces the perspective that buyers are in control in a broader market view.
-
01.03.2024 09:20AUD/JPY rebounds to near 97.80 on remarks from BoJ Governor Ueda
- AUD/JPY breaks its four-day losing streak on Friday.
- BoJ Governor Kazuo Ueda expresses skepticism regarding inflation reaching the 2% target.
- S&P/ASX 200 Index tracked gains on Wall Street, supporting the AUD.
AUD/JPY snaps its four-day losing streak, improving to near 97.80 during the European session on Friday. The Australian Dollar (AUD) bolsters by the rise in the S&P/ASX 200 Index and gains on Wall Street, supporting the AUD/JPY cross.
Furthermore, positive data such as the Judo Bank Manufacturing PMI on Friday, which showed a slight improvement in Australia's manufacturing sector, and recent Retail Sales and Private Capital Expenditure data have contributed to the strength of the Aussie Dollar (AUD).
Additionally, the Aussie Dollar (AUD) might have received upward support from the Judo Bank Manufacturing PMI indicated a slight improvement in Australia's manufacturing sector, with the February reading rising to 47.8 from 47.7 in the previous period. Additionally, the recent Retail Sales and Private Capital Expenditure data bolstered the AUD on Thursday.
The Japanese Yen (JPY) could have struggled after the Bank of Japan (BoJ) Governor Kazuo Ueda expressed skepticism regarding the sustainability of Japanese inflation reaching the 2% price growth target. Ueda mentioned that the recent economic downturn represents a rebound from previously robust quarters. Inflationary pressures are subsiding at an accelerated rate, offering some relief. This could prompt the BoJ to delay its plans to tighten monetary policy, which in turn, undermines the Japanese Yen.
BoJ Governor Ueda stated that anticipated wage negotiations are expected to provide additional support. Japan's economic recovery is projected to persist gradually. He emphasizes the importance of evaluating the collective results of wage negotiations and firm hearings before assessing wage data. Expectations are for a rebound in Japan's consumption, particularly with promising outcomes anticipated from spring wage talks.
-
29.02.2024 18:12AUD/JPY Price Analysis: Bears seize control, reclaim the 20-day SMA
- The AUD/JPY currently trades at 97.42, undergoing a 0.43% loss in Thursday's trading session.
- The daily chart shows a shift in RSI from positive to negative territory.
- If the AUD/JPY holds above the 100 and 200-day SMA the outlook will still be positive.
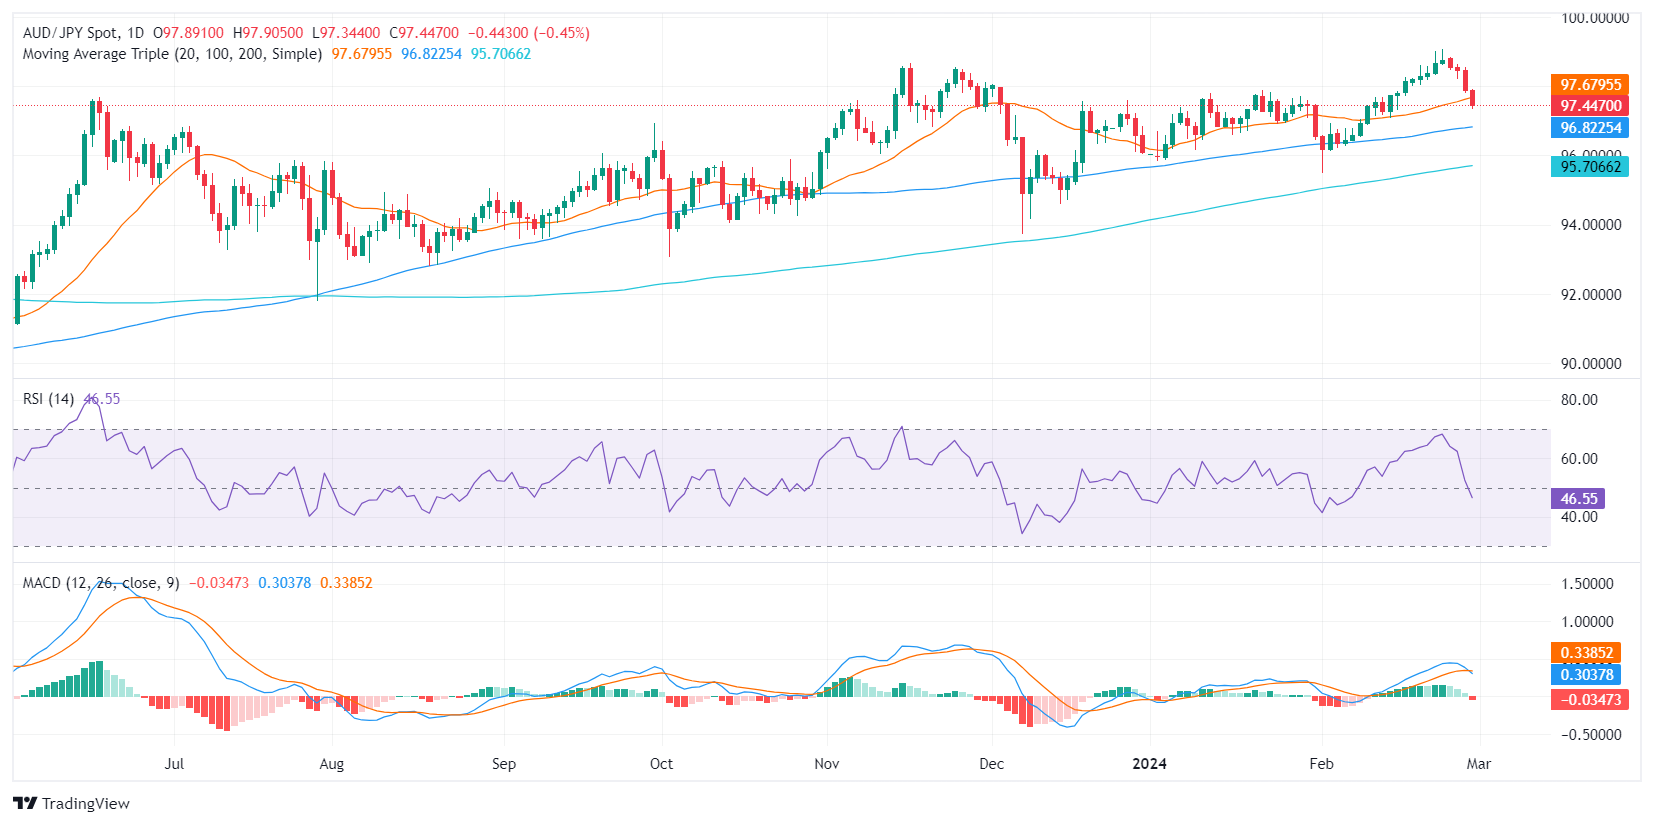
The AUD/JPY pair is currently trading at 97.42, marking a 0.43% loss. The pair is navigating moderate selling pressure, suggesting control from the sellers' side, albeit the bulls maintaining ground as the pair stands above key Simple Moving Averages (SMAs).
Considering the daily Relative Strength Index (RSI), a downward trend from positive territory into negative was seen. Combined with the rising red bars of the Moving Average Convergence Divergence (MACD) histogram, this indicates a shift in momentum toward sellers. Despite previously maintaining strength within positive territory, mild signs of price exhaustion emerged after hitting multi-year highs recently.
AUD/JPY daily chart
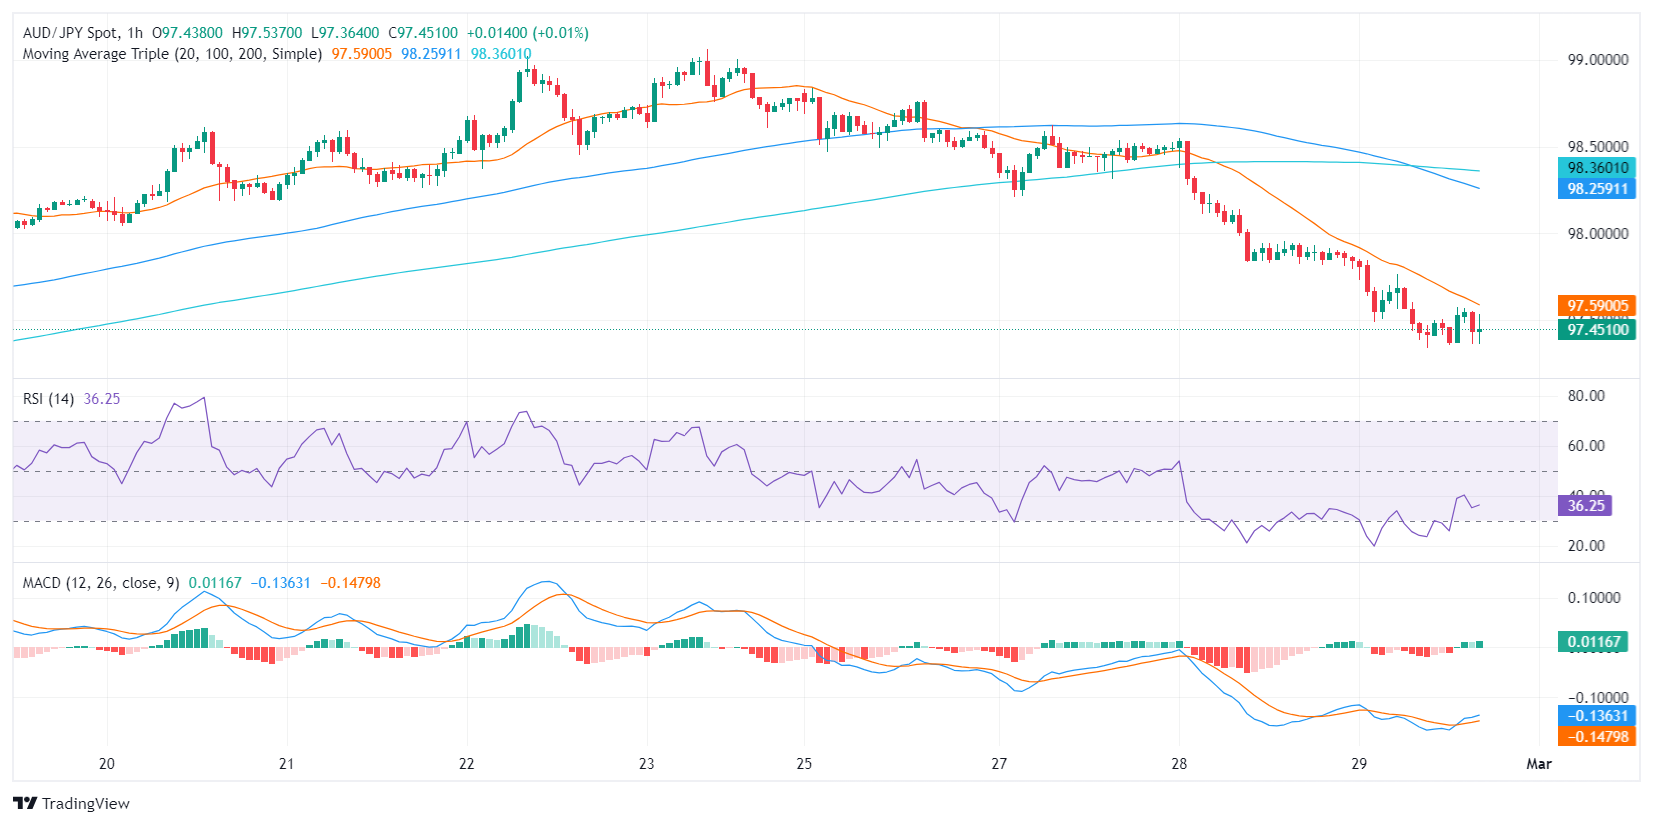
On an hourly chart, the RSI has remained within the negative territory, suggesting sustained selling pressure over the past hours. The MACD histogram, with flat green bars, confirms this bearish signal. A notable divergence between daily and hourly charts occurs, as the former has just entered a negative zone while the latter has been quite negative already. This underlines the speed and intensity of the bearish swing.
AUD/JPY hourly chart
Counterbalancing this pessimistic outlook, the AUD/JPY pair holds above its key 100 and 200-day Simple Moving Averages (SMAs), following the dip under the 20-day SMA. This suggests that despite the sudden bearish inclination, the bulls may not have entirely lost the game yet concerning the longer timeframe.
-
29.02.2024 06:39AUD/JPY loses momentum above the mid-97.00s amid BoJ’s hawkish comments
- AUD/JPY trades on a softer note near 97.65 in Thursday’s early European session.
- A fresh verbal intervention and growing speculation that the BoJ will exit from ultra-loose monetary policy lift the Japanese Yen.
- Australian Retail Sales rose 1.1% MoM in January, below the expectation of 1.5% MoM.
The AUD/JPY cross trades in negative territory for the fourth consecutive day during the early European trading hours on Thursday. The downtick of the cross is supported by the verbal intervention and hawkish remarks from Bank of Japan (BoJ) board member Hajime Takata. At press time, AUD/JPY is trading at 97.65, down 0.24% on the day.
On Thursday, BoJ board member Hajime Takata said that the Japanese central bank needs to consider a flexible approach, including an exit from negative interest rates and bond yield control. Earlier this month, BoJ Deputy Governor Shinichi Uchida stated that the central bank will review other components of its stimulus framework upon ending negative rates. That being said, the hawkish comments from the Japanese authorities provide some support to the Japanese Yen (JPY) and act as a headwind for the AUD/JPY cross.
Meanwhile, a fresh verbal intervention from Japanese authorities might cap the upside of the cross. Japan's top currency diplomat Masato Kanda stated that the central bank will take appropriate action if currency moves are deemed too volatile.
On the Aussie front, Australian Retail Sales climbed by 1.1% MoM in January from a 2.7% fall in December, worse than the market expectation of an increase of 1.5%. The Australian Retail Sales figures might convince the Reserve Bank of Australia (RBA) to consider holding interest rates for longer.
Looking ahead, market players will keep an eye on the Australian Judo Bank Manufacturing PMI for February, along with the Japanese Unemployment Rate for January and the Jibun Bank Manufacturing PMI. Traders will take cues from the data and find trading opportunities around the AUD/JPY cross. -
28.02.2024 19:38AUD/JPY Price Analysis: Bears step in with hourly RSI near oversold area, trend still bullish
- The AUD/JPY is currently trading at around 97.90, reflecting a decrease of 0.55% in Wednesday's session.
- Although the daily RSI MACD on the AUD/JPY hints at fading momentum, buyers continue establishing their upper hand.
- However, the hourly chart indicators suggest stronger selling activity with the RSI venturing into oversold regions.
In Wednesday's session, the AUD/JPY fell to around 97.90, losing 0.55%. The short-term technical outlook hints towards a shift in command from the bears to the bulls while the overall bullish trend remains positive.
On the daily chart, the Relative Strength Index (RSI) for the AUD/JPY pair remains in positive territory, although with a declining trend. Despite the recent dip in the RSI, considering it still sits above the 50 mark, the buying pressure somewhat outweighs the selling pressure in the prevailing market conditions. However, a continuous downtrend, indicated by the RSI's negative slope since its recent peak, signifies a weakening in the buying momentum.
On the other hand, witnessing decreased green bars in the Moving Average Convergence Divergence (MACD) histogram indicates cues for a potential shift in trend. A falling MACD histogram generally means that the positive momentum is dwindling, indicating the sellers might be set to take control.
AUD/JPY daily chart
On the hourly chart, the RSI fluctuates in the negative territory, signaling increased selling activity. However, presenting a sharp contrast to the daily chart data, the hourly RSI ventures into the oversold area, which often points to a potential price correction in the near term to the upside. Also, the hourly MACD illustrates a weakening bearish momentum as suggested by the decreasing red bars which may suggest that an upward correction may be incoming..
AUD/JPY hourly chart
In retrospect, while the daily data illustrates a bullish trend, the hourly data presents that the bears took control but a slight upward correction shouldn’t be taken off the table for the rest of the session. The pair remains above the key Simple Moving Averages of 20,100 and 200 days, indicating a long-term bullish sentiment, despite short-term bearish glimpses.
-
27.02.2024 18:01AUD/JPY declines following CPI data from Japan
- The AUD/JPY is trading at 98.49, recording a 0.10% daily decline in Tuesday's session.
- The Japanese Yen is strengthening, propelled by an unexpected surge in Japan's January CPI data.
- Speculations of a shift in the Bank of Japan's hawkish policy are emerging, although disinflationary pressures persist.
The AUD/JPY pair is trading at 98.49, a minor 0.10% drop in Tuesday's session. This slight decline is observed amid the strengthening of the Japanese Yen, attributed to the surge in Japan's Consumer Price Index (CPI) during January.
In that sense, Japan's latest national CPI figures for January indicated a slight increase above expectations. The headline inflation rate was reported to have risen by 2.2% (YoY), against a forecast of 1.9%, and down from 2.6% in December. The core inflation rate, which excludes fresh food, was recorded at 2.0% YoY, meeting the expectations of 1.9% and a decrease from 2.3% in the previous month. Following the figures, both the JPY and the yields on Japanese Government Bonds (JGB) experienced an uptick, with the 2-year yield reaching its highest point since 2011 as markets renewed their hopes on a sooner liftoff of the Japanese banking authority. However, it's worth mentioning, that inflation is still trending downward, suggesting the Bank of Japan (BoJ) has room to maintain a cautious approach towards policy normalization. As for now, markets are gearing up for a liftoff in June, but the bank may delay it further.
AUD/JPY technical analysis
On the daily chart, the Relative Strength Index (RSI) predominantly roams in positive territory, emphasizing a fair control of buyers over the market's direction. Despite some of its negative slope, the pair maintains its foothold in the positive zone, signaling that the bulls are still in charge.
Simultaneously, decreasing green bars on the Moving Average Convergence Divergence (MACD) histogram denotes a decline in positive momentum. Buyers, though active, are gradually losing ground, encouraging caution on the part of the bulls. However, the pair is still above its main Simple Moving Averages (SMAs) of 20,100, and 200 days, which suggests that the overall trend is still bullish, and the mentioned downward movements could be considered as a consolidation.
AUD/JPY daily chart
-
26.02.2024 17:49AUD/JPY Price Analysis: Bulls maintain dominance despite bearish hints unveiling
- The AUD/JPY is trading at 98.50, falling by 0.25% during Monday's session.
- Daily RSI for the AUD/JPY oscillates in the positive zone with a slight shift towards the sellers.
- On the hourly scale, the RSI settles in negative territory, signaling a short-term bearish correction.
- Indicators are consolidating the gains that took the pair to multi-year highs.
The AUD/JPY is currently trading at 98.50, with a slight dip of 0.25%. Based on the mix of indicators, the pair has a predominantly bullish bearing, although there are mild bearish hints on the shorter time frames. In that sense, the downward movements can be seen as a mere technical correction of the pair needed to consolidate the gains that took it to highs since 2015.
On the daily chart, considering the recent Relative Strength Index (RSI) values, the index shows a slight decline, implying a minor shift in favor of the sellers near the overbought zone. Nonetheless, the positioning in the above half domain indicates that buyers still exercise control. Turning to the daily Moving Average Convergence Divergence (MACD), the histogram's decreasing green bars signal fading positive momentum. Despite this deceleration, the positive color implies that the bulls may still have some fuel to counterattack the bearish pulls.
AUD/JPY daily chart
On an hourly chart, the RSI has settled into the negative band, depicting a conflicting scenario between the short-term and the broader perspective. Concurrently, the MACD histogram shows an uptrend but it is characterized by red bars, pointing to a build-up of negative momentum.
AUD/JPY hourly chart
In summary, the AUD/JPY exhibits bullish signals from a general perspective, supported by its position above its main SMAs and positive territory representation by the daily RSI and MACD. However, bearish cues emerge on an hourly scale and maybe a warning that the bulls may take a breather in the next sessions to consolidate gains.
-
26.02.2024 04:15AUD/JPY drifts lower to snap eight-day winning streak to a multi-year top
- AUD/JPY kicks off the new week on a weaker note and moves away from a multi-year peak.
- Geopolitical risks and intervention fears underpin the JPY and exert pressure on the cross.
- The RBA’s hawkish outlook and BoJ policy uncertainty should help limit any further losses.
The AUD/JPY cross comes under some selling pressure during the Asian session on Monday and snaps an eight-day winning streak to the 99.00 mark, or its highest level since December 2014. Spot prices currently trade around the 98.60 region, with bears now awaiting a sustained break and acceptance below the 100-hour Simple Moving Average (SMA) before positioning for any further losses.
Against the backdrop of geopolitical risks, speculations that Japanese authorities will intervene to stem any further weakness in the domestic currency turn out to be a key factor behind the Japanese Yen's (JPY) relative outperformance. The Australian Dollar (AUD), on the other hand, is weighed down by the risk of a further escalation of tensions between China and Taiwan. This, in turn, is seen exerting some downward pressure on the AUD/JPY cross.
That said, the recent optimism led by hopes for additional stimulus from China might continue to act as a tailwind for the China-proxy Aussie. Apart from this, the Reserve Bank of Australia's (RBA) hawkish stance, signalling that policymakers are unwilling to rule out another cash rate increase in the wake of sticky inflation, could lend support to the AUD. This, in turn, warrants some caution before placing aggressive bearish bets around the AUD/JPY cross.
Meanwhile, a recession in Japan seems to have dashed hope for an imminent shift in the Bank of Japan's (BoJ) policy stance in the coming months. This could keep a lid on any meaningful appreciating move for the JPY and contribute to limiting the downside for the AUD/JPY cross. Hence, it will be prudent to wait for strong follow-through selling before confirming that spot prices have topped out and positioning for a deeper corrective decline.
-
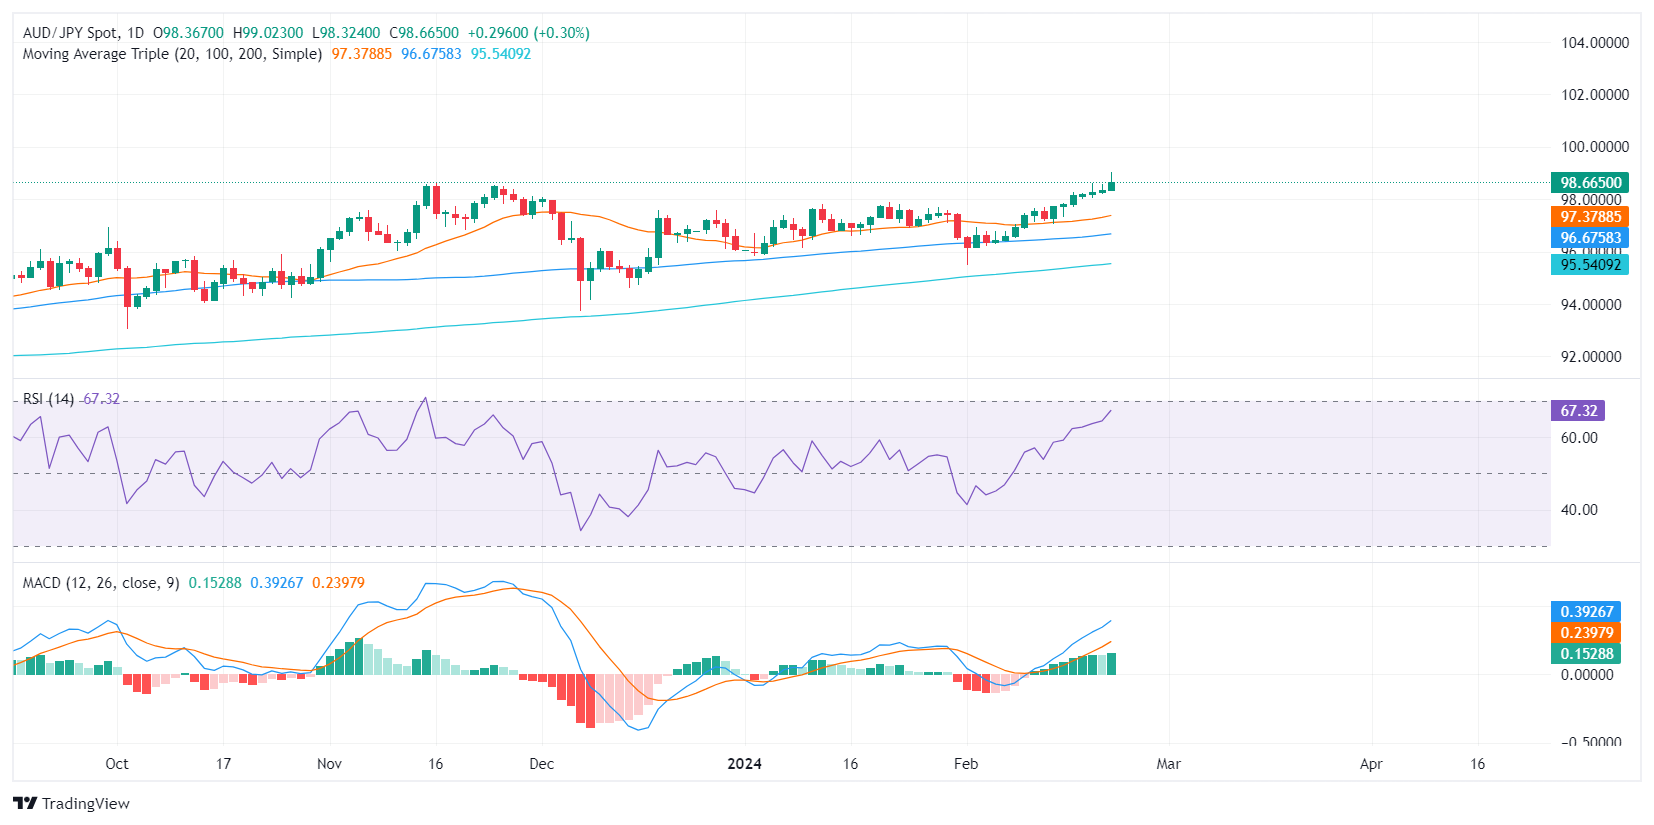
23.02.2024 18:23AUD/JPY Price Analysis: Buyers hold sway with hints of increasing sell-off, cross still in multi-year highs
- The AUD/JPY is trading at 98.71, showing a slight gain during the Friday session still in highs since 2015.
- Daily RSI for the AUD/JPY suggests bullish momentum with a slight increase in the positive area.
- Divergences are observed between the hourly and daily charts where the latter signals buyers' dominance whilst the hourly chart indicates rising short-term selling pressure.
In Friday's session, the AUD/JPY pair is trading at 98.715, reflecting a slight increase in buying pressure. The daily chart signals that the buyers are in control but that bears are starting to wake up, while in the hourly chart, the consolidation is more evident with indicators losing ground.
On the daily chart, the Relative Strength Index (RSI) pair shows a positive stance, signifying the dominance of buyers. This can be inferred from RSI territory, which consistently remains positive, despite a marginal downtrend observed within the positive territory. This suggests a slight increase in selling pressure, however, buyers continue to hold dominance given the RSI's positive territory position.
Concurrent with this, the daily Moving Average Convergence Divergence (MACD) is exhibiting flat green bars. This indicates that the momentum of the market is neutral on the surface, yet further scrutiny reveals that buyers hold the upper hand as the pair lingers above the 20, 100, and 200-day Simple Moving Averages (SMAs).
AUD/JPY daily chart
Upon examining the hourly chart, the RSI's position has diverted into negative territory while the MACD presents rising red bars suggesting a surge in selling pressure in the short term, contrasting the positive bias observed in the daily chart.
AUD/JPY hourly chart
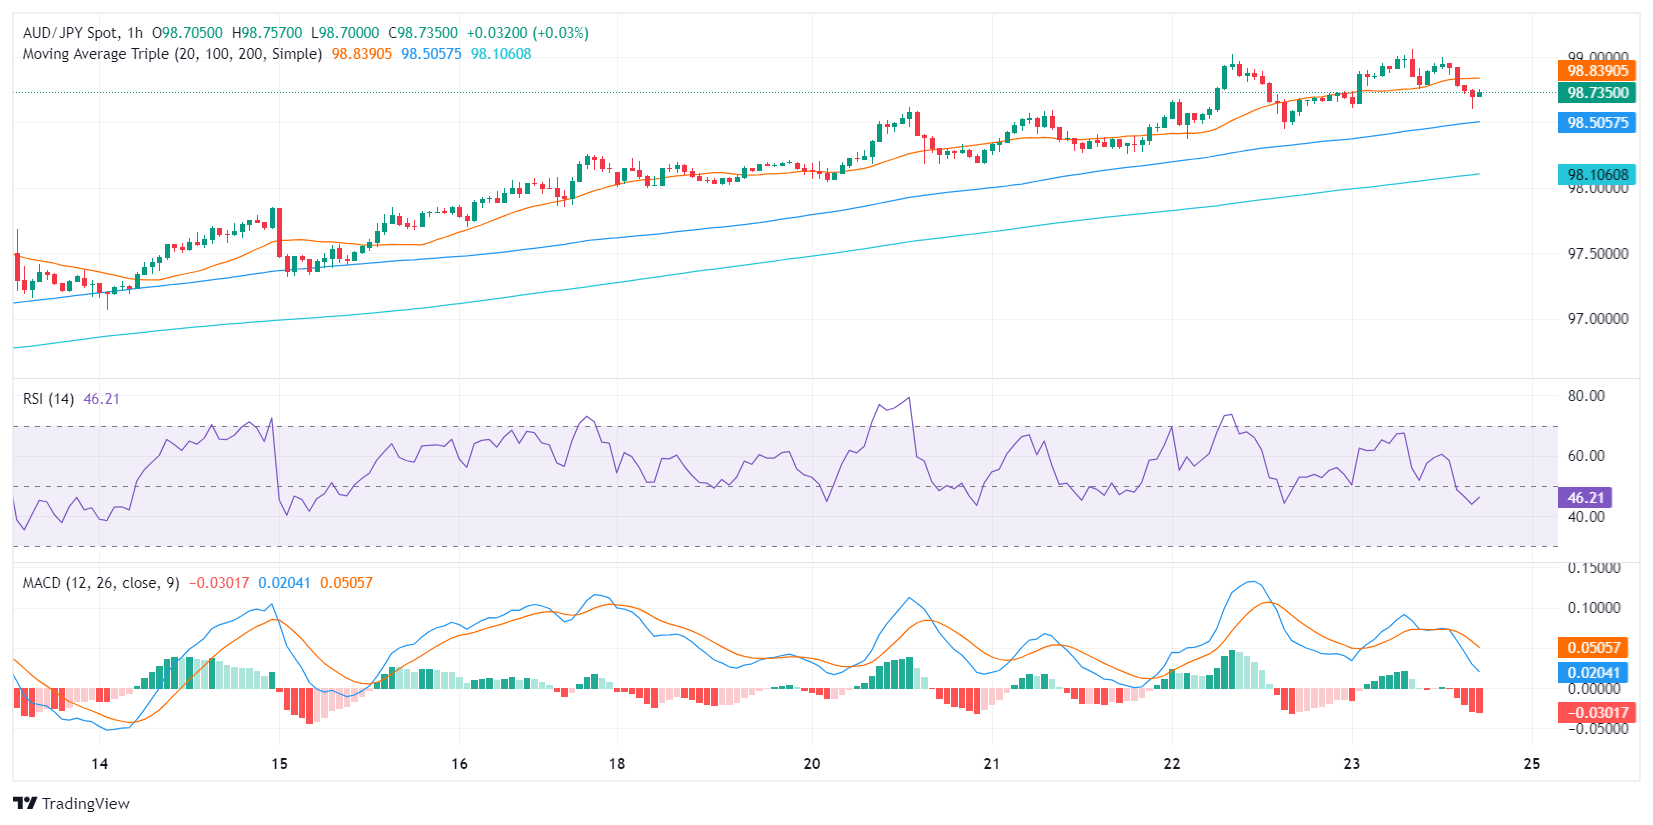
Conclusively, despite a short-term rise in selling pressure observed in the hourly chart, the longer-term daily chart suggests that buyers continue to control the market, fortified by the pair's position above the 20, 100, and 200-day SMAs.
-
23.02.2024 08:55AUD/JPY surges to all-time high near 99.00 on improved Australian private sector activity
- AUD/JPY surged to an all-time high as the Australian ASX 200 Index rose higher.
- BoJ could delay the plan of exiting from negative rates as Japan entered into a technical recession.
- Australian Dollar strengthened as recent PMI data indicated that February's economic activity returned to growth.
AUD/JPY rises to an all-time high near 99.00 during the European session on Friday, extending its winning streak that commenced on February 14. Market participants are concerned about the potential delay in the Bank of Japan's (BoJ) plan to exit from negative interest rates in the near term, particularly after last week's data showed that the Japanese economy entered into a technical recession. This downward pressure on the Japanese Yen (JPY) provides support for the AUD/JPY cross.
Furthermore, the surge in global money markets, as investors digest dashed hopes for interest rate cuts by major central banks worldwide, is exerting downward pressure on the safe-haven Japanese Yen (JPY). Conversely, Australia’s S&P/ASX 200 index moved higher following the overnight surge on Wall Street, which provides upward support for the Australian Dollar (AUD). This collective dynamic is contributing to the strength of the AUD/JPY cross.
Furthermore, investors persist in borrowing Japanese Yen (JPY) to invest in higher-yielding assets denominated in other currencies. However, recent verbal intervention by Japanese authorities may offer some support for the JPY. Vice Finance Minister for International Affairs Masato Kanda stated last week that authorities would take necessary actions if required.
Earlier in the week, the Japanese Yen received a boost from better-than-expected Trade Balance figures released by the Ministry of Finance of Japan. Market participants are now eagerly awaiting the release of Japan’s National Consumer Price Index (CPI) data scheduled for Tuesday.
The Australian Dollar (AUD) received upward support from domestic PMI data indicating that private sector activity returned to growth in February for the first time in five months, driven by a robust expansion in the services sector. Furthermore, the Aussie Dollar was buoyed by market sentiment suggesting the likelihood of no immediate rate cuts following the recent Meeting Minutes from the Reserve Bank of Australia (RBA).
-
22.02.2024 19:42AUD/JPY Price Analysis: Bullish momentum escalates and the cross reaches multi-year highs
- The AUD/JPY is currently trading at 98.648, marking a 0.20% increase in Thursday's session.
- The daily RSI for AUD/JPY suggests bullish momentum with an upward trend, indicating buyers are in charge.
- Despite intraday market volatility, the hourly RSI stays in the positive territory, underlining buyer's dominance.
- AUD/JPY's position above its main moving averages confirms the bullish outlook.
The AUD/JPY pair was seen trading at 98.648, marking a mild gain of 0.20% and reaching its highest level since 2015. The pair predominantly exhibits a bullish bias, per the insights from the Relative Strength Index (RSI) and Moving Average Convergence Divergence (MACD) on the daily chart. The RSI portrays a progressive uptrend, indicating consistent strengthening over recent sessions. This is further confirmed by the ascending green bars on the MACD histogram, signifying a favorable momentum. Despite some intraday fluctuations, the pair remains firmly in the hands of the buyers, being well positioned above the key Simple Moving Averages (SMAs) of 20,100 and 200 days.
The hourly RSI values paint a similar picture, despite some intraday volatility seen in the market. Although the RSI didn't maintain its position within the positive territory at all hours, it did stay above the negative zone, reflecting an overall bullish intraday sentiment.
In conclusion, despite some short-term uncertainties, the general outlook for the AUD/JPY pair seems bullish given the positive RSI values and rising MACD histogram. Whether looking at the daily or hourly chart, the momentum remains firm for the buyers, supported by the pair's position well above its primary moving averages.
AUD/JPY daily chart
AUD/JPY hourly chart


© 2000-2024. All rights reserved.
This site is managed by Teletrade D.J. LLC 2351 LLC 2022 (Euro House, Richmond Hill Road, Kingstown, VC0100, St. Vincent and the Grenadines).
The information on this website is for informational purposes only and does not constitute any investment advice.
The company does not serve or provide services to customers who are residents of the US, Canada, Iran, The Democratic People's Republic of Korea, Yemen and FATF blacklisted countries.
Making transactions on financial markets with marginal financial instruments opens up wide possibilities and allows investors who are willing to take risks to earn high profits, carrying a potentially high risk of losses at the same time. Therefore you should responsibly approach the issue of choosing the appropriate investment strategy, taking the available resources into account, before starting trading.
Use of the information: full or partial use of materials from this website must always be referenced to TeleTrade as the source of information. Use of the materials on the Internet must be accompanied by a hyperlink to teletrade.org. Automatic import of materials and information from this website is prohibited.
Please contact our PR department if you have any questions or need assistance at pr@teletrade.global.
transfers